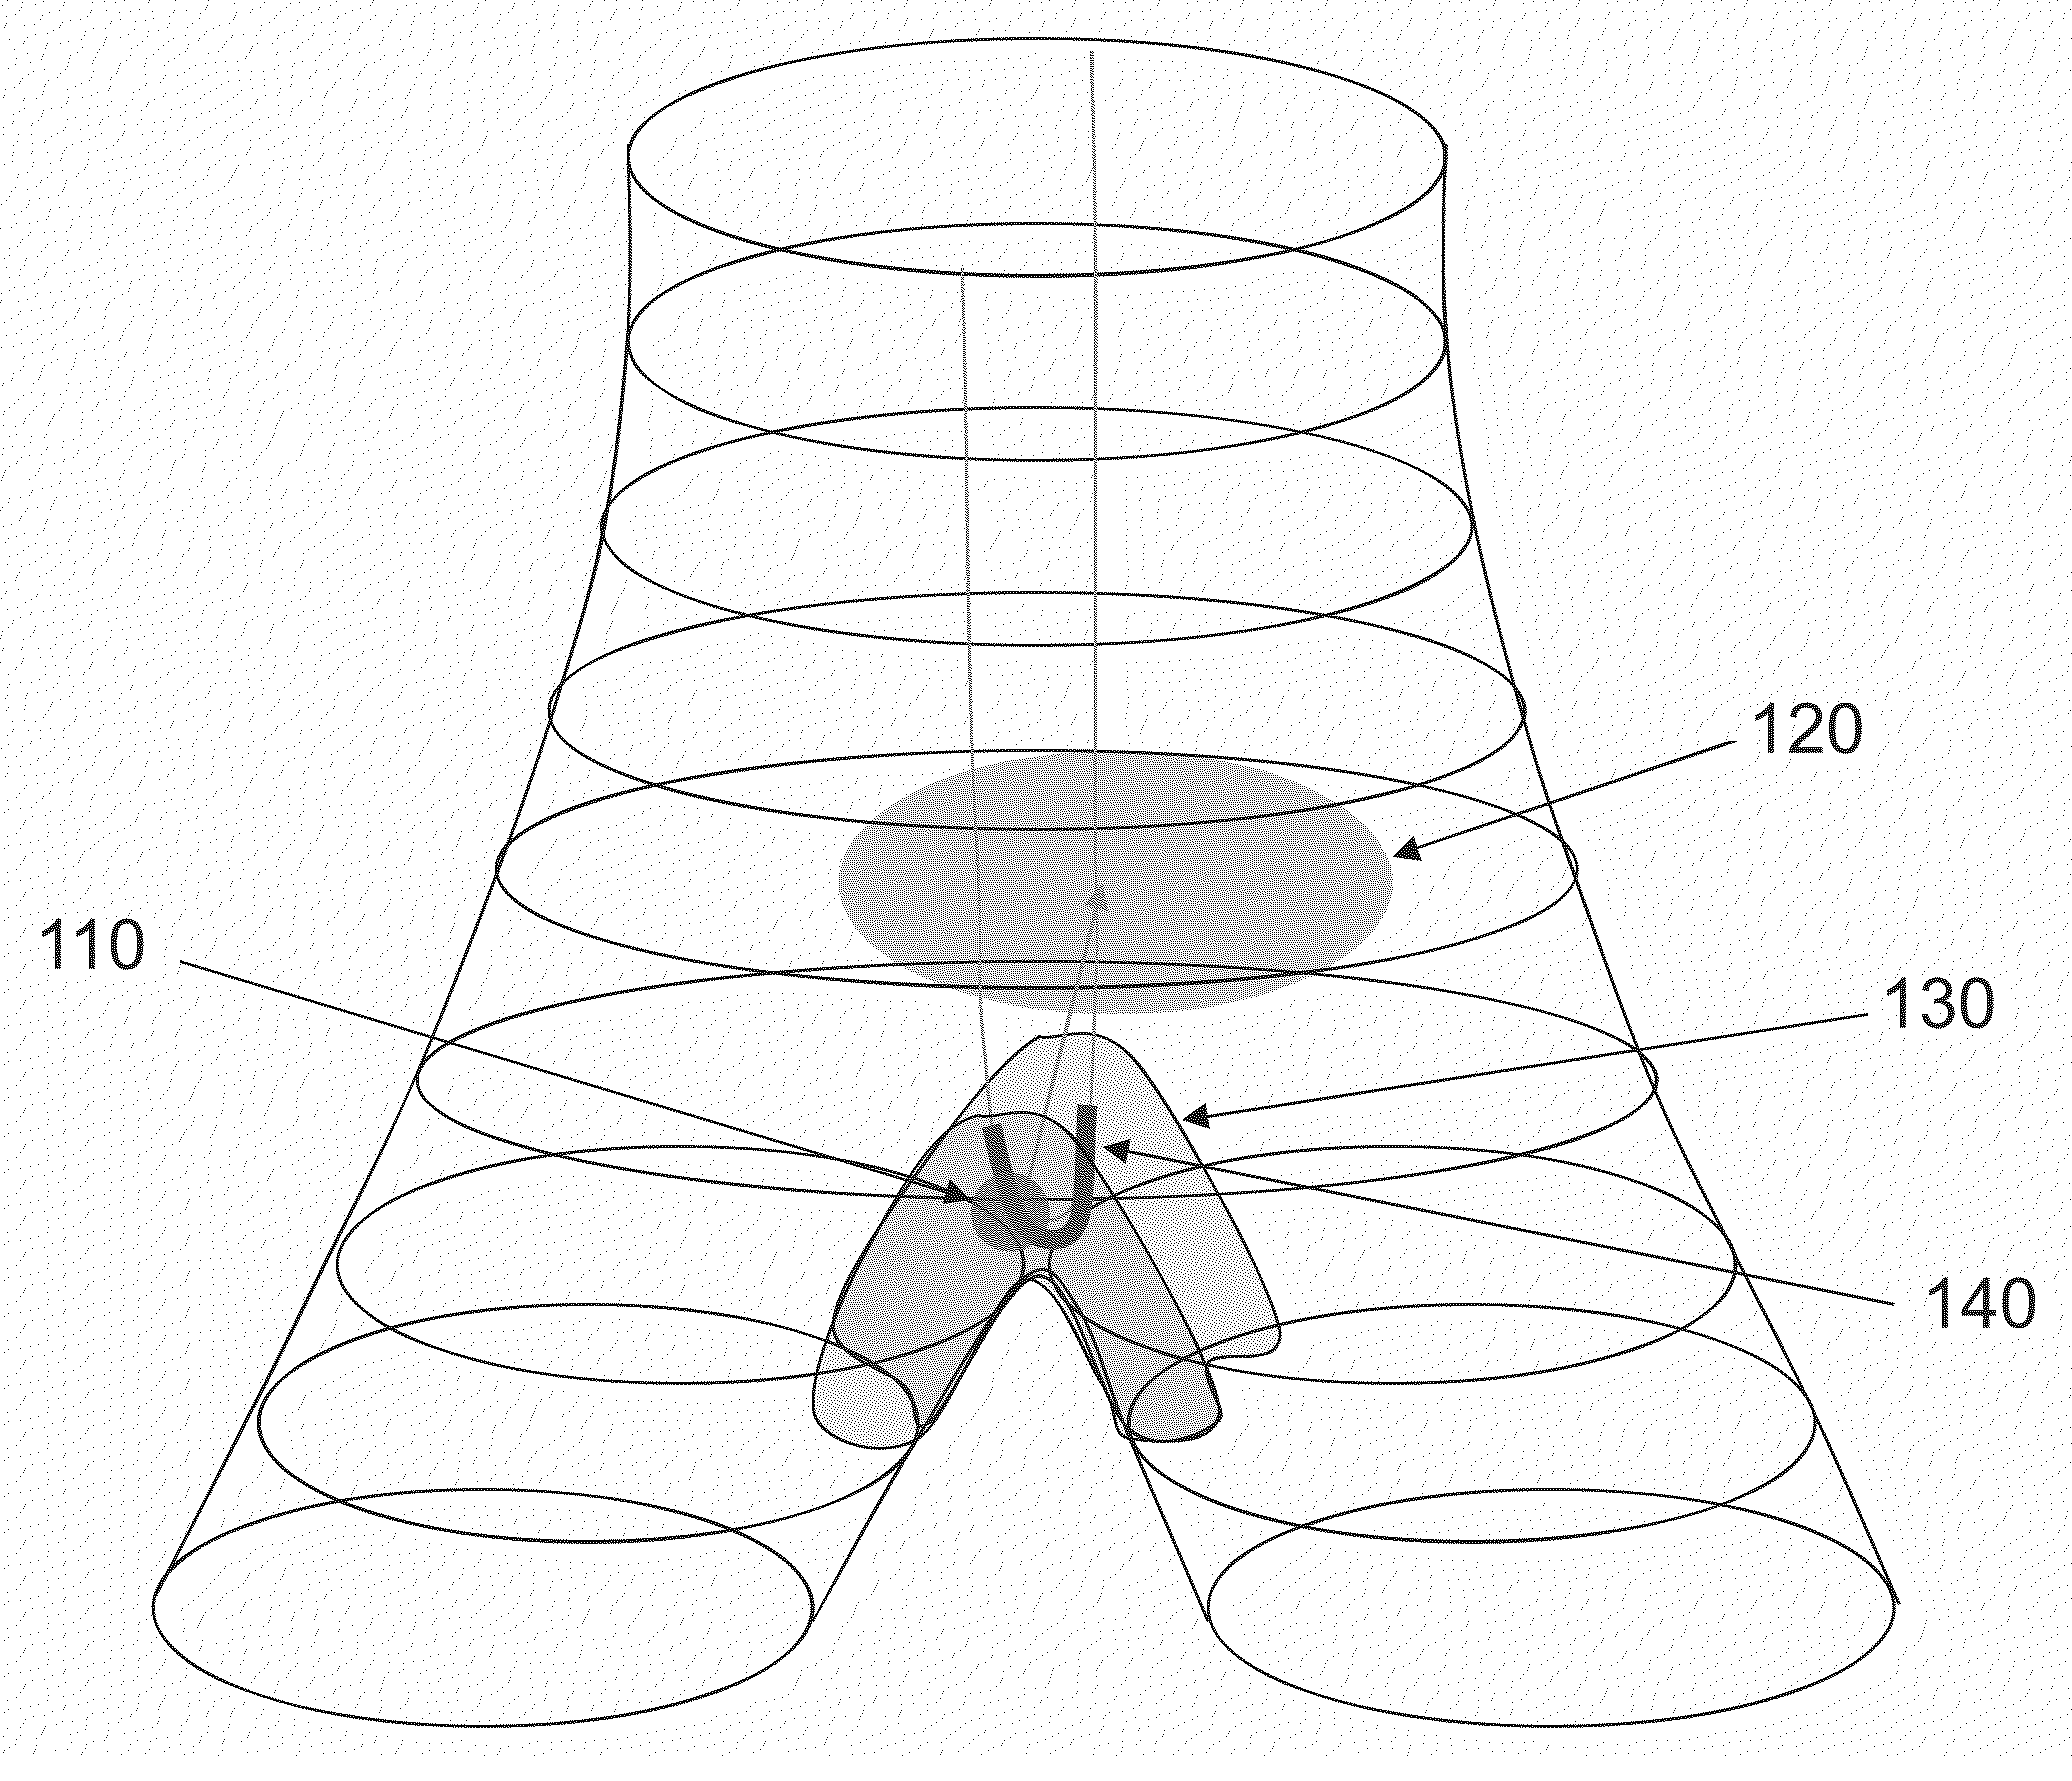
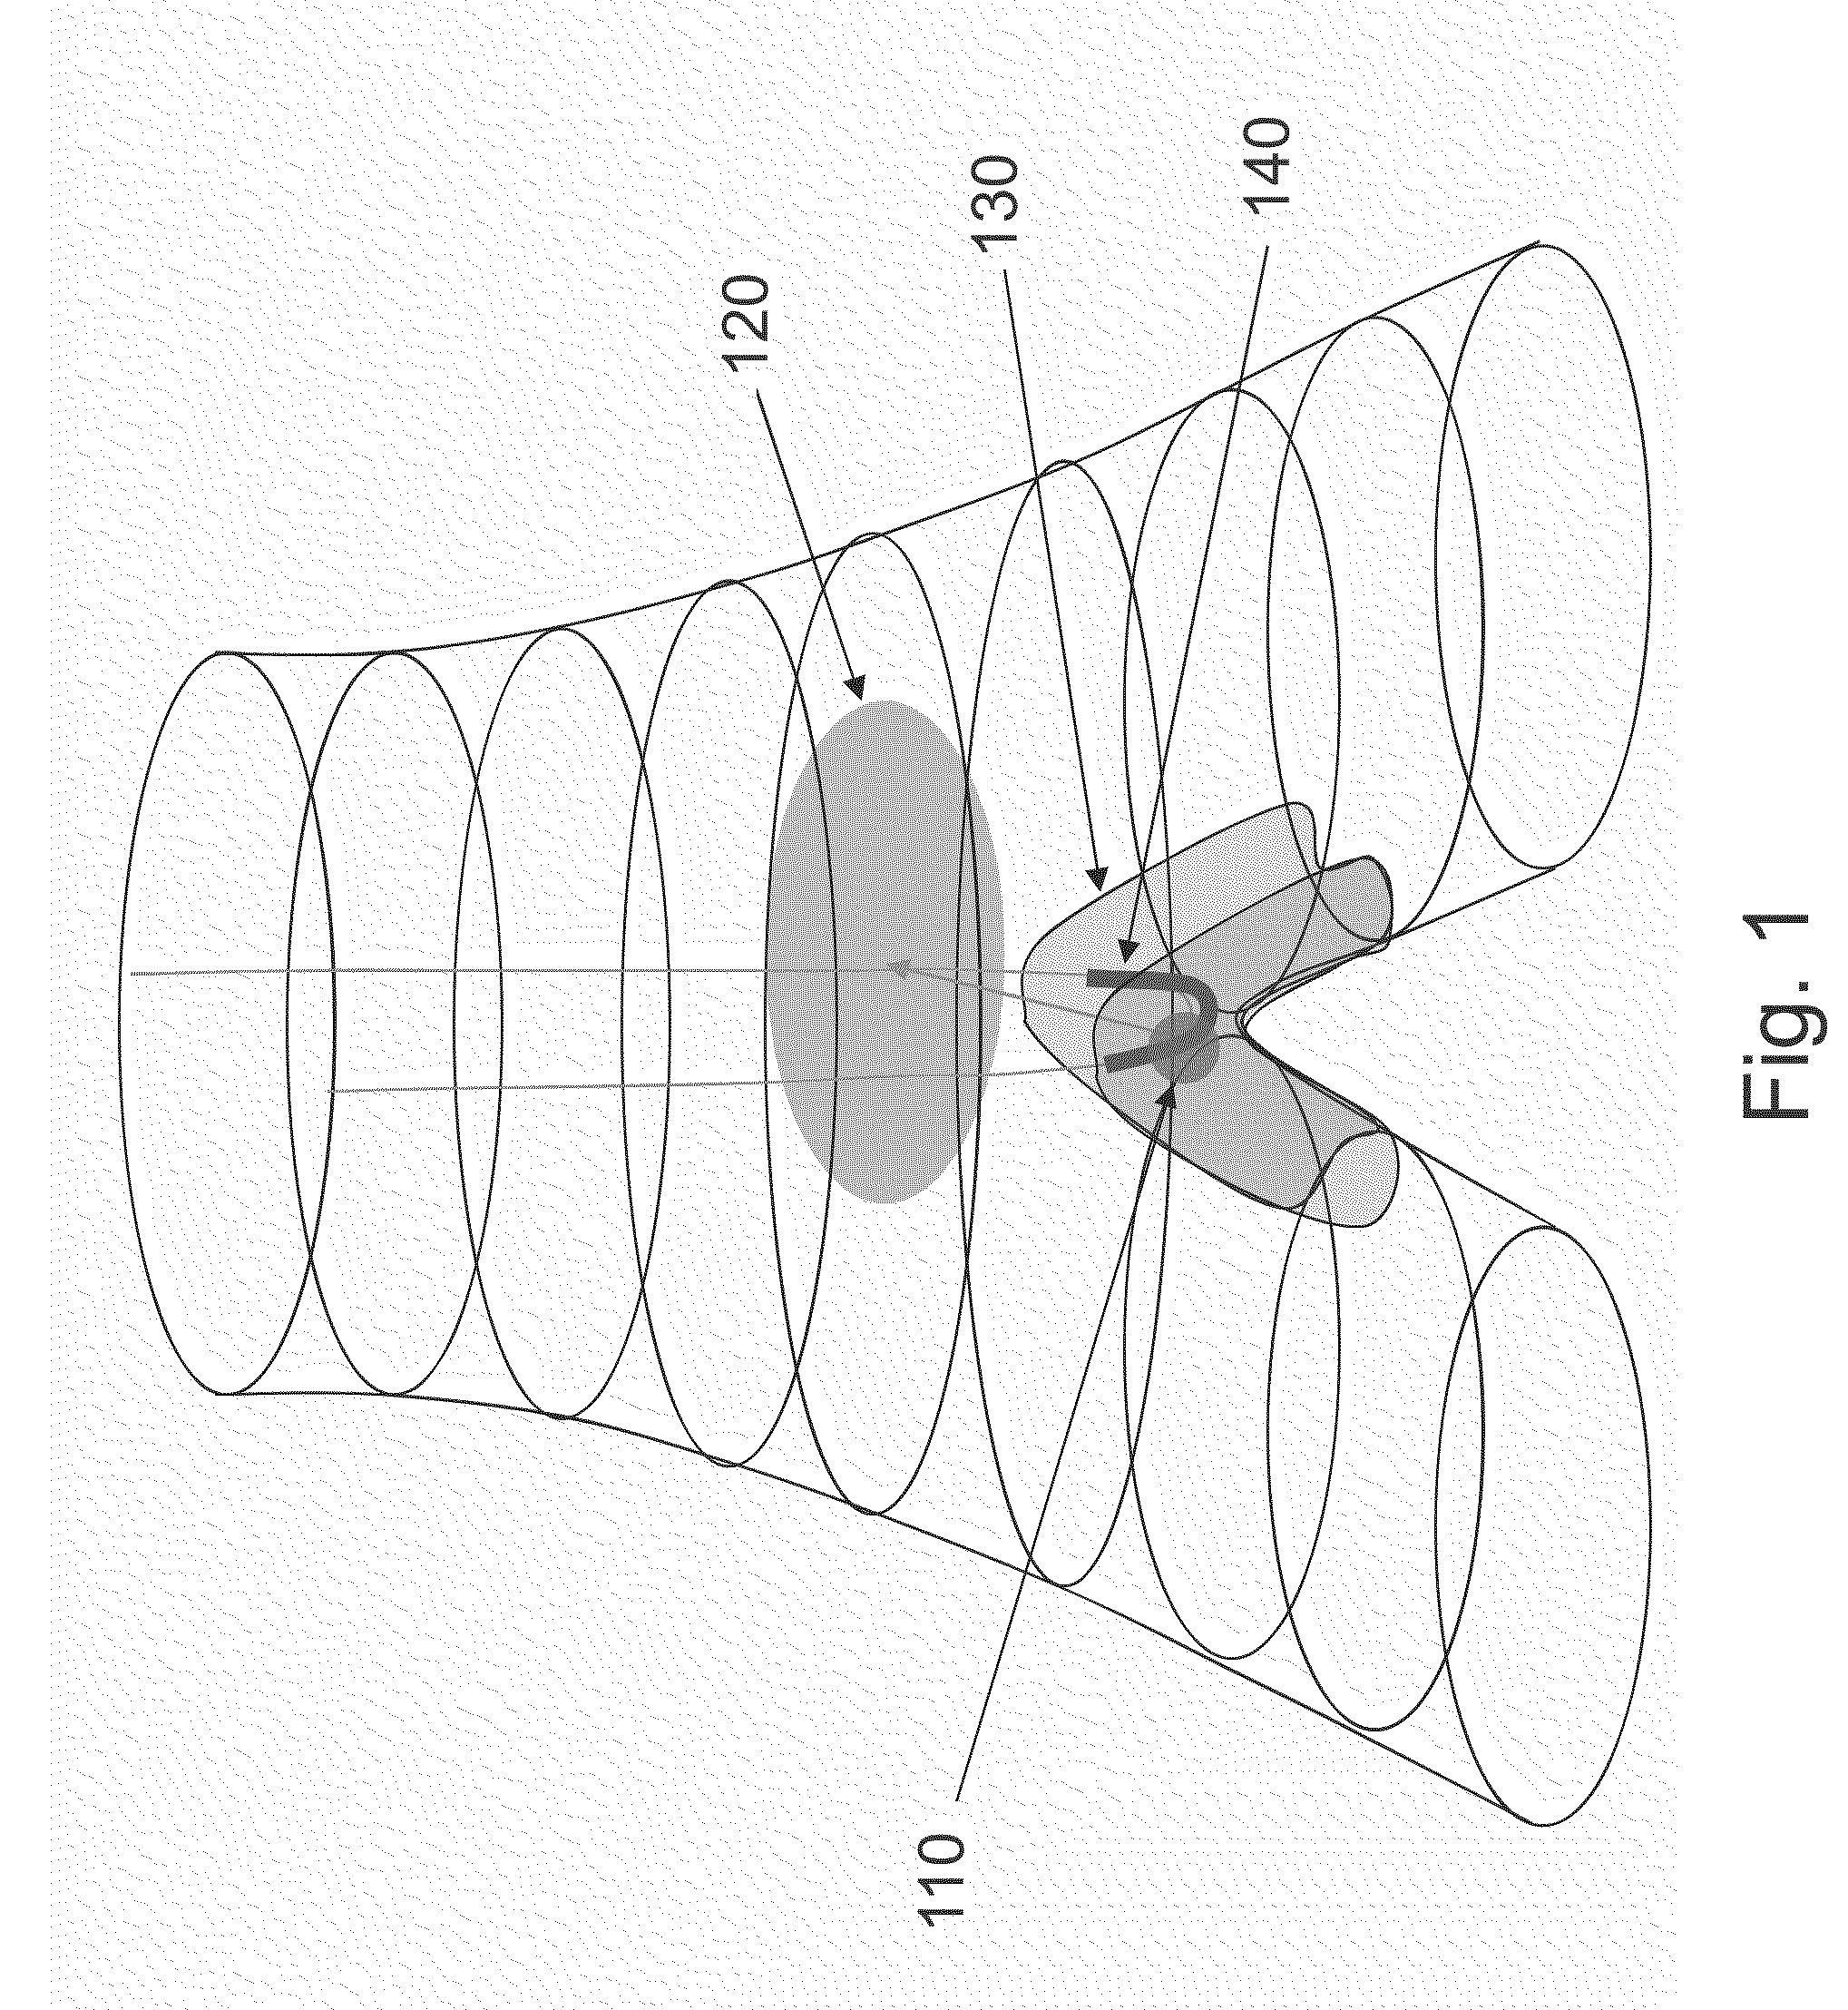
[0047]In another preferred embodiment the measurement of the shape of the bifurcation and surrounding tissues is also used to model risk. Deviations in the ideal shape of a bifurcation, such as thickening of the bifurcation, and any loss of tissue near the bifurcation (e.g. holes) are measured and provide additional information on the stress of the
airway tissues at and around bifurcation regions. Variations in
airway shape can serve to provide evidence of
increased stress, or provide evidence of a future increase or decrease in the focal deposition of particulate matter and each of these provides further refinement on
lung cancer risk. A decrease in risk can occur if a variation in shape serves to more evenly distribute particulate matter and therefore
toxic dose on the
respiratory epithelium.
[0048]In another preferred embodiment additional information on the lung environment is used to compute
lung cancer risk at each location throughout the lung. Information on the amount of ventilation,
perfusion, pH, and other lung characteristics are combined with spirometry measurements, such as FEV1 / FVC, and image measurements, such as Bifurcation Damage Index (BDI) and regional emphysema, to determine lung
cancer risk at each location in the lung. Ventilation decreases in the apex and increases in the base of the lung, so a gradient of FEV1 / FVC values can be constructed throughout the lung. Ventilation is further compromised near regions of emphysema and the regional
impact on FEV1 / FVC can be estimated. Measurement of
calcification is modulated by the variation of pH at different locations in the lung and the size, or the generation of the bifurcation, of the airways structures being measured allowing for measurement of
calcification damage, or BDI, attained in each region of the lung. Analysis of the combination of these and other characteristics permits lung
cancer risk
estimation at each location in the lung. 3D analysis of change in risk over time can be used to identify regions at high risk for developing lung
cancer. Regional calculation of risk and / or its change over time can be used to predict the location of a future lung cancer and inform risk mitigation and lung
cancer therapy planning strategies.
[0051]In another preferred embodiment, an estimate of the individual lung
cancer risk is obtained by analyzing the measurement of the pH of the lung, as may be obtained using an EBC device, the measurement results of a pulmonary function test such as can be obtained by spirometry, and the measurement of the level of X-
ray attenuation in the airways, such as the Bifurcation Damage Index (BDI). Applying a classifier to the distribution of measurements has the potential to better separate lung
cancer risk levels and patient sub-populations,
COPD patient populations, and individuals at risk and having other pulmonary related diseases.
[0057]In another preferred embodiment the lung
cancer risk index is used to create a personalized
lung cancer screening protocol that optimizes the number of visits, the
radiation dose, screening cost, and
cancer detection rate. A baseline CT scan combined with FEV1 / FVC data is combined to form the LCRI and follow-up screening plans are then calculated to verify the projected risk of the patient over time. Since obstruction and mineralization change slowly, the frequency and duration of screening can be optimized to the individual. It should be possible to perform some follow-up screening visits for low baseline risk patients by measuring
lung function (FEV1 / FVC) more often than a full
high resolution CT scan, thereby reducing the cost and
dose required for
lung cancer screening.

