Chip design and fabrication method optimized for profit

a chip design and profit technology, applied in the field of chip design and fabrication, can solve the problems of cost-effective design changes required to optimize yield as a function of any metric, reduce yield as a function of another metric, etc., and achieve the effect of optimizing yield and maximizing profit potential

Active Publication Date: 2010-11-18
SIEMENS PROD LIFECYCLE MANAGEMENT SOFTWARE INC
View PDF15 Cites 21 Cited by
  • Summary
  • Abstract
  • Description
  • Claims
  • Application Information

AI Technical Summary

Benefits of technology

[0005]In view of the foregoing, disclosed herein are embodiments of a computer-implemented method of designing a chip to optimize yielding parts in different bins as a function of multiple diverse metrics and further to maximize the profit potential of the resulting chip bins. Specifically, the embodiments separately calculate multiple different joint probability distributions, each as a function of a different metric (e.g., performance, power consumption, etc.). Discrete yield curves are then generated based on each of the joint probability distributions. That is, each joint probability distribution function is integrated over an operating range of interest (i.e., minimum and maximum limits on the particular metric which correlate to the parameters of the statistical models) to create a yield curve. A profit function then reduces the values of all of these metrics (e.g., performance values, power consumption values, etc.) to a common profit denominator (e.g., to monetary values indicating profit that may be associated with a given metric value). The profit function and, more particularly, the monetary values can be used to combine the various yield curves into a combined profit-based yield curve from which a profit model can be generated. Based on this profit model, changes to the chip design can be made in order to optimize yield as a function of all of the diverse metrics (e.g., performance, power consumption, etc.) and further to maximize the profit potential of the resulting chips. That is, this profit model allows a designer to balance, based on potential profit changes, the impact that design changes (i.e., parameter changes) would have on yield as a function of different metrics and, thereby to determine the best design for both yield and profit.
[0009]Once the yield curves are generated, a profit function can be applied that reduces the values of all of the metrics to a common profit denominator. For example, monetary values can be associated with the first values, the second values, and with any additional values. These monetary values can then be used to combine the various yield curves of the various metrics into a combined profit-based yield curve from which a profit model can be generated. Subsequently, the design of the chip can be modified, based on the combined profit-based yield curve and, more particularly, based on the profit model, in order to optimize yield as a function of the different values for the different metrics (i.e., the first values, the second values and any additional values) and maximize profit potential by considering the monetary values associated with the different values for the different metrics (i.e., the first values, the second values, and any additional values). That is, this model allows a designer to consider the impact on profit of any proposed design changes (i.e., parameter changes), when performing a balancing process (i.e., a trade-off process between proposed design changes) in order to optimize yield as a function of multiple different metrics and, thereby to determine the best design for both yield and profit.
[0014]Based on this timing-power-profit model, the design of the chip can be modified in order to simultaneously optimize yield as a function of both the first values and the second values (i.e., the performance and power consumption values) and maximize profit potential by considering the monetary values for the performance and power consumption values. That is, this timing-power-profit model allows a designer to consider the impact on profit of any proposed design changes (i.e., parameter changes), when performing a balancing process (i.e., a trade-off process between proposed design changes) in order to optimize yield as a function of both performance and power consumption in order to determine the best design for both yield and profit.

Problems solved by technology

However, because the different metrics (e.g., performance, power consumption, etc.) may have different sensitivities to different process variations, making design changes to optimize yield as a function of one metric may result in a reduction in yield as a function of another metric and vice versa.
Furthermore, design changes required to optimize yield as a function of any metric may not be cost-efficient.

Method used


Image

  • Chip design and fabrication method optimized for profit
  • Chip design and fabrication method optimized for profit
  • Chip design and fabrication method optimized for profit

Examples


Embodiment Construction

[0022]The embodiments of the invention and the various features and advantageous details thereof are explained more fully with reference to the non-limiting embodiments that are illustrated in the accompanying drawings and detailed in the following description.

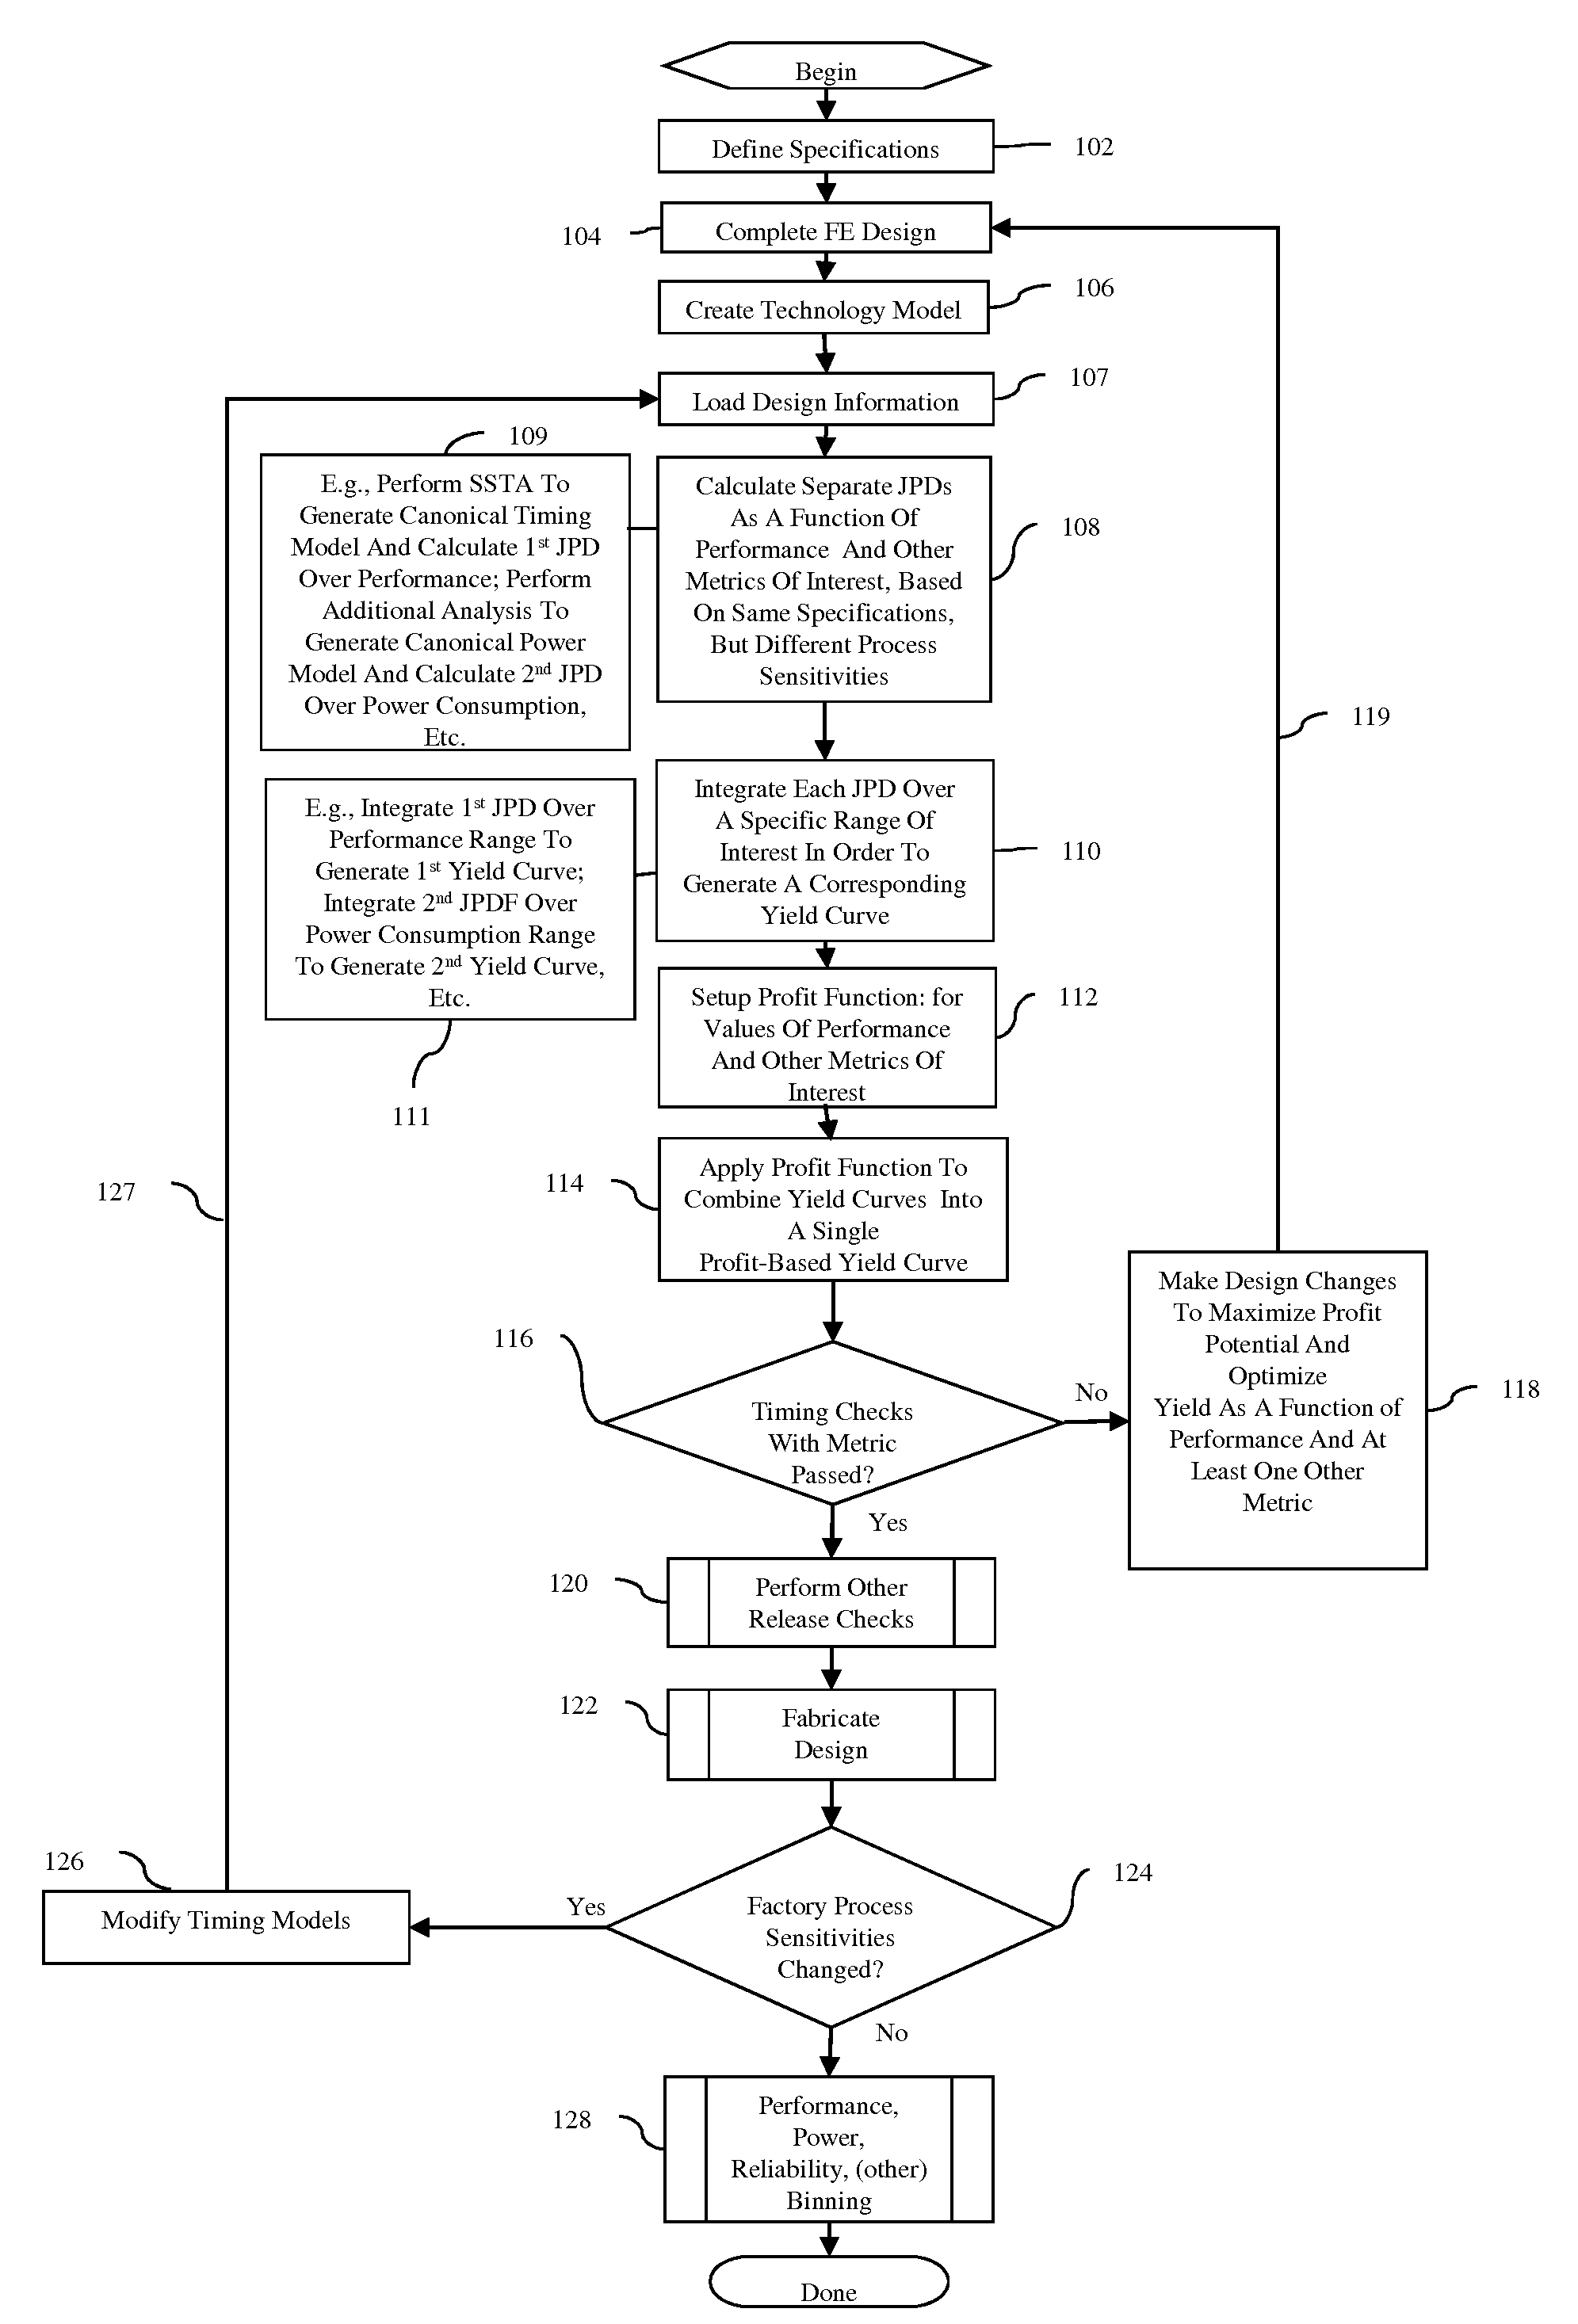
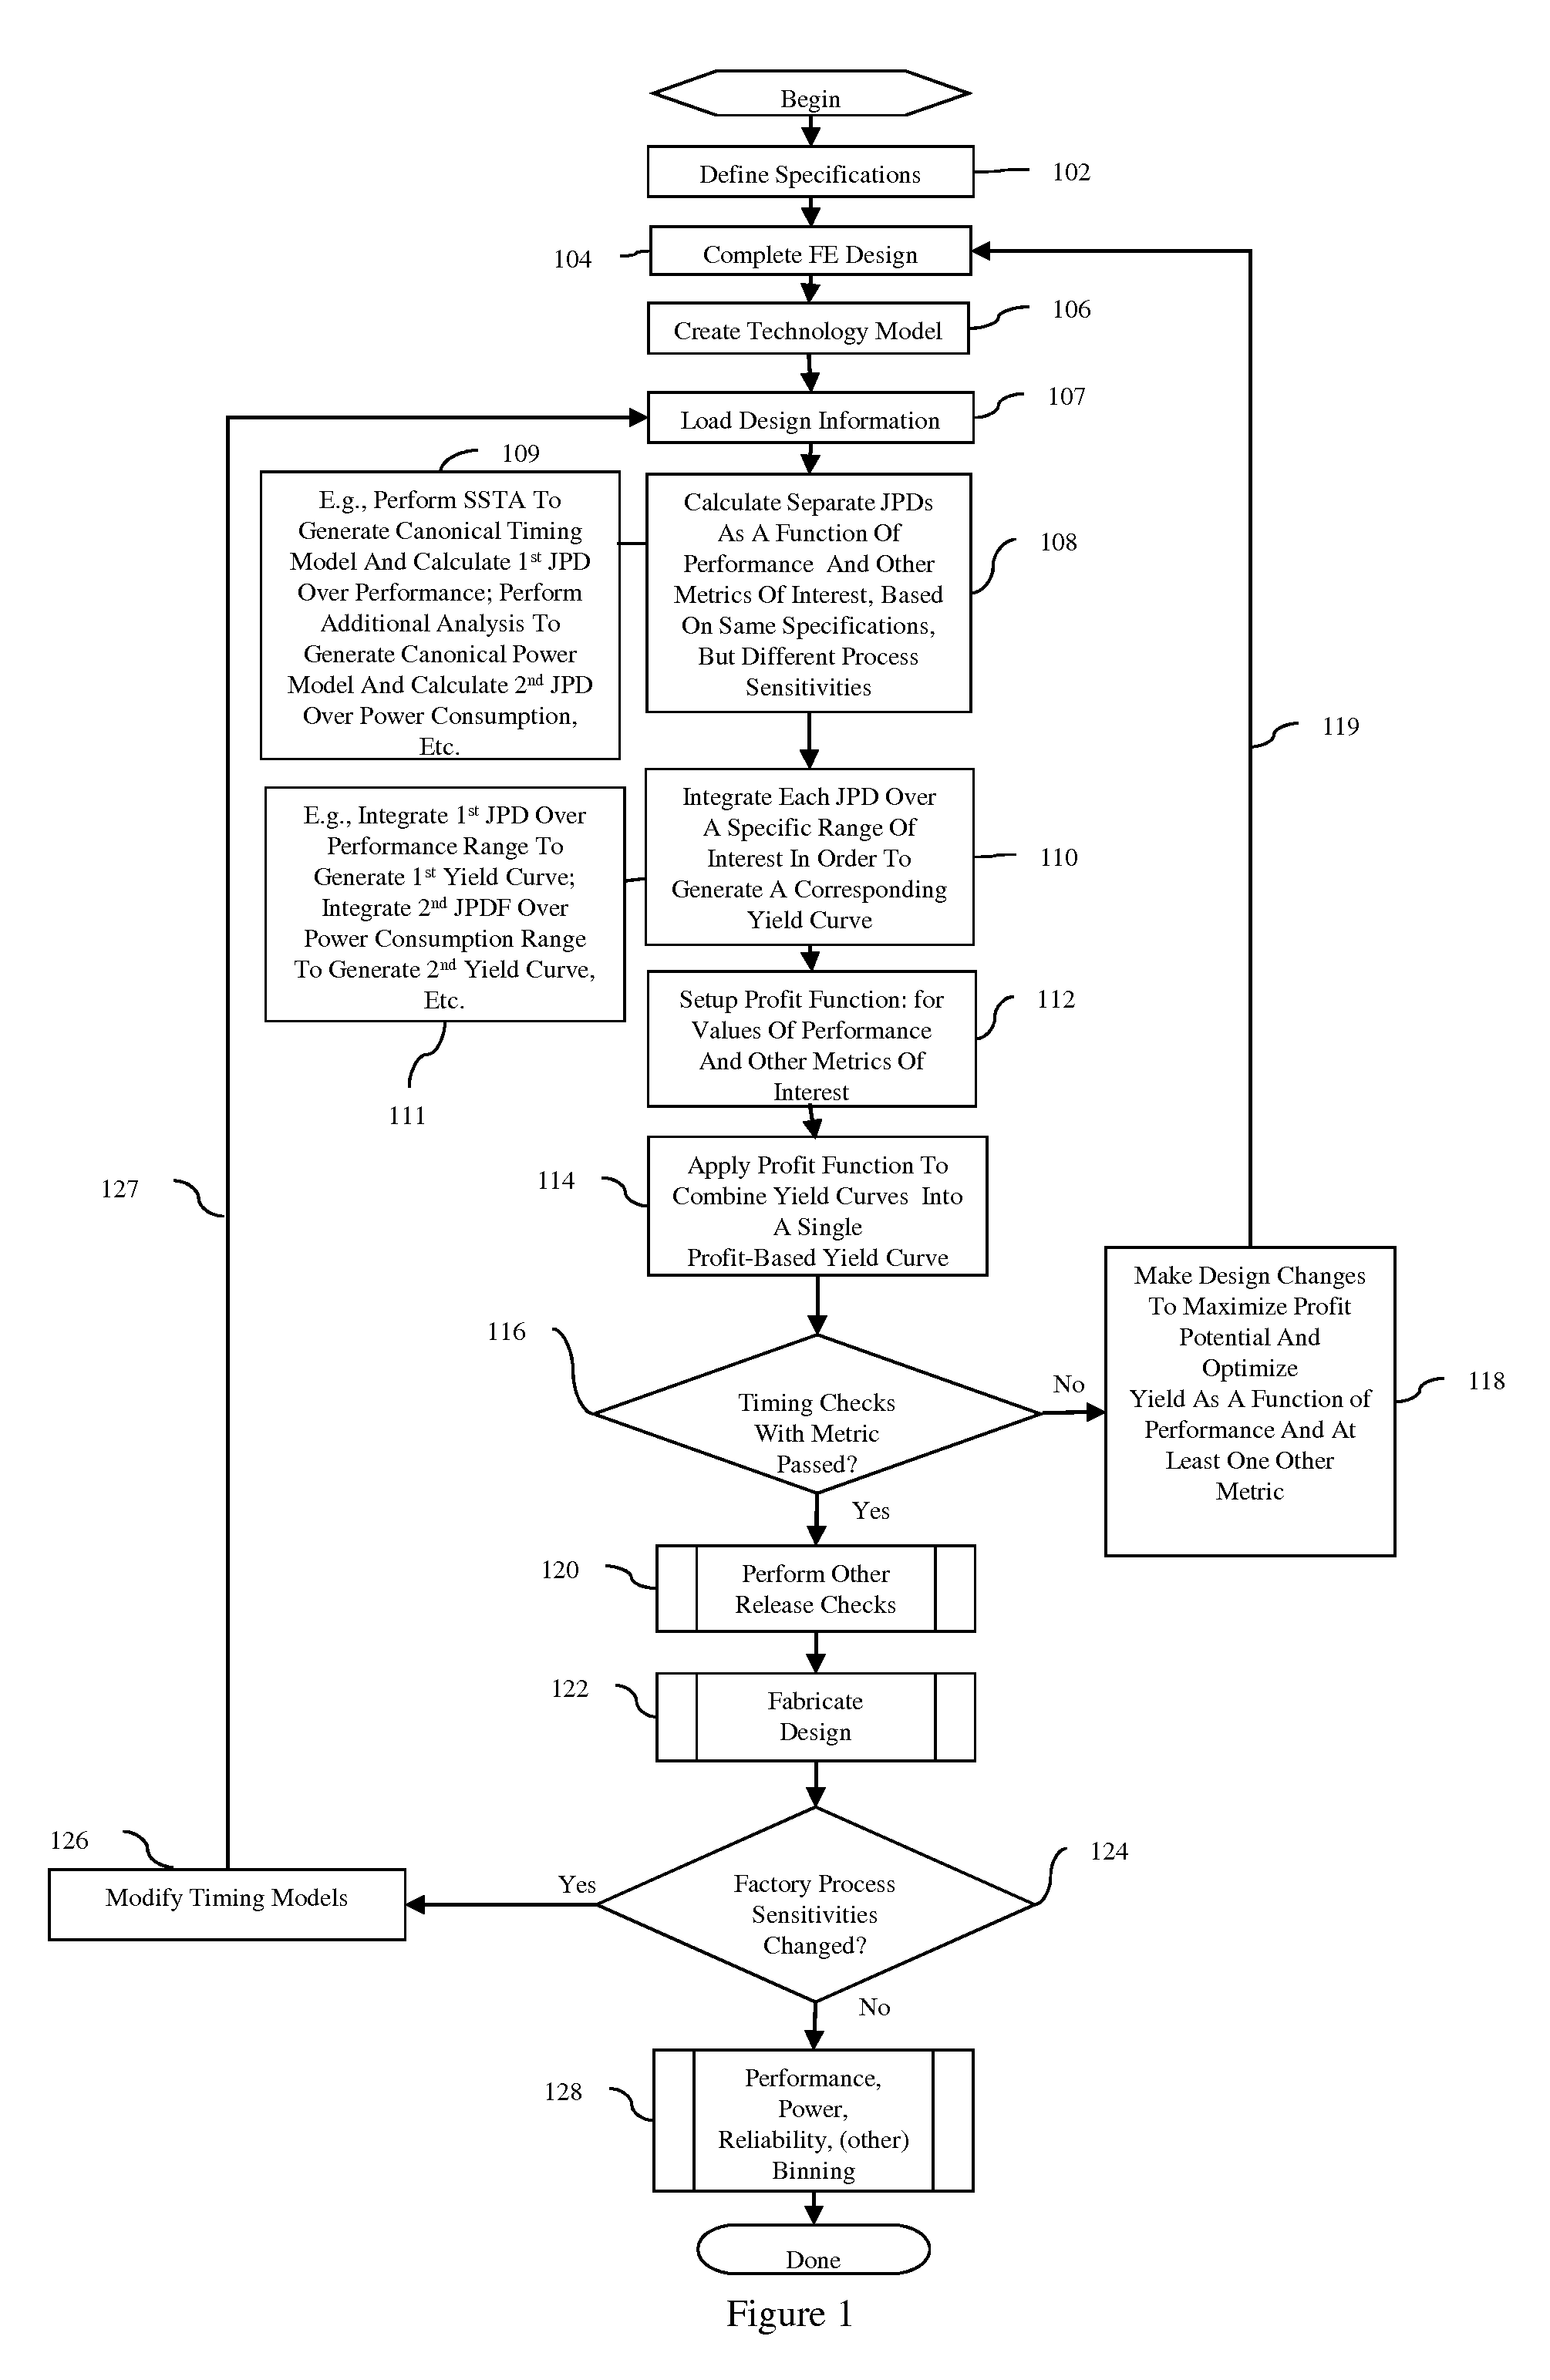
[0023]As discussed above, in conventional chip design and fabrication, Statistical Static Timing Analysis (SSTA) can be used to determine the parametric yield of a designed chip as a function of chip performance (i.e., the fraction or percentage of chips that are able to be manufactured and that can achieve pre-defined performance limits, such as clock frequency limits). To accomplish this, the dependence of chip performance on multiple different process parameter variations can be analyzed and a joint probability distribution function can be computed. From this a yield curve as a function of performance restrictions can be generated by integrating the joint probability distribution function over an operating range of interest...


PUM


Abstract

Disclosed is a computer-implemented method for designing a chip to optimize yielding parts in different bins as a function of multiple diverse metrics and further to maximize the profit potential of the resulting chip bins. The method separately calculates joint probability distributions (JPD), each JPD being a function of a different metric (e.g., performance, power consumption, etc.). Based on the JPDs, corresponding yield curves are generated. A profit function then reduces the values of all of these metrics (e.g., performance values, power consumption values, etc.) to a common profit denominator (e.g., to monetary values indicating profit that may be associated with a given metric value). The profit function and, more particularly, the monetary values can be used to combine the various yield curves into a combined profit-based yield curve from which a profit model can be generated. Based on this profit model, changes to the chip design can be made in order to optimize yield as a function of all of the diverse metrics (e.g., performance, power consumption, etc.) and further to maximize the profit potential of the resulting chips.

Description

BACKGROUND[0001]1. Field of the Invention[0002]The embodiments of the invention generally relate to chip design and fabrication and, more specifically, to a method of designing a chip to optimize yield as a function of multiple metrics (e.g., performance, power consumption, etc.) and further to maximize profit potential.[0003]2. Description of the Related Art[0004]In conventional chip design and fabrication, Statistical Static Timing Analysis (SSTA) can be used to determine the parametric yield of a designed chip as a function of chip performance (i.e., the fraction or percentage of chips that are able to be manufactured and that can achieve pre-defined performance limits, such as clock frequency limits). To accomplish this, the dependence of chip performance on multiple different process parameter variations can be analyzed and a joint probability distribution can be calculated. Based on this joint probability distribution, a yield-performance curve can be generated. Design changes...

Claims


Application Information

Patent Timeline
Patent Type & Authority Applications(United States)
IPC IPC(8): G06F17/50
CPCG06F17/5045G06F17/5031G06F30/3312G06F30/30G06F30/3315G06F2111/08
Inventor BUCK, NATHANCHEN, HOWARD H.ECKHARDT, JAMES P.FOREMAN, ERIC A.GREGERSON, JAMES C.HABITZ, PETER A.LICHTENSTEIGER, SUSAN K.VISWESWARIAH, CHANDRAMOULIWILDER, TAD J.
Owner SIEMENS PROD LIFECYCLE MANAGEMENT SOFTWARE INC
Why Eureka
Try Eureka