Simple algorithm for quantifying polymorphisms in electropherograms

a polymorphism and electropherogram technology, applied in the field of simple algorithm for quantifying polymorphisms in electropherograms, can solve the problems of chromosomes being hard to unwind, chromosomes being difficult to unwind, and chemical modifications can interfere with the machinery of protein production, etc., to achieve the effect of simple, cost-effective and accura

Inactive Publication Date: 2011-09-29
COONEY CRAIG A
View PDF0 Cites 1 Cited by
  • Summary
  • Abstract
  • Description
  • Claims
  • Application Information

AI Technical Summary

Benefits of technology

[0023]Yet, another and highly preferred object is a method that works well over the entire range of methylation levels, making it suitable for analyses of hypo- and hypermethylation and of methylation associated with imprinting.

Problems solved by technology

Chemical modifications can interfere with the machinery of protein manufacture, shutting genes down directly or making chromosomes hard to unwind.
However, there are difficulties and / or disadvantages associated with the methods described heretofore.
Some of these methods are limited to just one or a few sites.
But, this method is not quantitative without subcloning, sequencing and averaging each sample (35-37) or without use of complex, specialized algorithms (26).
(22) described a simple way to quantify DNA methylation from BGS four-dye-trace electropherograms, but they show the maximum mean signal generated to be just over 80% methylation (that is known not to be the case), and they suggest that quantification by bisulfite treatment may be intrinsically problematic.

Method used


Image

  • Simple algorithm for quantifying polymorphisms in electropherograms
  • Simple algorithm for quantifying polymorphisms in electropherograms
  • Simple algorithm for quantifying polymorphisms in electropherograms

Examples


example 1

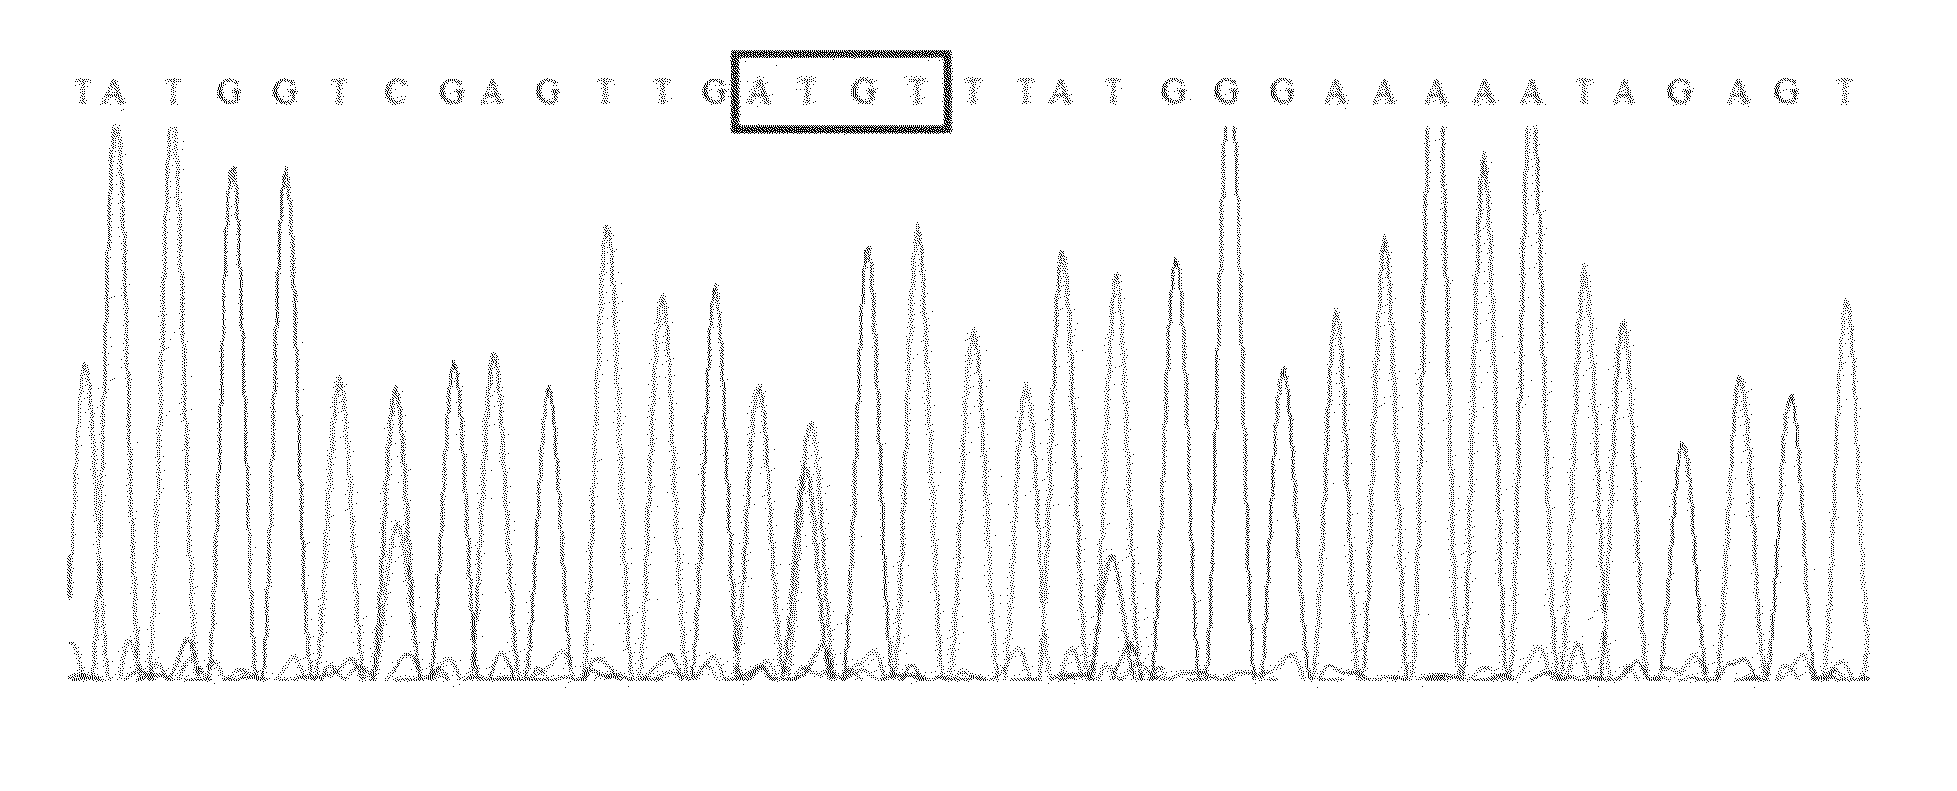
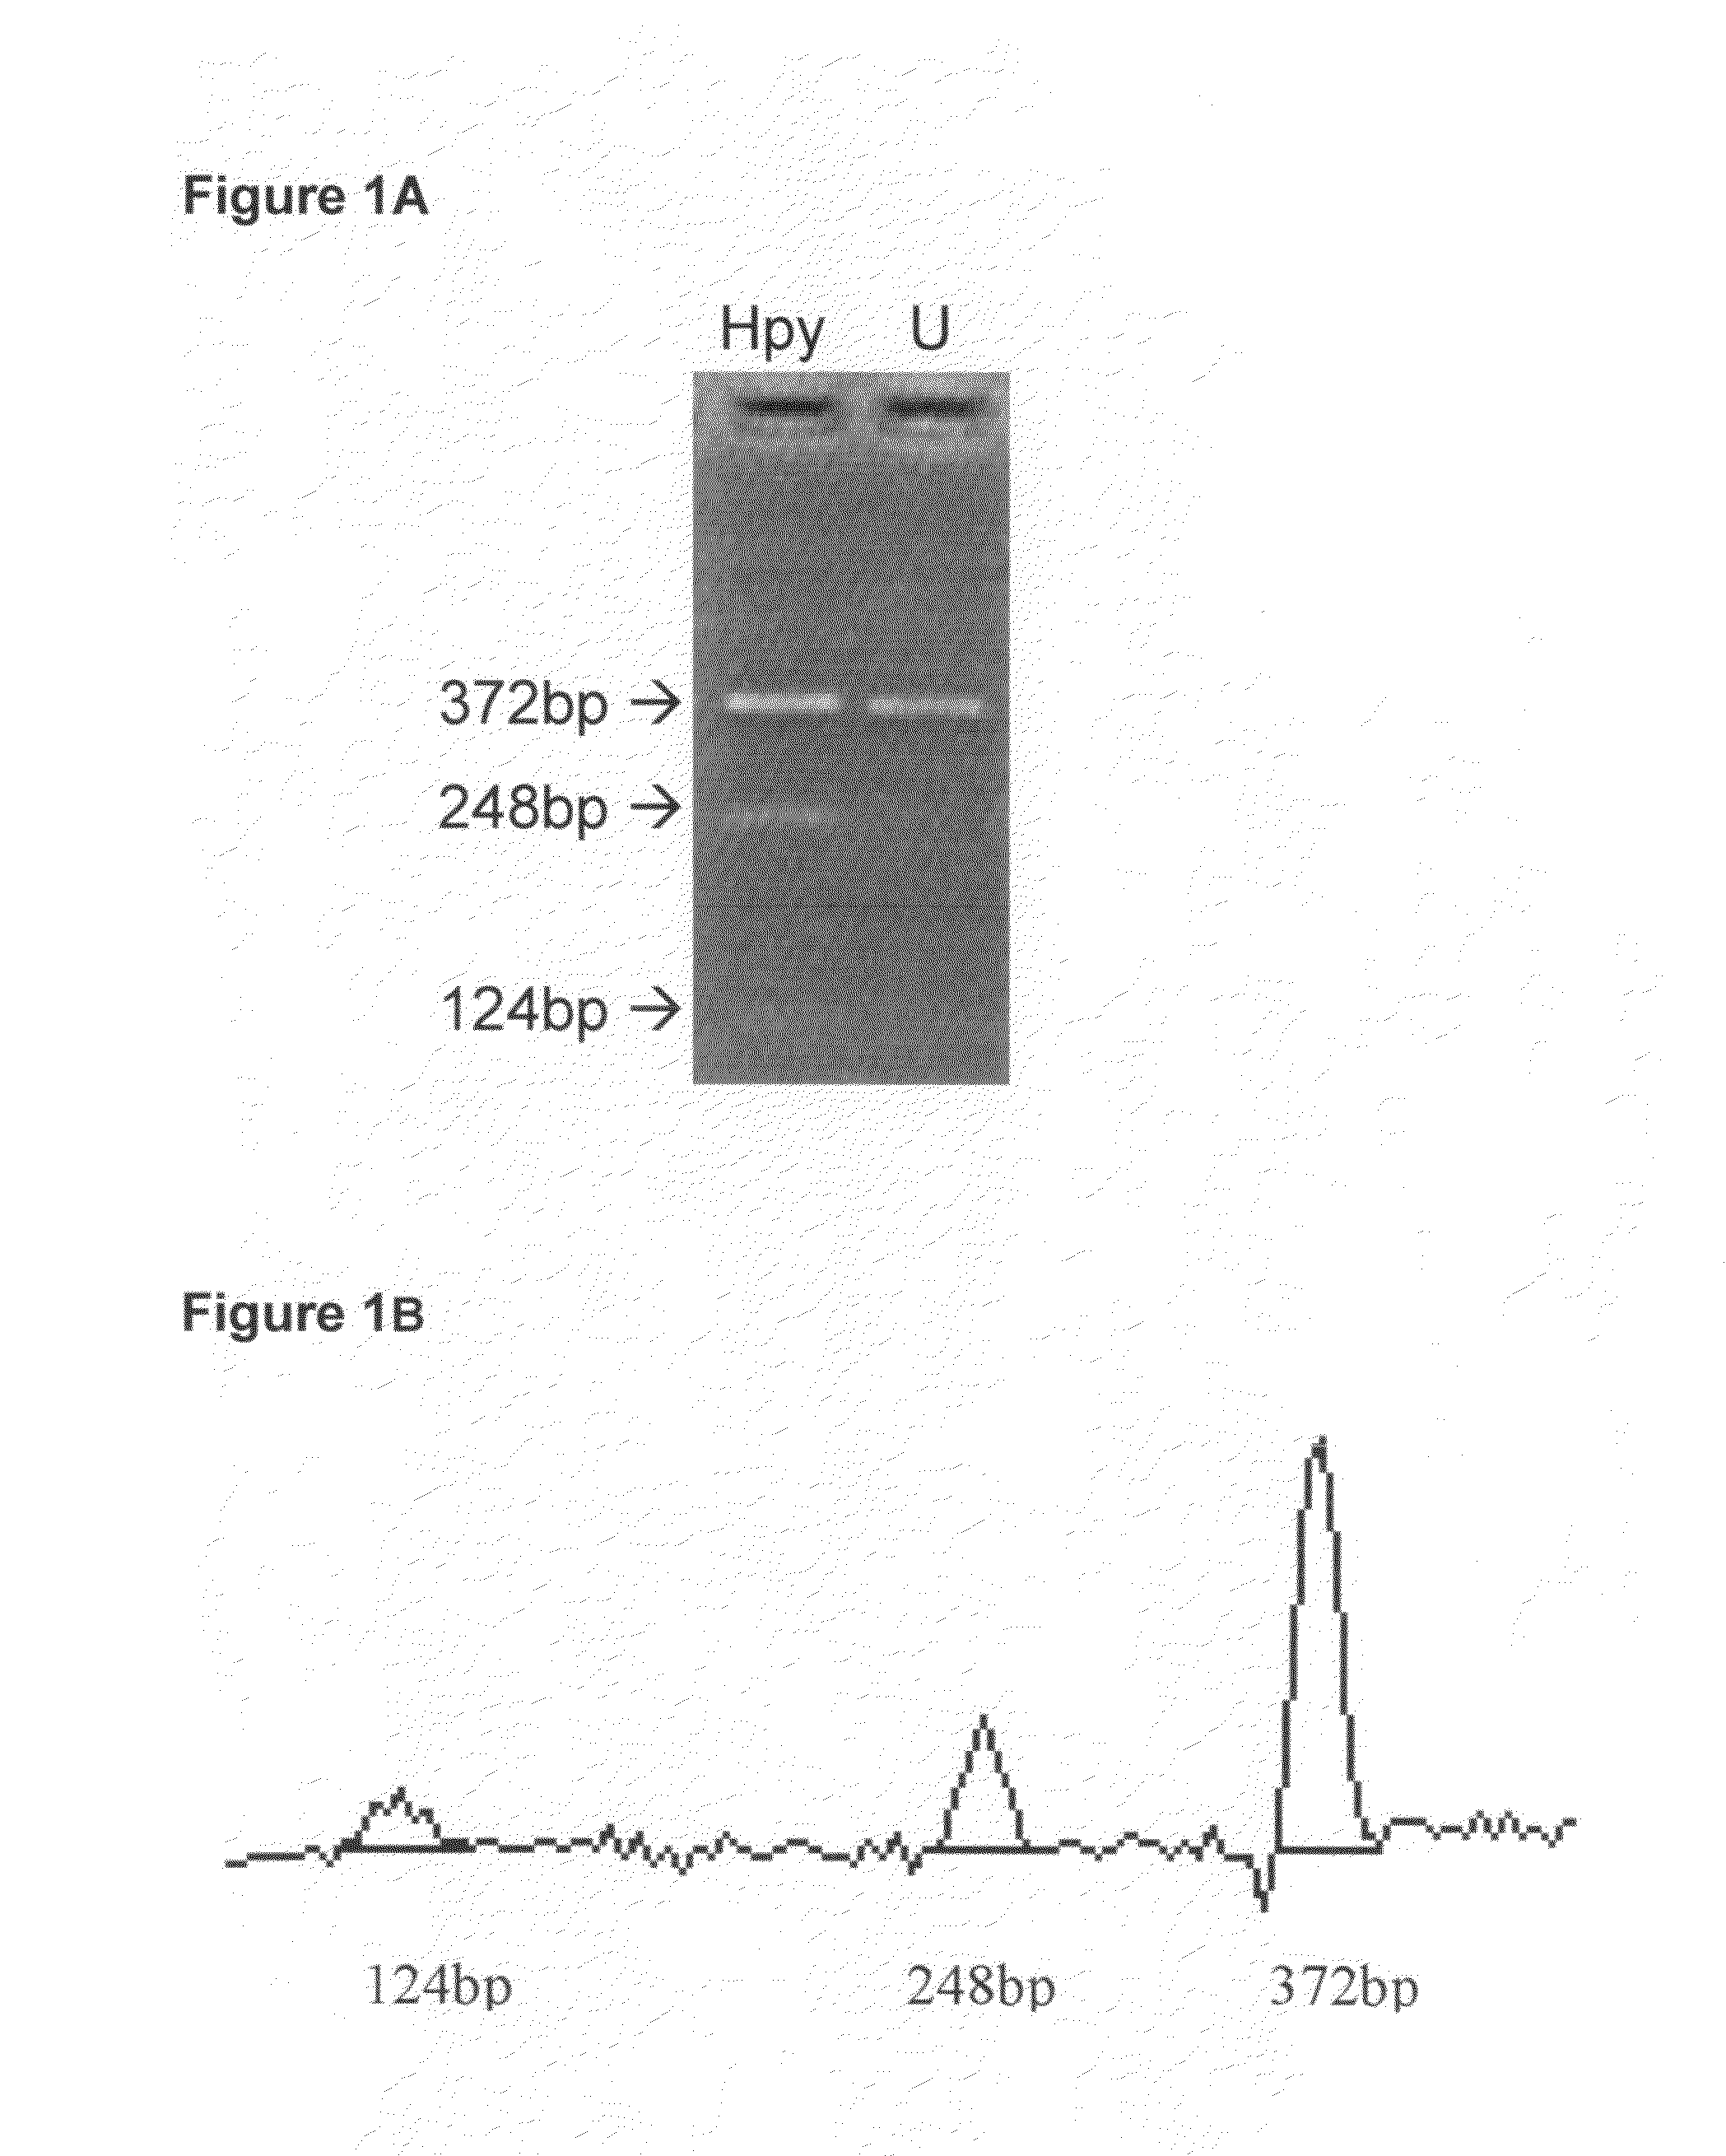
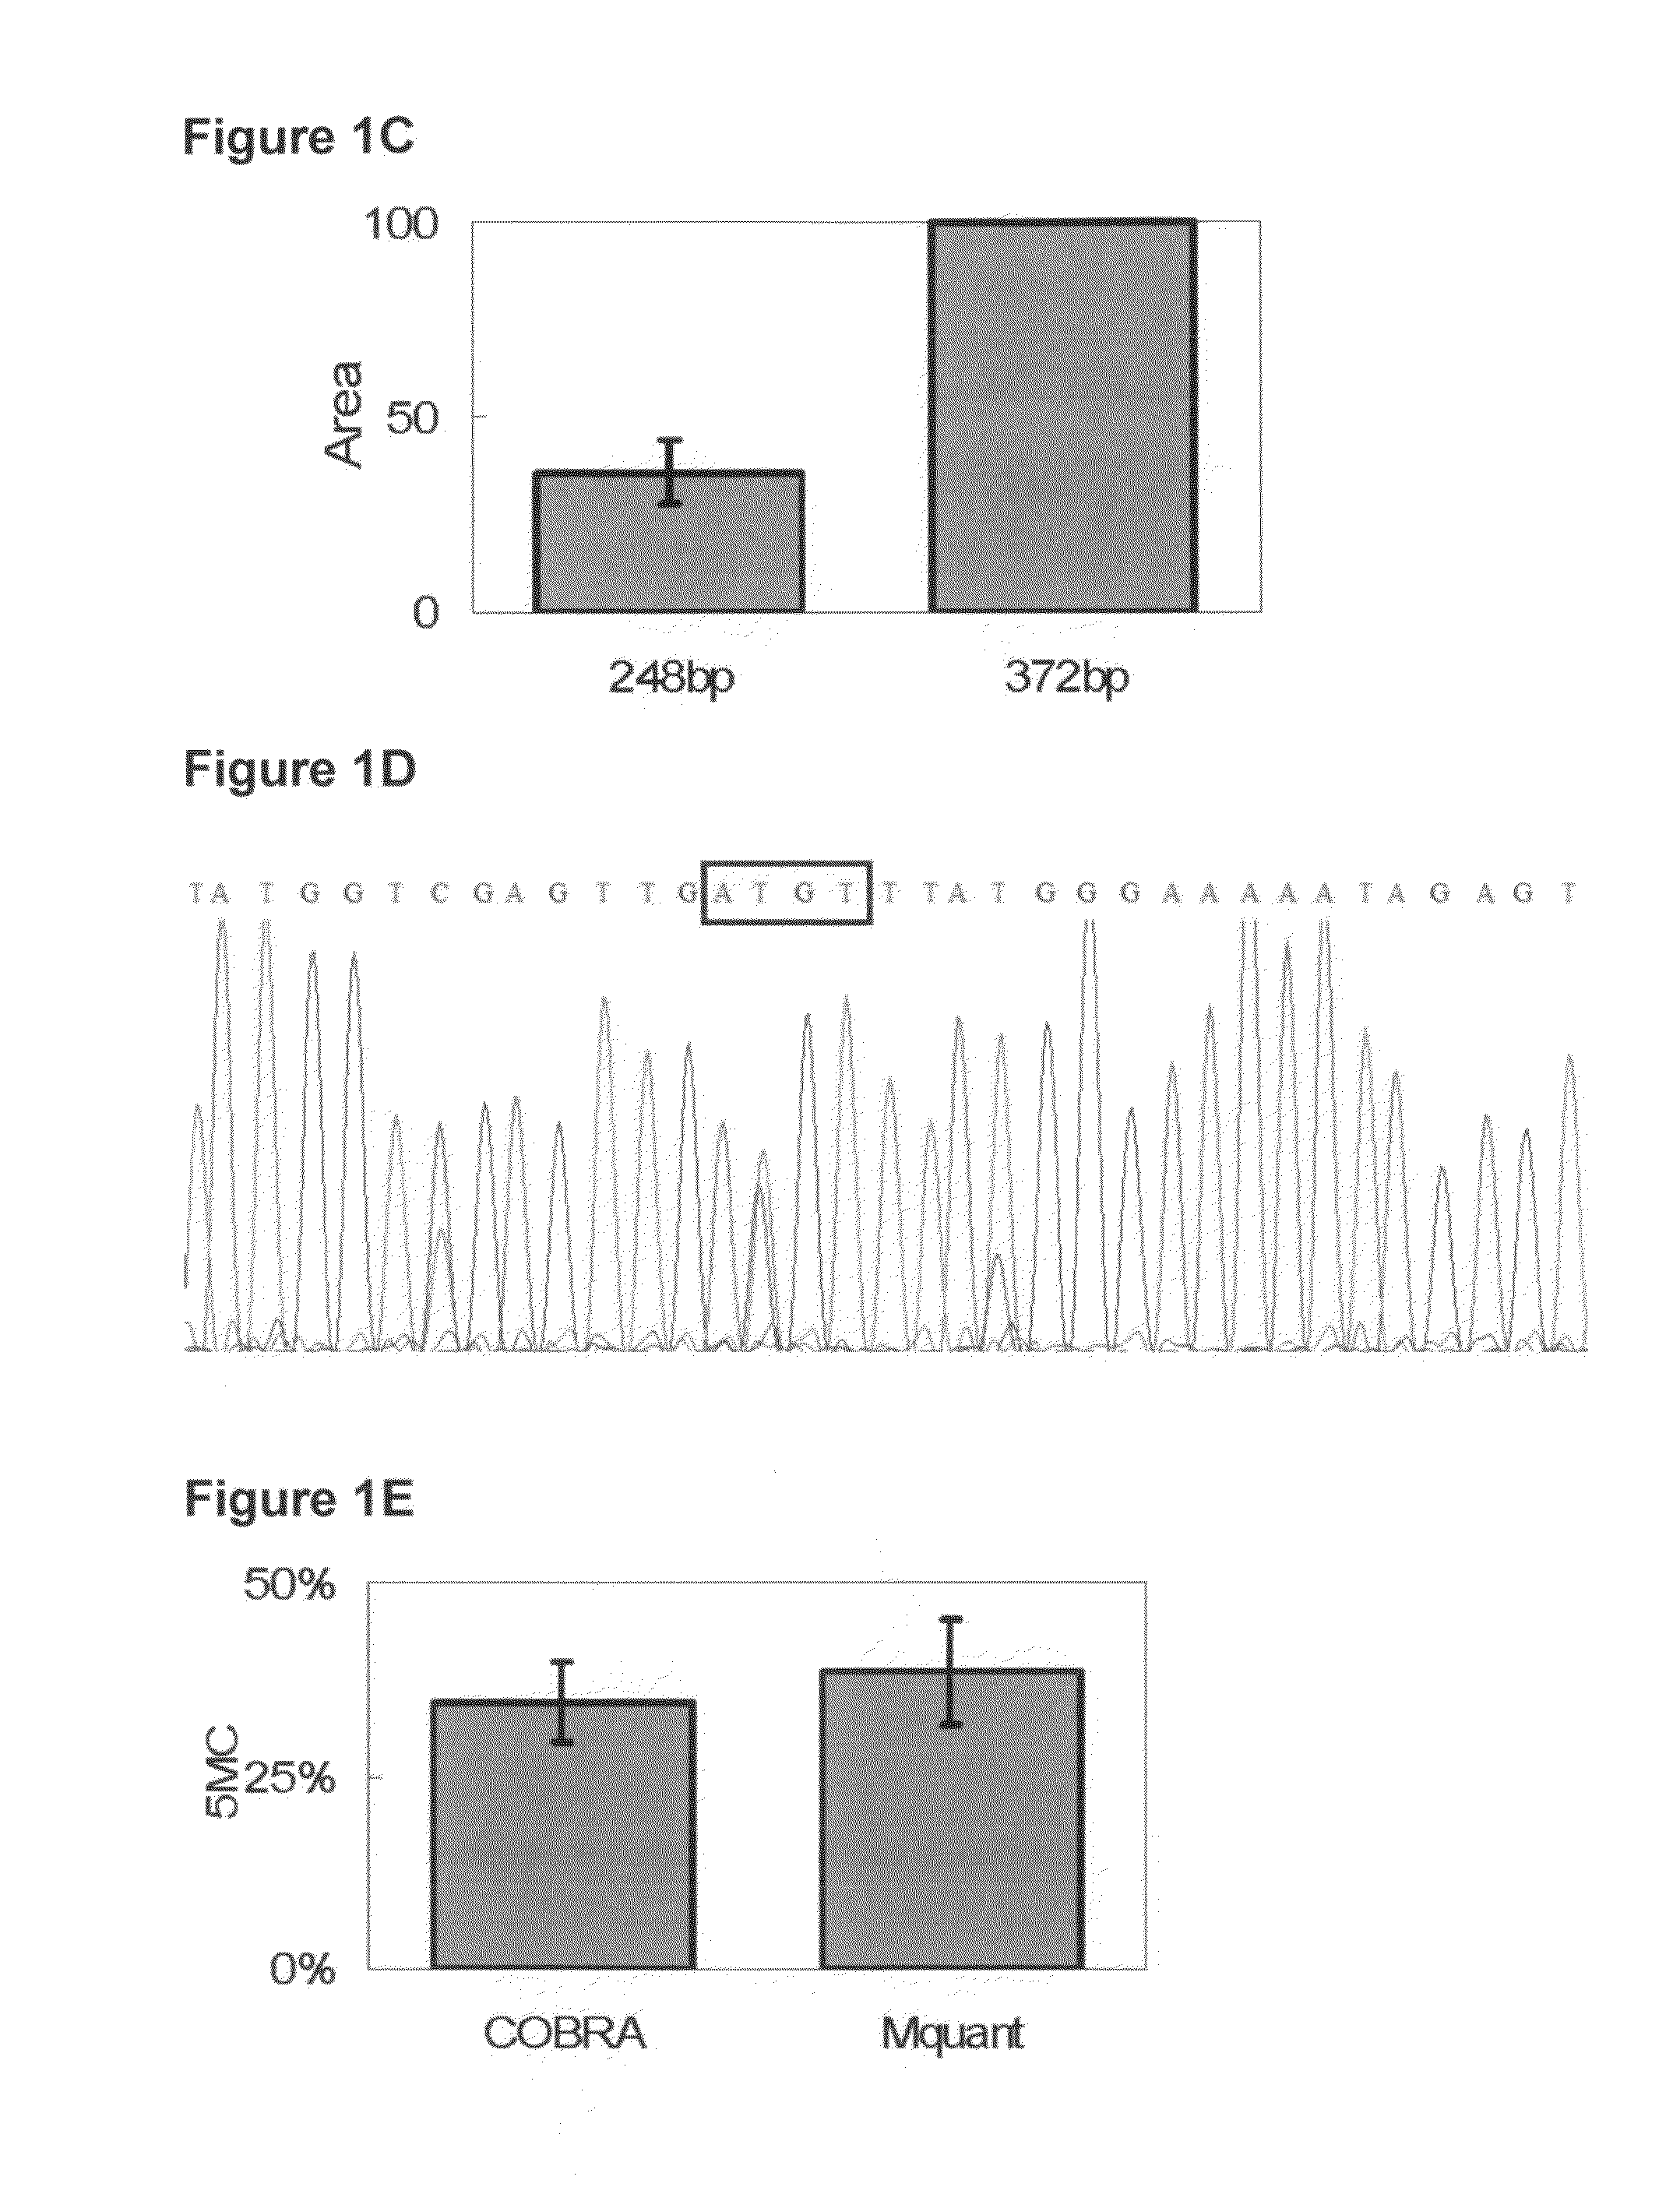
[0079]FIG. 1 shows a COBRA gel for measuring methylation of an HpyCH4IV site (ACGT) and the corresponding site in the sequencing electropherogram. In this and other COBRA gels, the amounts of digest loaded were in a moderate range so that the bands were at a gray level (in an approximately linear range) and still gave a substantial signal. FIG. 2A is a regression plot of COBRA values versus electropherogram values at the ACGT site, and shows a high correlation (0.95) between values measured by the two methods. FIG. 2B is a Bland-Altman plot for this same data. The mean (SD) difference between COBRA and Mquant values for the HpyCH4IV site was +0.72% (7.6%), indicating little evidence for bias (P=0.68) between methods. The outside horizontal lines of FIG. 2B show the Bland-Altman 95% LoA's, which are (−14.4%, +15.9%) for the ACGT site. The mean values of percent methylation for COBRA and Mquant were 31.6% and 32.4% respectively. Overall, these results show that the two methods tend to...

example 2

[0080]FIGS. 3 through 4B show analogous results for the Taqalphal site (TCGA). The correlation between methylation levels measured by the two methods was somewhat lower (0.91). The mean (SD) difference between values measured by COBRA versus Mquant was −8.9% (10.3%), indicating statistically significant evidence (P<0.0001) of a bias toward lower values as measured by Mquant compared to COBRA. The 95% LoA's were (−29.5%, +11.7%) for the TCGA site. The mean values of percent methylation for COBRA and Mquant were 61% and 52% respectively. Although the bias was statistically significant at the Taqalphal site, it was nevertheless under 10% methylation.

example 3

[0081]FIGS. 5 through 6B show analogous results for the Acil sites (GCGG). The correlation between methylation levels measured by the two methods was high (0.98). The mean (SD) difference between values measured by COBRA versus Mquant was 1.6% (8.1%), indicating little evidence for bias (P=0.48) between methods. The 95% LoA's were (−14.6%, +17.8%) for the GCGG site. The mean values of percent methylation for COBRA and Mquant were 61% and 63% respectively. Overall, these results show that the two methods tend to agree well at the Acil site.

[0082]Inventor made estimates of C to T conversion levels and general noise levels in the electropherograms. First, Inventor measured the C level under Ts from nonCpG Cs. These levels were small and indicated a conversion rate of >93% to 97%. Next, Inventor measured the levels of other bases (G and A) under Ts from nonCpG Cs. Levels of G and A were similar to those of C indicating that a substantial amount of C level may come from sequencing noise ...


PUM

PropertyMeasurementUnit
areaaaaaaaaaaa
T signal-to-noise ratioaaaaaaaaaa
fluorescent dye terminator sequencingaaaaaaaaaa

Abstract

A method for quantifying cytosine methylation at a particular target CpG site in DNA of a cell or organism, by performing bisulfite genomic sequencing, wherein a DNA sample extracted from a cell or organism is treated with sodium bisulfite to convert cytosine to uracil and a selected fragment of this treated DNA is amplified, performing a sequence analysis of the amplificate from an electropherogram wherein the area under a peak is measured in a plurality of peaks at either side of the target CpG site to determine the mean T area (T bar) surrounding the site, subtracting the area of the T at the target CpG site from the mean T area wherein the difference is termed delta T, and calculating the proportional level of methylation as a quotient of delta T / T bar, or as a percent value, is presented.

Description

[0001]This application is related to U.S. provisional patent application Ser. No. 61 / 126,443, filed May 5, 2008, from which priority is claimed under 35 U.S.C. §119(e)(1) and which is incorporated herein by reference in its entirety.[0002]This invention was made with government support under P01AG20641 awarded by National Institute on Aging / National Institutes of Health and R01AA016676 awarded by National Institute on Alcohol Abuse and Alcoholism / National Institutes of Health. The government has certain rights in the invention. Additional support was provided by Arkansas Biosciences Institute (Arkansas Tobacco Settlement Fund).BACKGROUND OF THE INVENTION[0003]1. Field of the Invention[0004]The present invention generally concerns a method for quantifying a polymorphism or site-specific DNA methylation in a single cell, a virus, a multicellular organism, or a population of viruses, cells or organisms.[0005]Moreover, the present invention more specifically concerns a process to quanti...

Claims


Application Information

Patent Timeline
Patent Type & Authority Applications(United States)
IPC IPC(8): G06F19/10
CPCC12Q1/6869C12Q2523/125
Inventor COONEY, CRAIG A.
Owner COONEY CRAIG A
Why Eureka
Try Eureka