Estimation of Production Sweep Efficiency Utilizing Geophysical Data

Active Publication Date: 2013-06-13
EXXONMOBIL UPSTREAM RES CO
View PDF7 Cites 30 Cited by
  • Summary
  • Abstract
  • Description
  • Claims
  • Application Information

AI Technical Summary

Benefits of technology

[0007]In one embodiment, the invention is computer implemented method for estimating fluid heterogeneity in a subsurface region from compressional wave attenuation or velocity dispersion, comprising: (a) measuring compressional wave attenuation or velocity, or extracting it from geophysical data, for at least one frequency; (b) selecting a frequency-dependent, mathematical rock physics model for attenuation or velocity, said model pertaining to or containing one or more model parameters that pertain to heterogeneous features of fluid distribution in the subsurface region; (c) using the rock

Problems solved by technology

2008), but none of these studies present any strategy to interpret the g

Method used


Image

  • Estimation of Production Sweep Efficiency Utilizing Geophysical Data
  • Estimation of Production Sweep Efficiency Utilizing Geophysical Data
  • Estimation of Production Sweep Efficiency Utilizing Geophysical Data

Examples


example 1

Where is the Peak Frequency of Attenuation

[0069]In this example, P-wave velocity dispersion and attenuation are modeled assuming a periodic distribution of light oil and water with a porosity 22%. The Biot coefficient of the rock is 0.824 (see definition below). Two different cases are examined. In FIGS. 3A-3C and 4A-4C, the characteristic length scale of the spatial distribution of fluid is fixed at 40 cm, while rock permeability is altered from 1 Darcy to 10 milli-Darcy. In FIGS. 5A-5C and 6A-6C, the characteristic length scale of the fluid distribution is altered from 4 m to 4 cm, while rock permeability is fixed at 1 Darcy. The attenuation curves (e.g., 430 in FIGS. 4A-4C) are plotted in logarithmic inverse Q to demonstrate the frequency dependence of attenuation. Other representations of Q with respect to log frequency, such as Q or inverse Q do not reveal the exact frequency dependence of the attenuation. Similarly, the velocity dispersion curves (e.g. 330 in FIGS. 3A-3C) are ...

example 2

What is the Magnitude of Attenuation at the Peak Frequency

[0077]In this example the magnitude of attenuation is analyzed as a function of rock frame stiffness and fluid bulk moduli contrast. Both factors significantly impact the magnitude of attenuation across the entire frequency bandwidth. Specifically, the magnitude of attenuation at the peak frequency will be examined. This represents the maximum attenuation that can arise for a specific combination (and concentration) of pore fluids within a rock of certain elastic stiffness. Here the rock frame stiffness is parameterized in terms of the Biot coefficient αR, which is a measure of bulk macroscopic compressibility of a volume of dry rock relative to the compressibility of its constituent materials. The Biot coefficient is defined as

αR=1-KdKg,

where Kd is the bulk modulus of the dry rock and Kg is the bulk modulus of the grain material. When αR→0.5, the rock is stiff and the acoustic response (attenuation, velocity) of a partially ...

example 3

The Influence of Spatial Distribution on Frequency Dependent Attenuation

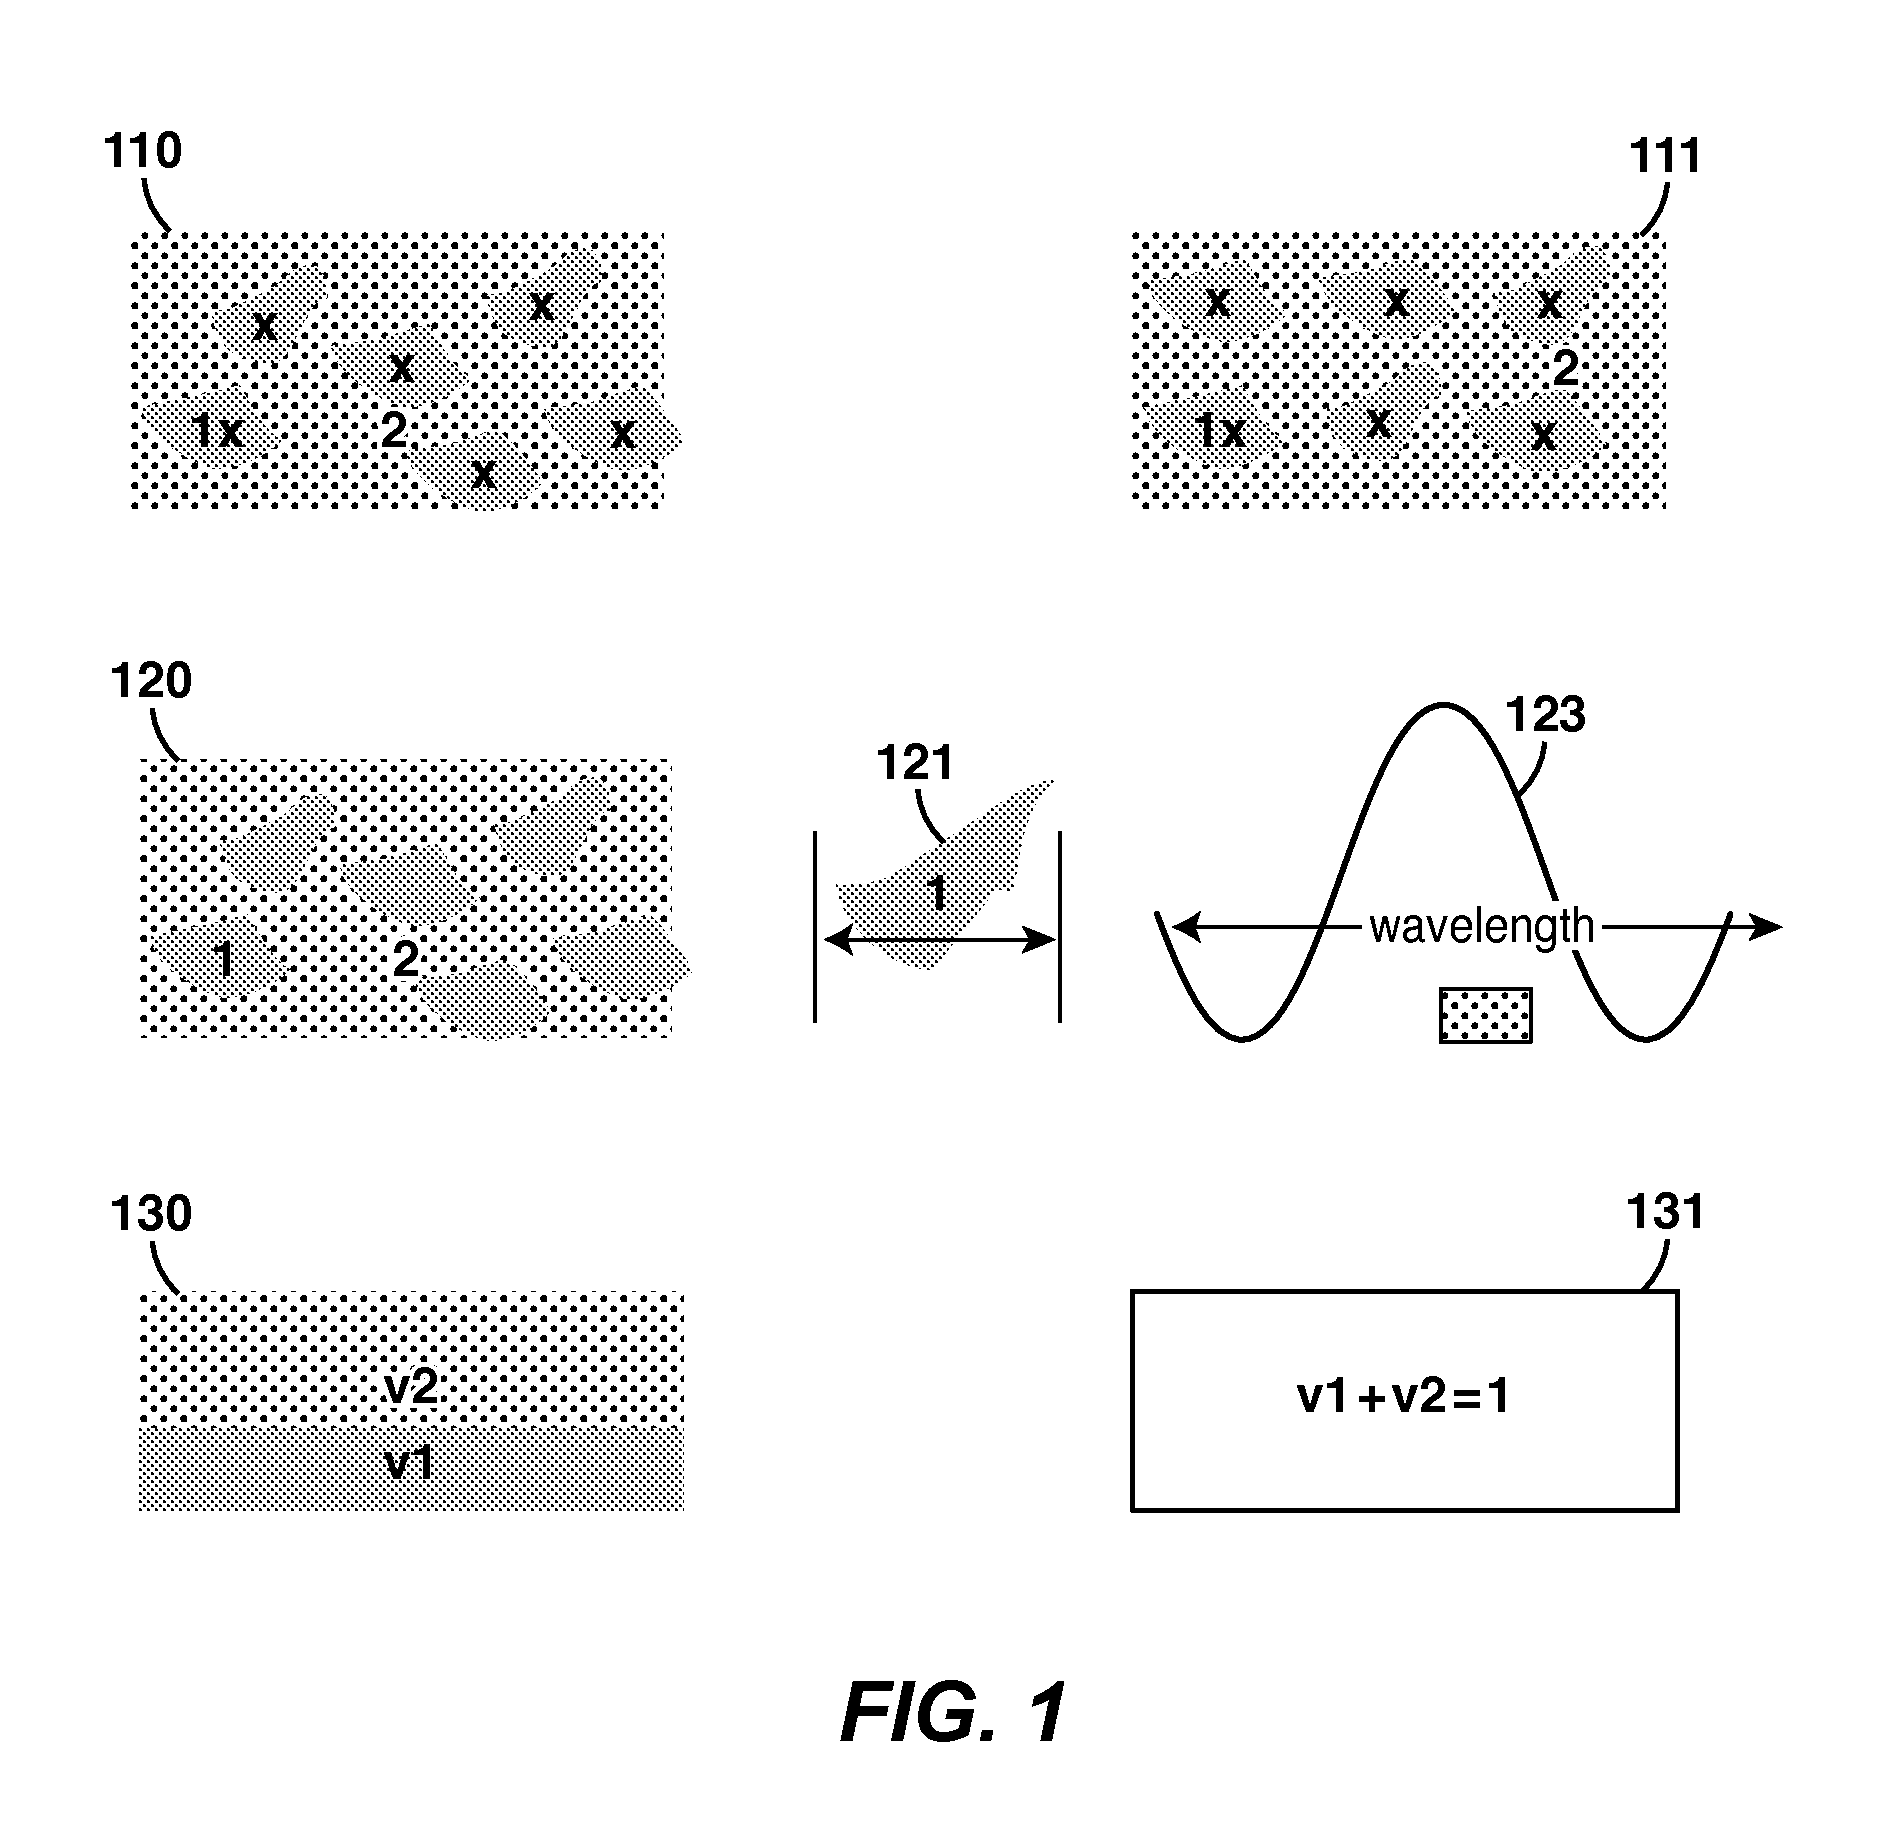
[0080]FIGS. 10A-B demonstrate the effect of different spatial distributions on the frequency dependent characteristics of attenuation (10A) and velocity dispersion (10B). While only random and periodic layering of fluid heterogeneities were modeled, the effect of having different spatial distributions is well documented in the literature; see for example Mueller et al. 2008. The impact is that attenuation will increase or decrease more quickly for some fluid distribution patterns than others.

[0081]In FIGS. 10 A-B, attenuation and velocity dispersion is estimated using the Mueller and Gurevich (2004) rock physics model by assuming two different spatial distributions of fluids. Here 1050 and 1051 refer to attenuation and velocity dispersion estimated assuming a random distribution of heterogeneous layers. Here 1060 and 1061 refer to attenuation and velocity dispersion estimated using a periodic distribution of het...


PUM


Abstract

Method for estimating fluid heterogeneity in a subsurface region from seismic wave attenuation or velocity dispersion that is either measured or extracted from geophysical data (210). A rock physics model in the form of a mathematical relationship is selected that relates attenuation or velocity to frequency and to physical properties that are related to fluid heterogeneity (220). The model, or asymptotes (230) representing the model's behavior at frequency extremes, is inverted (240) and that relationship is used to obtain (250) one or more of the physical properties related to fluid heterogeneity, such as characteristic length scale for fluid saturation heterogeneities (270) and relative volume fractions of the fluids saturating the pore space (280).

Description

CROSS-REFERENCE TO RELATED APPLICATION[0001]This application claims the benefit of U.S. Provisional Patent Application 61 / 569,576 filed Dec. 12, 2011, entitled ESTIMATION OF PRODUCTION SWEEP EFFICIENCY UTILIZING GEOPHYSICAL DATA, the entirety of which is incorporated by reference herein.FIELD OF THE INVENTION[0002]This invention relates generally to the field of oil and gas production and, more particularly, to estimating production-induced changes in hydrocarbon fluid saturation and the spatial distribution of the residual hydrocarbons utilizing geophysical information. Specifically, the invention is a method for characterizing saturation heterogeneities in reservoirs (i.e., unproduced pockets of oil or gas) by quantifying and interpreting changes in P-wave velocity and attenuation utilizing rock physics relationships.BACKGROUND OF THE INVENTION[0003]The objective of the present invention is to use attenuation and velocity dispersion data to determine parameters that describe subsu...

Claims


Application Information

Patent Timeline
IPC IPC(8): G01V1/28E21B47/003
CPCG01V1/306G01V2210/624
Inventor TOMS, JULIANNA J.KROHN, CHRISTINE E.LIU, ENRU
Owner EXXONMOBIL UPSTREAM RES CO
Why Eureka
Try Eureka