
Method and system for anomaly detection in data sets

a data set and anomaly detection technology, applied in the field of image data, can solve the problem of difficult to find the satisfaction of anomaly criterion, and achieve the effect of improving optimisation

Active Publication Date: 2013-11-14
UCL BUSINESS PLC
View PDF5 Cites 30 Cited by
  • Summary
  • Abstract
  • Description
  • Claims
  • Application Information

AI Technical Summary

Benefits of technology

The present invention provides a method for identifying abnormal data points in a given set of data using a normalised distance measure. This method requires little optimisation for a given data set and is adaptable to data of any complexity. It is also easy to implement and can be used for identifying abnormal data points in various types of medical imaging, such as MRI. The method uses a threshold-based segmentation operation and a clustering operation to improve accuracy and performance. The normalised difference measure used in the method is a zeta distance score which presents various advantages.

Problems solved by technology

However, where the data is high dimensional (e.g. moving or static images, time series, volume data, etc) and / or the distribution of values is complex (e.g. multimodal) a satisfactory criterion of anomaly is very hard to find.
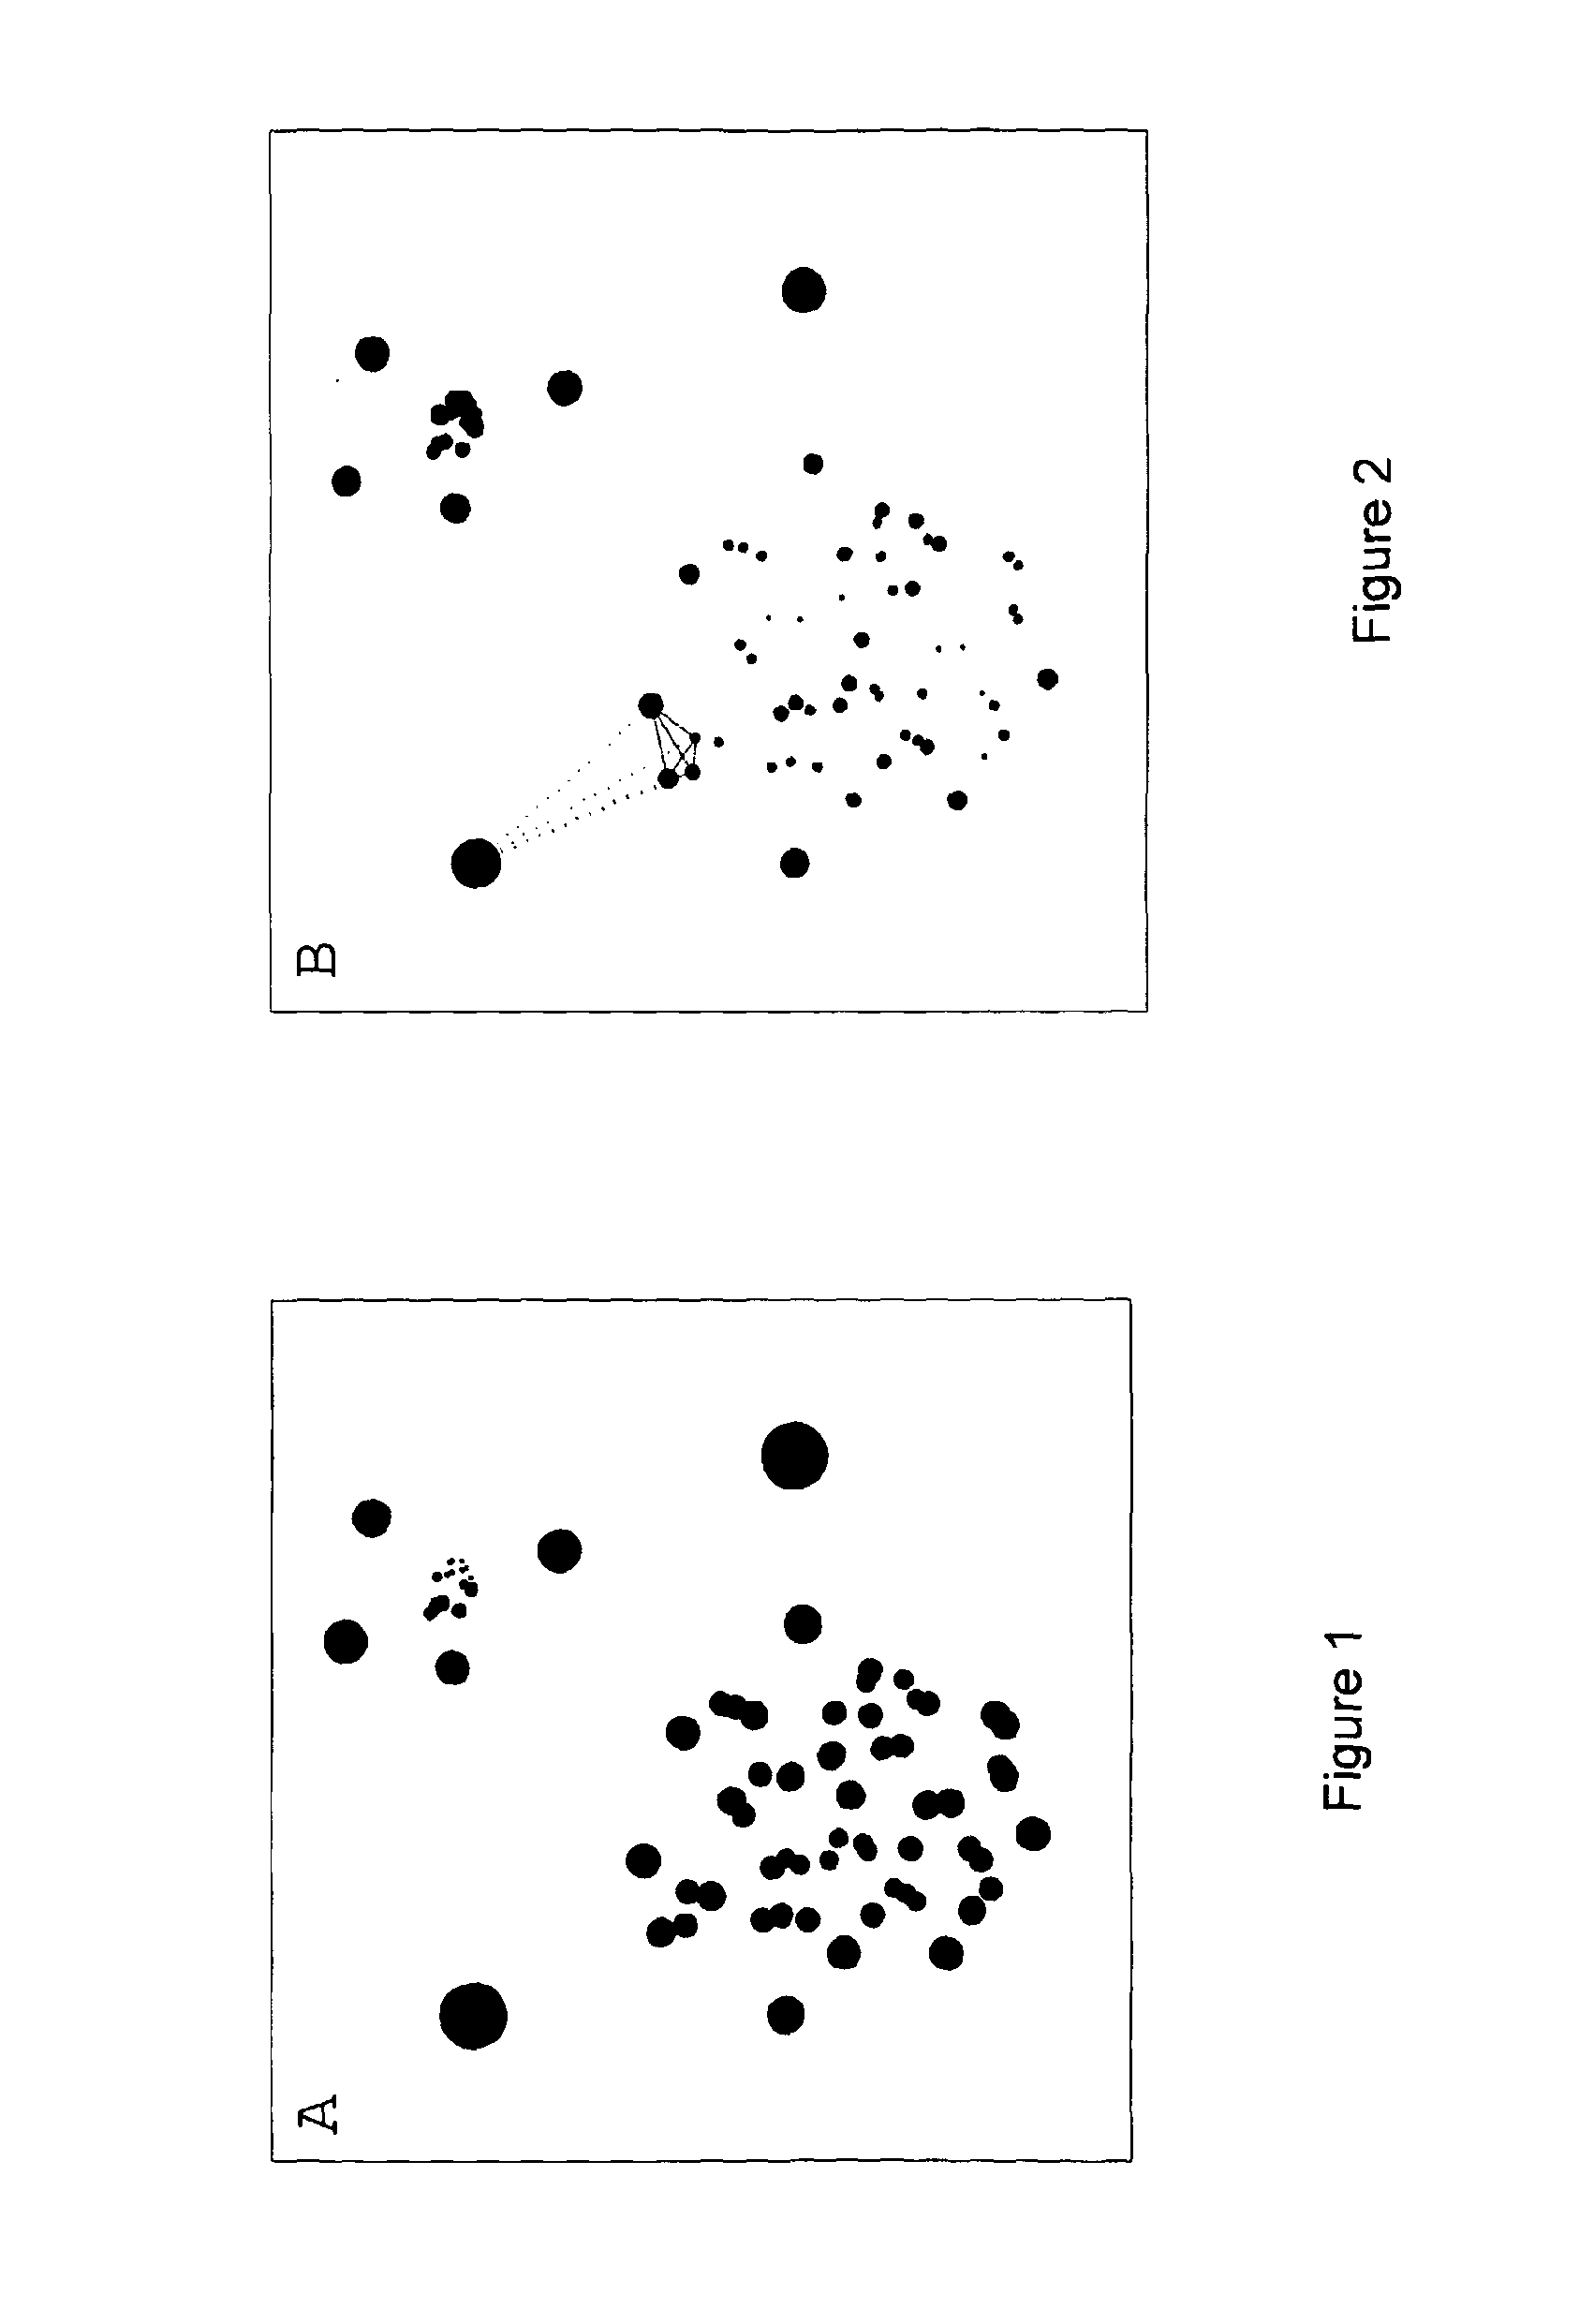
Unfortunately, γ unhelpfully varies with the natural density of the points—dense regions will have low values and sparse regions high ones—making the labelling of anomalies density dependent (Harmeling et al., 2006).

Method used


Image

  • Method and system for anomaly detection in data sets
  • Method and system for anomaly detection in data sets
  • Method and system for anomaly detection in data sets

Examples


first embodiment

Anomaly Segmentation in Image Data

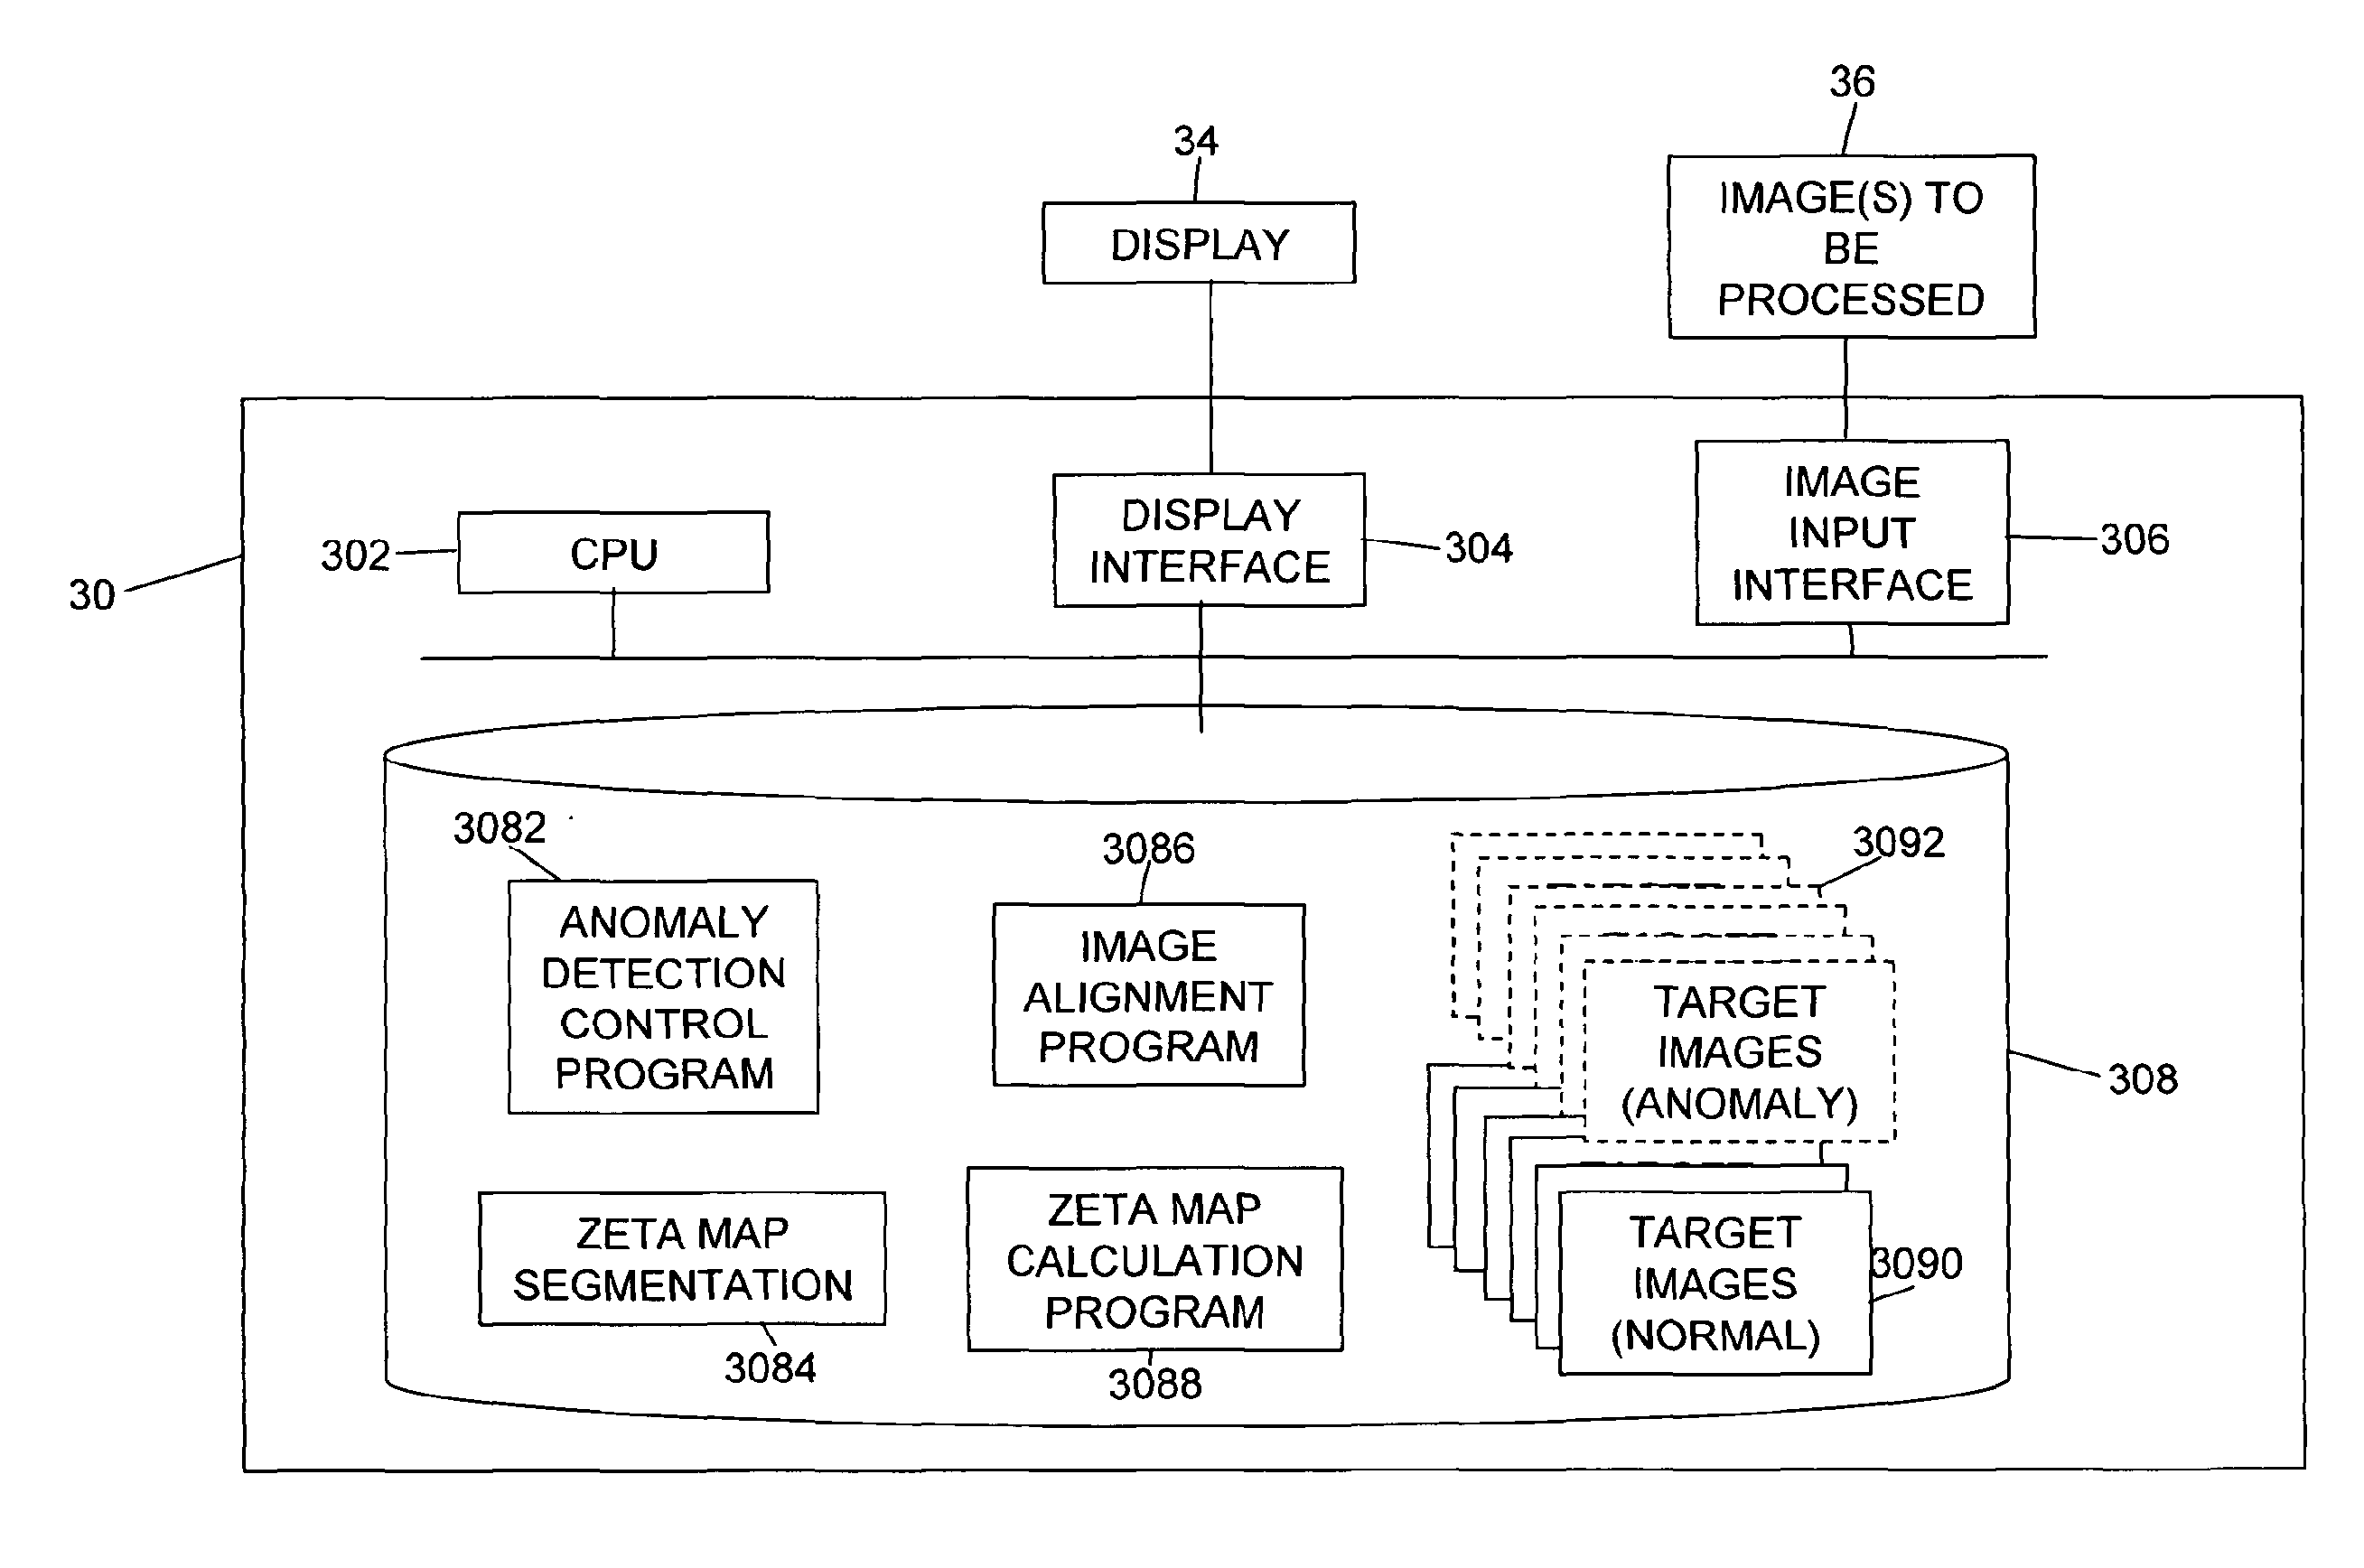
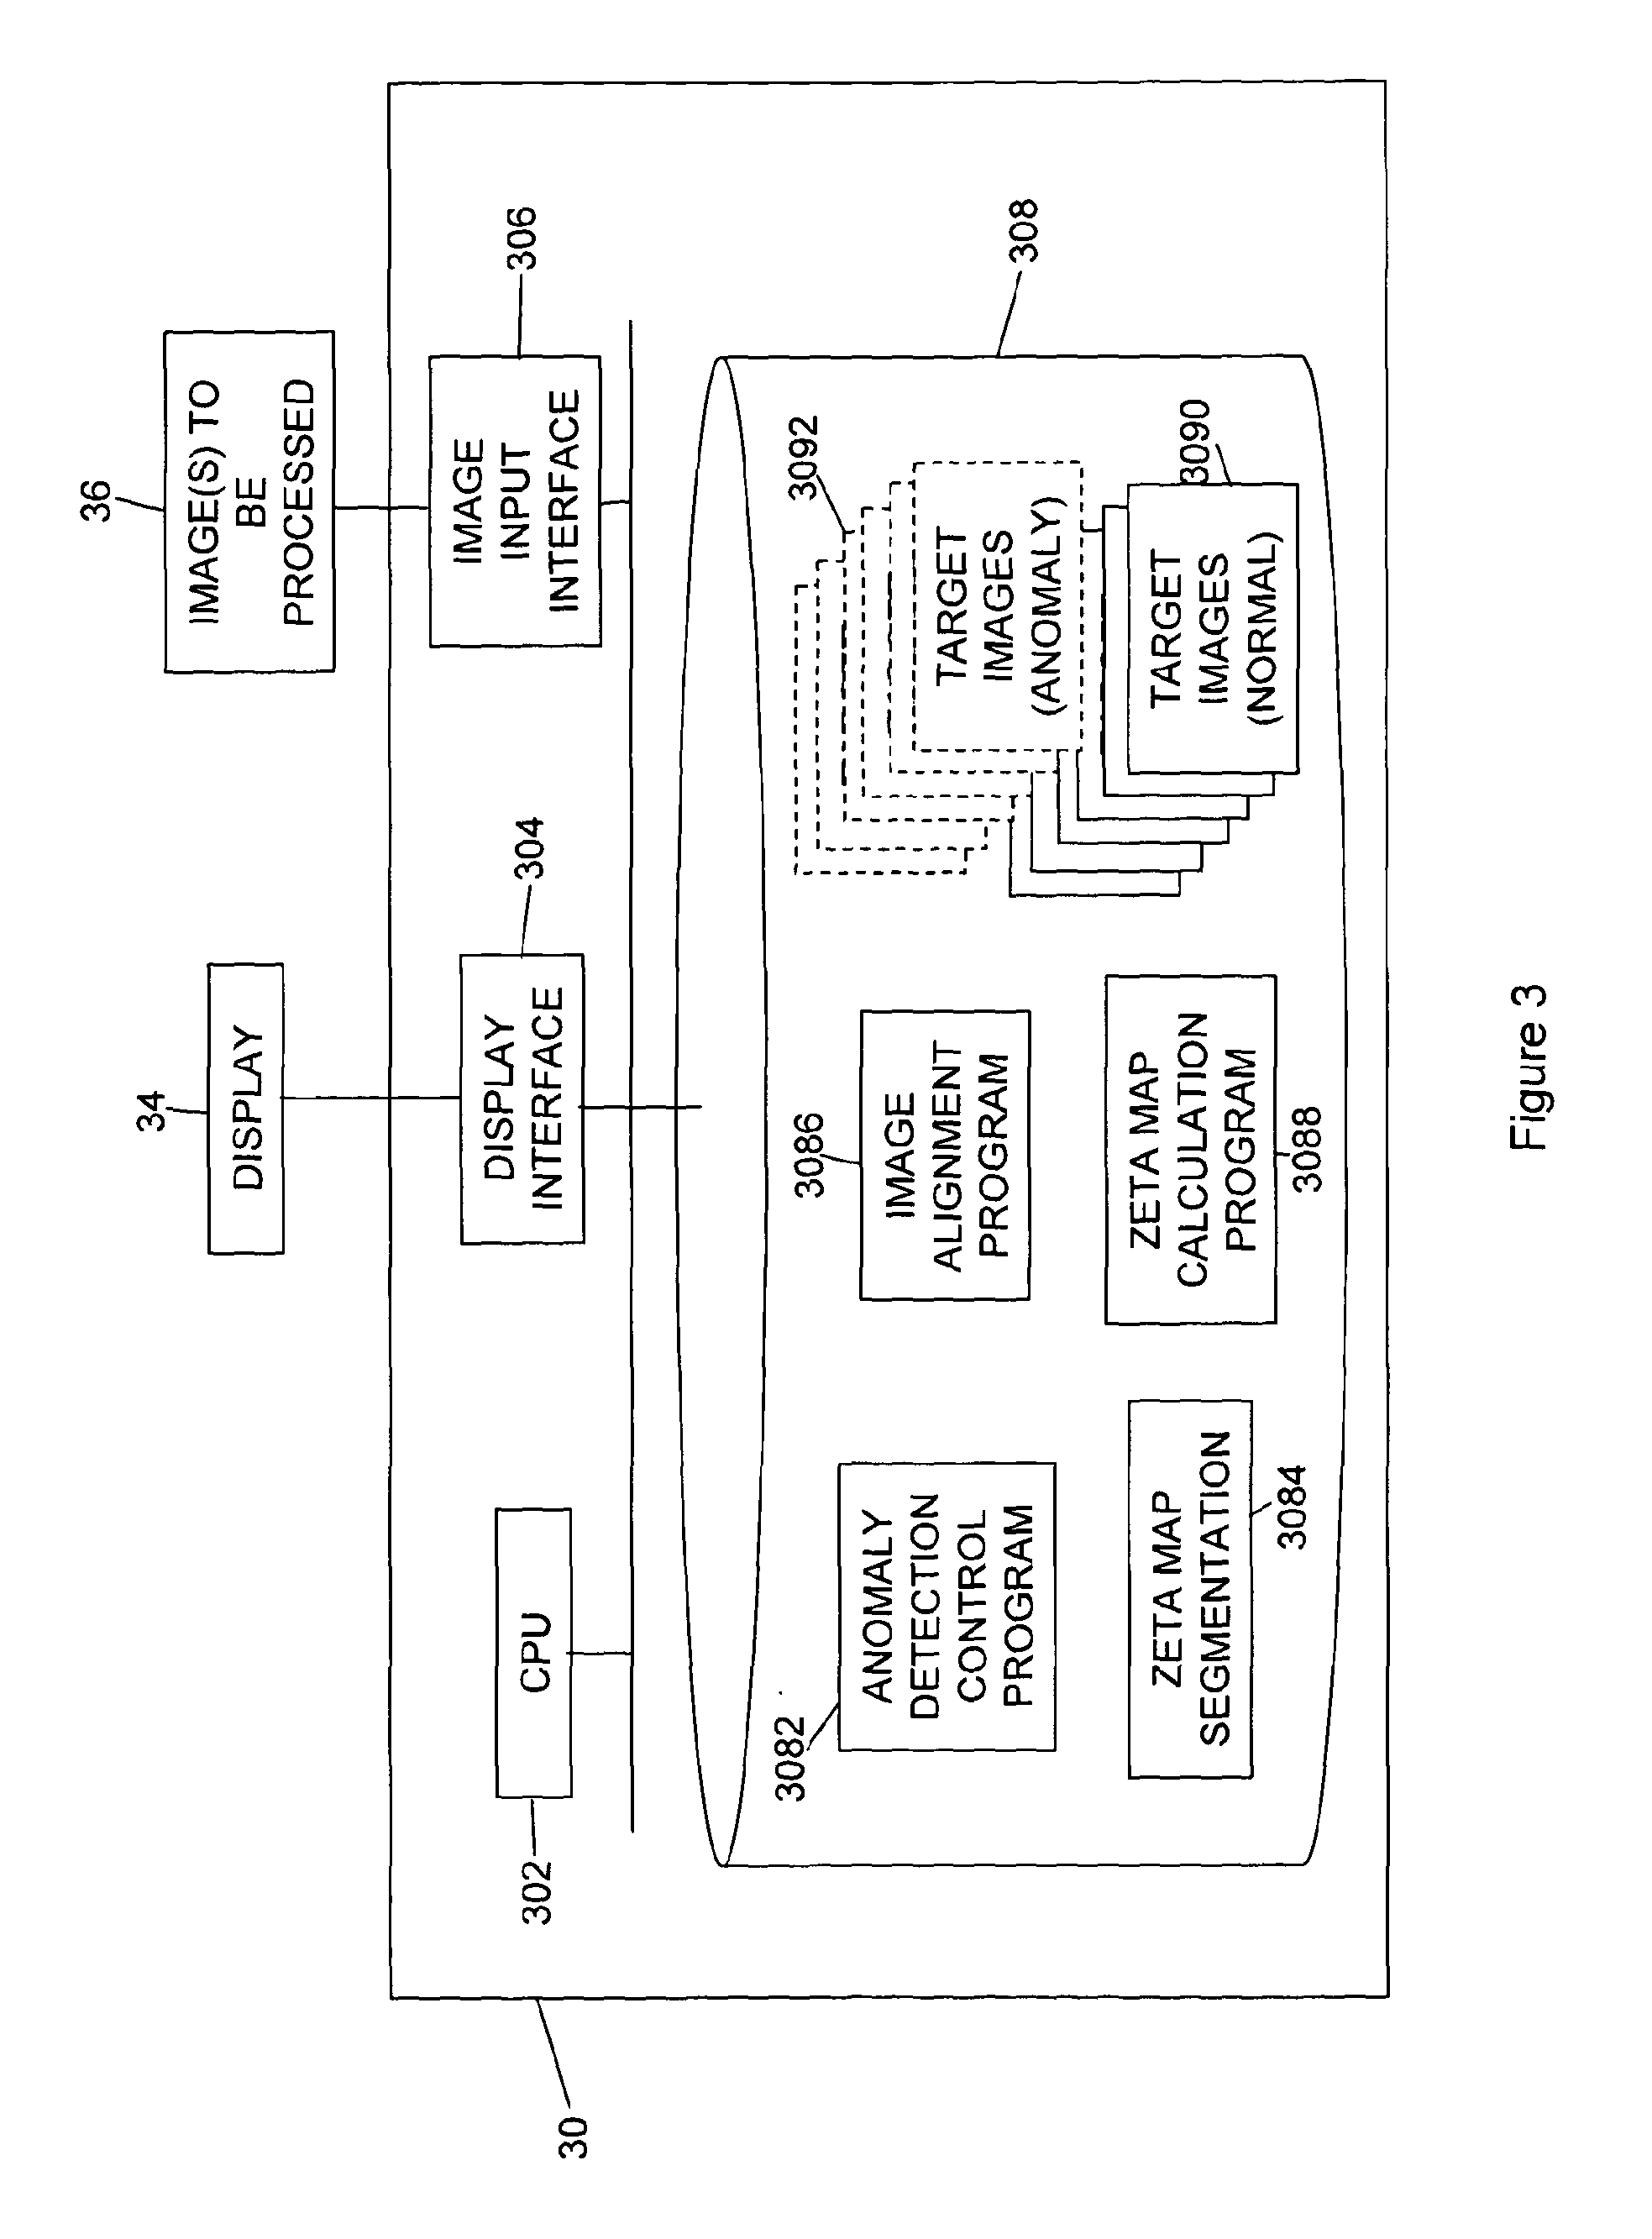
[0069]A first, general, embodiment of the invention applicable to segmentation of anomalies in image data is shown in FIGS. 3 to 7, and described next.

[0070]FIG. 3 is a block diagram of an apparatus 30 for performing automated anomaly detection in image data according to a first embodiment. The apparatus 30 may, for example, be a general purpose computer provided with an appropriate input interface 306 so as to be able to accept image data 36, appropriate control software that controls a CPU 302 to process the data to perform anomaly detection, and a display interface 304 arranged to control a display screen 34 so as to be able to display the processed image data on the screen. In order to control the operation of the CPU 302 control software is provided stored on computer readable storage media 308, such as a hard disk drive or the like. The control software takes the form of anomaly detection control program 3082, zeta map segmentation program 308...

second embodiment

Conclusions

[0116]In the first and second embodiments we have described a method for the automated unsupervised anomaly detection of high-dimensional data with an example application in the second embodiment to MRI. Evaluation of its fidelity against manual segmentation in the context of DWI has shown excellent performance across a range of subjects and lesion parameters.

[0117]Within the embodiments a set of “standard” cases is required whose minimal size depends on the nature of the anomaly. For the brain imaging application we have examined (the second embodiment), the variability of the lesion contrast-to-noise ratio is important; here we have shown that excellent results may be obtained with DWI using a modest set of 65 images. Given that DWI is quite markedly prone to high signal artefacts that affect only a small proportion of images, this value should not be an underestimate. In any case, this is not a serious limitation given the ease of collecting normal cases.

[0118]In addit...


PUM


Abstract

A method and apparatus for detecting and segmenting anomalous data in an input data set such as an image is described, which makes use of a normalised distance measure referred to as a zeta distance score. A test data point from an input test data set is compared with its corresponding nearest neighbouring standard data points in standard data sets representing variation in normal or expected data values, and the average distance from the test data point to the standard data points is found. An additional average distance measure representing the average distance between the different nearest neighbouring corresponding standard data points is also found, and a normalised distance measure obtained by finding the difference between the average distance from the test data point to the standard points and the average distance between the nearest neighbouring standard data points themselves. Where the input test data set is an image then a zeta distance score map can be found. By then thresholding the zeta distance scores obtained for the input data set using an appropriate threshold, anomalous data in the data set with a high zeta distance score can be identified, and segmented.

Description

TECHNICAL FIELD[0001]The present invention relates to a method and system for detecting anomalies in a set of data, and particularly image data. In some embodiments of the invention the image data is high-dimensional data such as moving or volumetric image data, and in some embodiments anomaly detection is used to provide for automatic detection and segmentation of pathological lesions in medical imagery of the brain.BACKGROUND TO THE INVENTION[0002]It is often desirable to be able to detect instances within a set of data that may be said to differ from the rest sufficiently to constitute outliers or anomalies. For example, within the medical domain, one might wish to identify alarming changes in physiological parameters such as heart rate in patients undergoing continuous monitoring, or abnormalities in the appearance of the brain on magnetic resonance or computed tomography scans. Examples in other domains include being able to identify anomalous movements in time-varying data suc...

Claims


Application Information

Patent Timeline
IPC IPC(8): G06F17/30G06V10/764
CPCG06F17/3061G06T7/0012G06T2207/20101G06T2207/30004G06F16/30G06V2201/03G06V10/764G06F18/2433
Inventor NACHEV, PARASHKEV
Owner UCL BUSINESS PLC
Learn More