Event detection algorithms

a detection algorithm and event technology, applied in the field of event detection algorithms, can solve the problems of significant resource burden, inability or inability to cooperate, involuntary or uncontrolled urination, etc., and achieve the effect of reducing the influence of more distant reference property vectors

Active Publication Date: 2014-08-28
FRED BERGMAN HEALTHCARE PTY LTD
View PDF4 Cites 57 Cited by
  • Summary
  • Abstract
  • Description
  • Claims
  • Application Information

AI Technical Summary

Benefits of technology

[0026]In a preferred embodiment, the first function may also be used to perform the steps of calculating a distance between corresponding properties in the Unknown Property Vector and each of a plurality of Reference Property Vectors; and identifying Reference Property Vectors as being in the first subset where the distance calculated is within a limit. Reference Property Vectors falling outside the limit may be excluded from consideration. Alternatively, a weighting may be applied to the vector

Problems solved by technology

Urinary incontinence refers to loss of bladder control resulting in involuntary or uncontrolled urination.
Often, the individual is unwilling or unable to cooperate and/or alert staff of the fact that an incontinence event has occurred.
As can be appreciated, the need to conduct regular checks of individuals for the occurrence of an incontinence event places a significant burden on the resources of care institutions and also causes interruption to the individual's day to day activities, including their rest and sleep.
However, generally these are unable to distinguish e.g. a urinary incontinence event from a faecal incontinence event.
Furthermore, existing incontinence detection syste

Method used


Image

  • Event detection algorithms
  • Event detection algorithms
  • Event detection algorithms

Examples


example

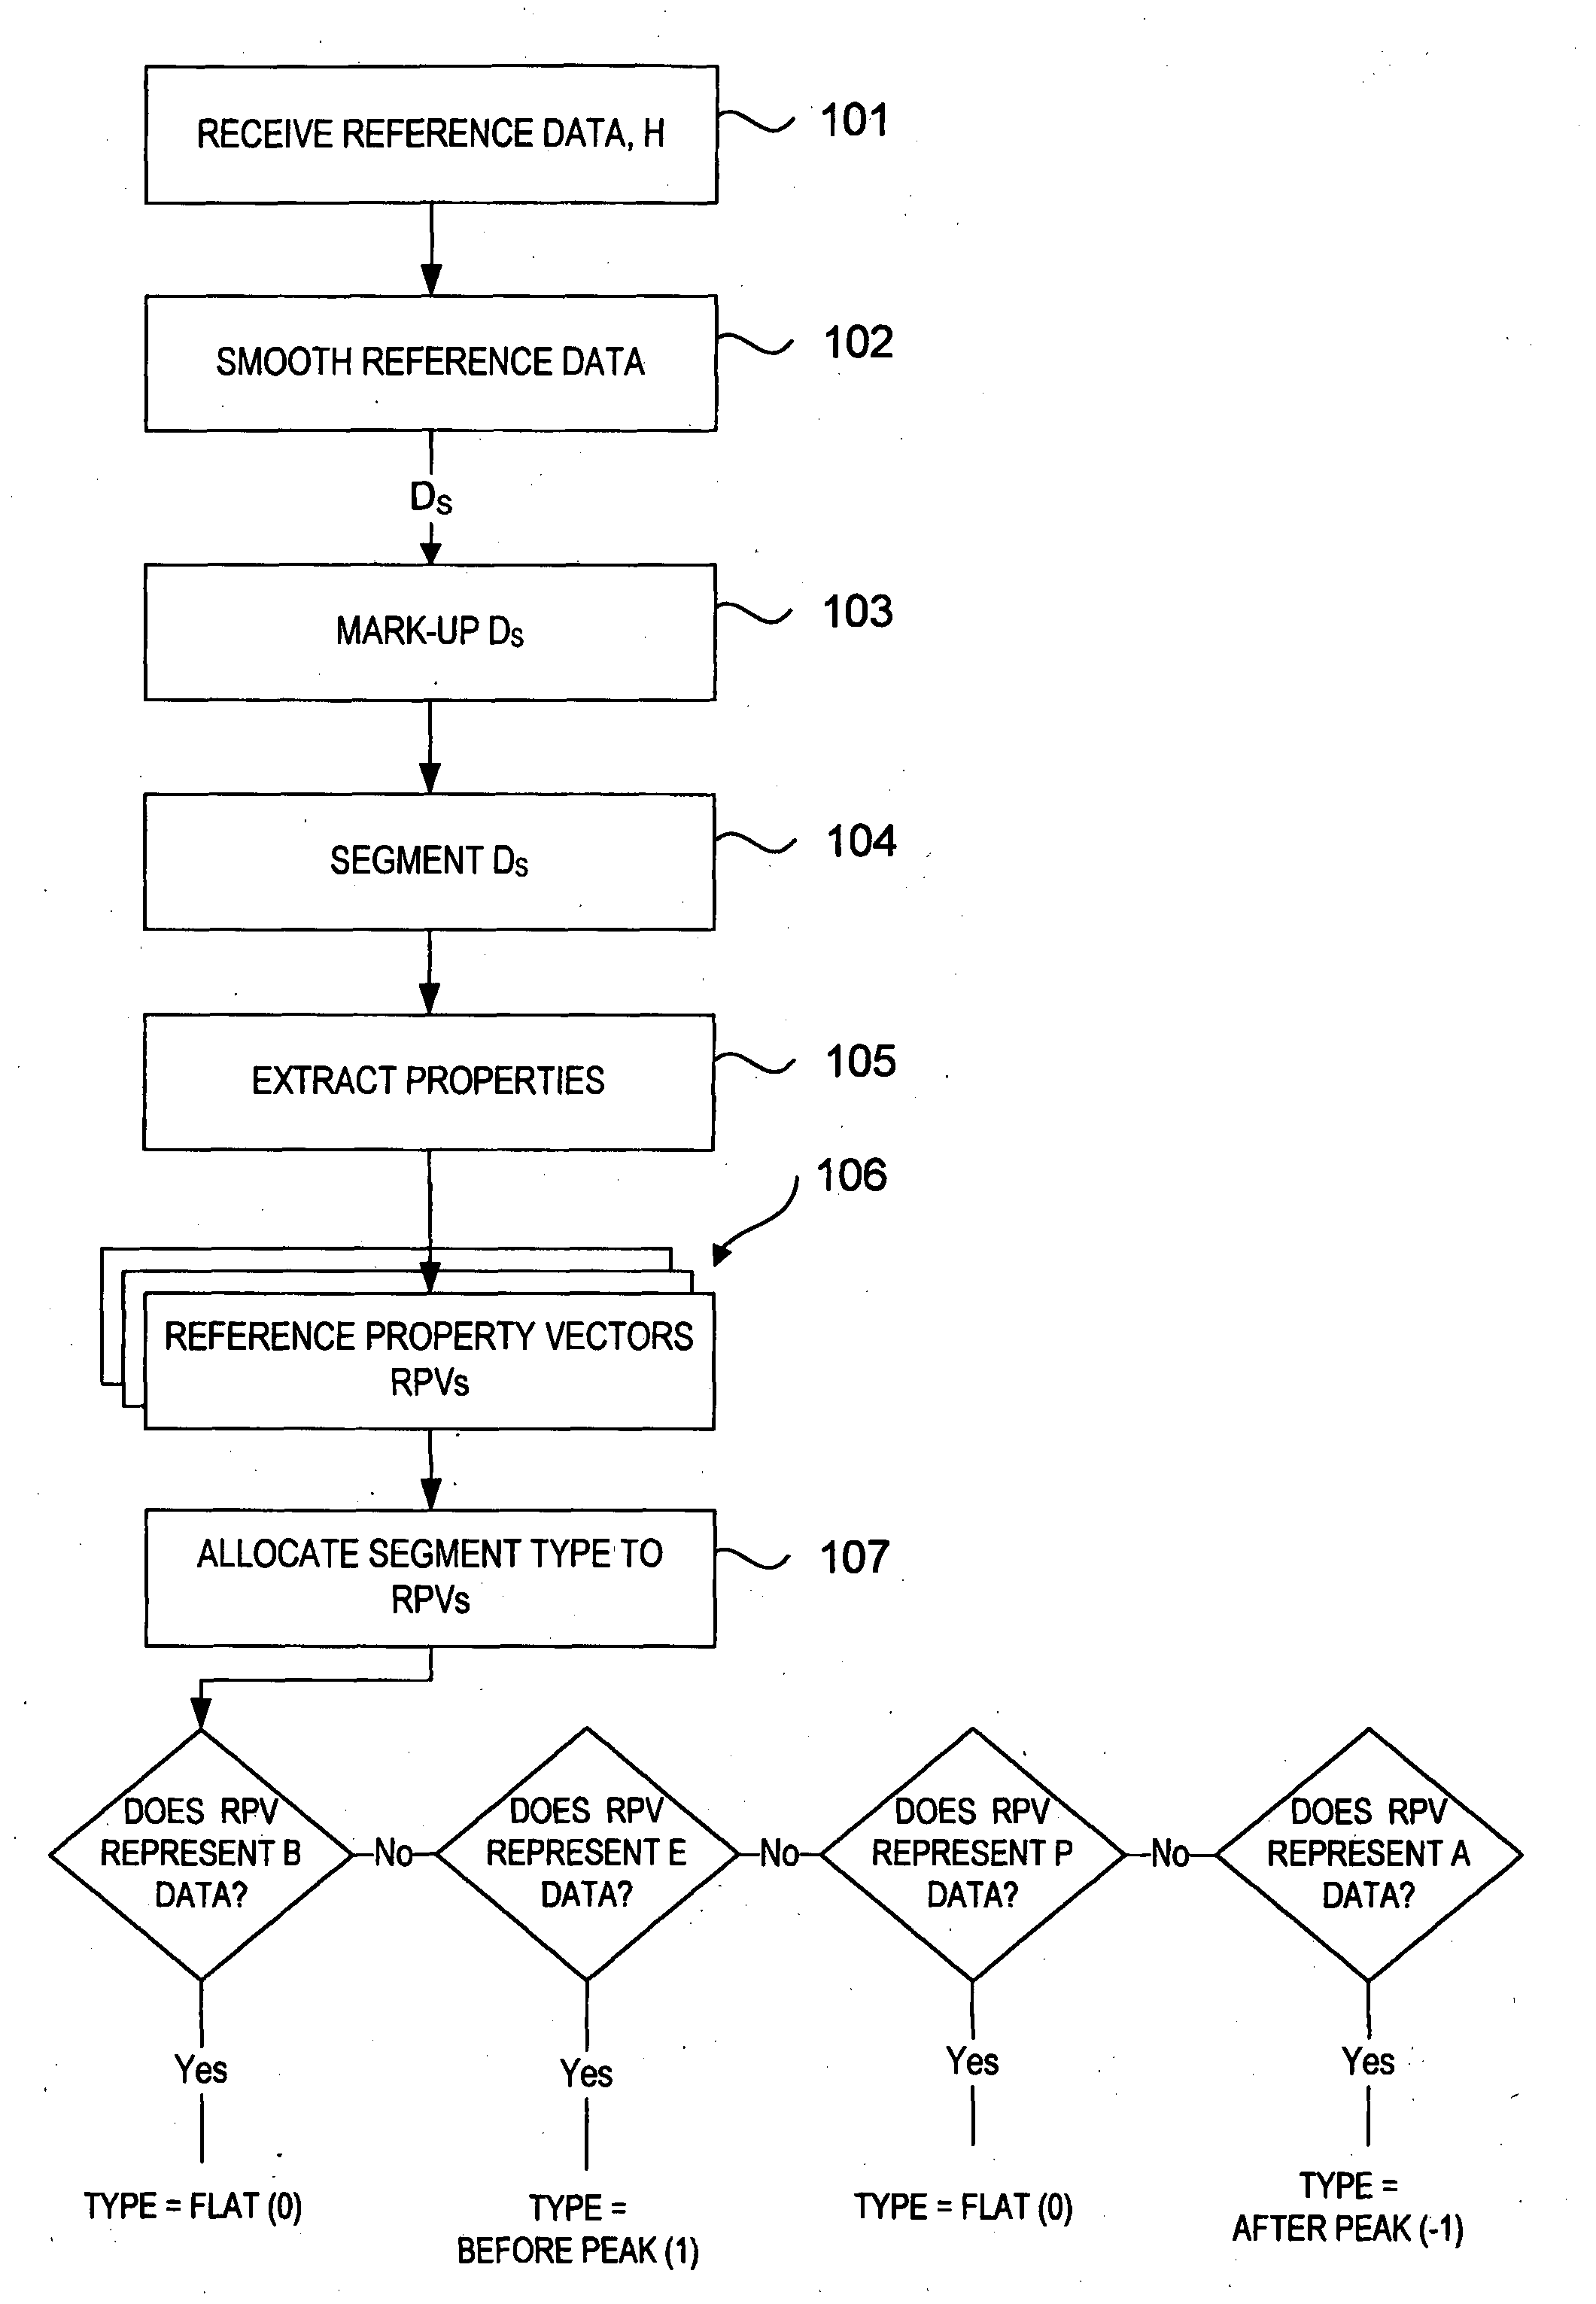
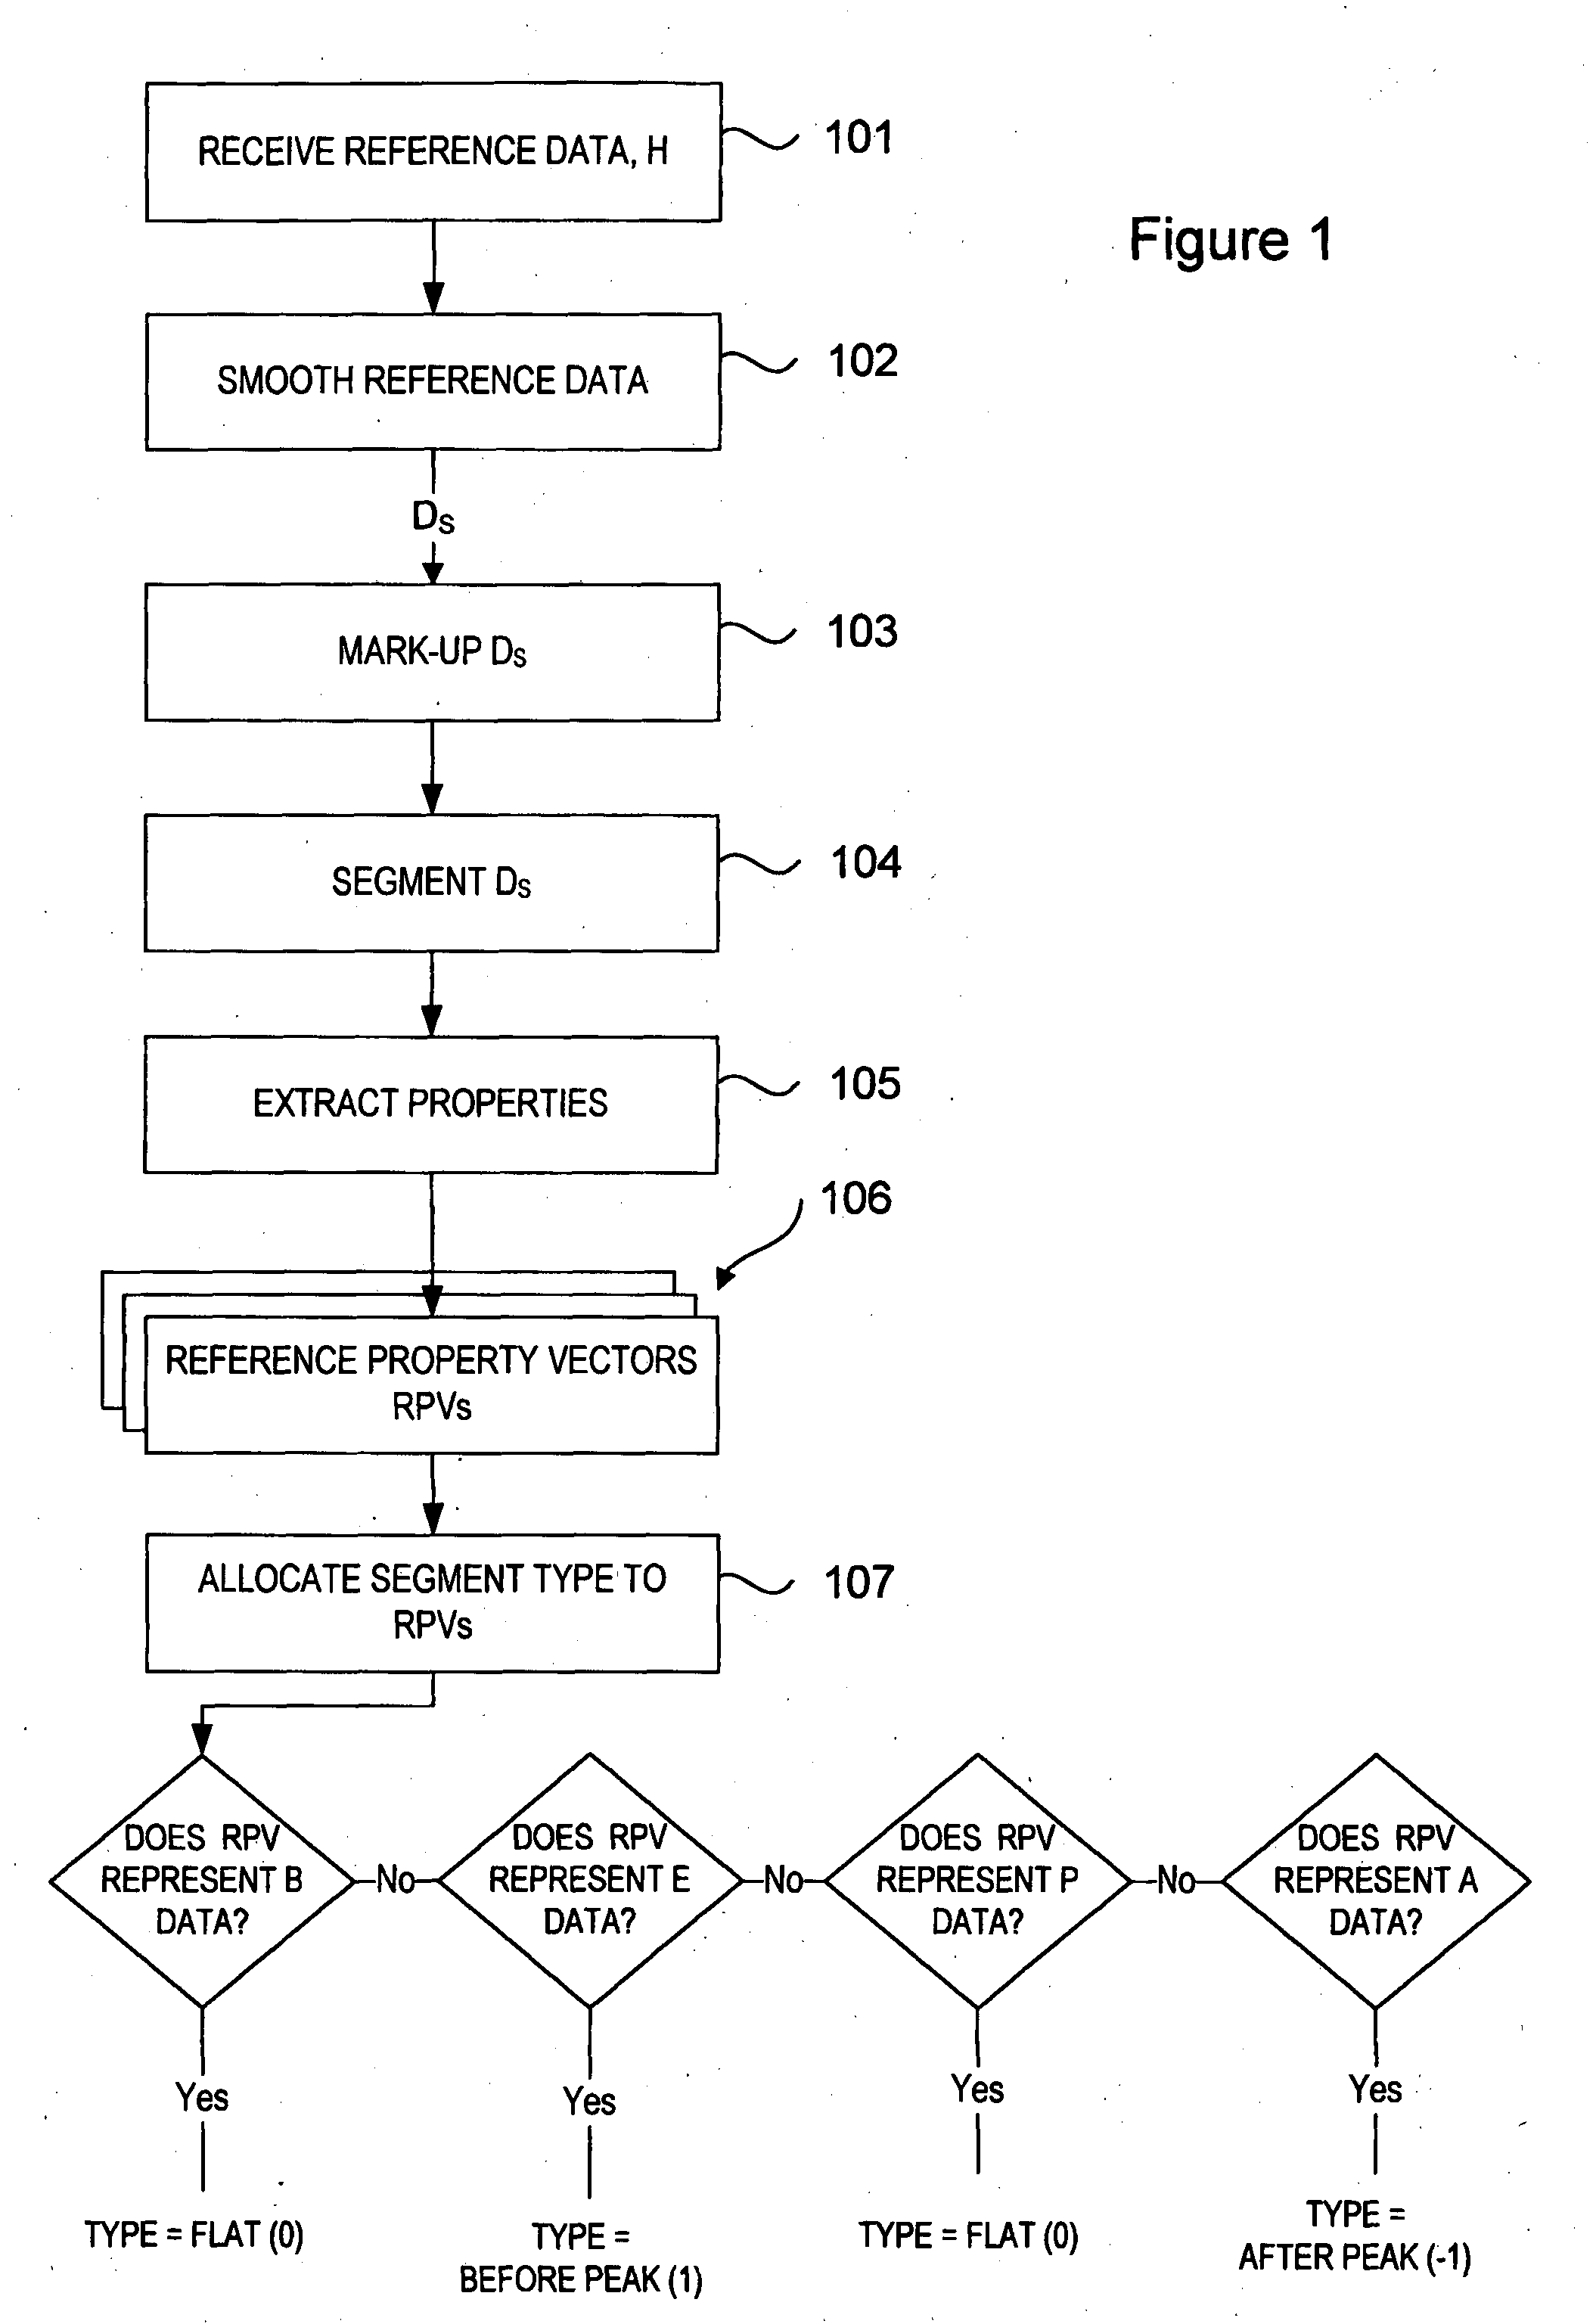
“Property Extractor Function” Using Moving Window

[0097]The following section describes one example of an approach to extracting properties from data which employs a “moving window” approach to process reference data in finite segments. A moving window may be defined as a bounded window applied to data from which various ‘properties’ are extracted. The window may have any closed regular or irregular polygonal shape such as square, triangular, hexagonal, quadrilateral or the like, or it may be e.g. round, oval or elliptical. The window sides may each have the same or different pre-defined dimensions. Alternatively, one or more of the window sides may have a dimension, e.g. a length which varies, e.g. depending on the type or property / properties of previous segment types in a sequence. In one embodiment, the window has only one dimension e.g. it represents a line having width w or height h or a line which is curved or diagonal but which does not form a closed boundary. A window side le...

example a

[0155]Showing application of Before Peak and After Peak Test A.

Assume a stream of segment types:

[0156]0,0,0,0,1,1,1,0,−1,null,1,1,1,1,1,1,null,0,−1,−1,−1,0,null,1,1,−1,−1,−1,0,0

Where null can be attributed a segment type value=0.

Test size l=5

Before Peak threshold α=3

After Peak threshold β=−2

The stream of values T is:

1st2nd3rd4th5th6th7th8th9th10th11th12th13th14th15th16th123321112455431−117th18th19th20th21st22nd23rd24th25th26th27th28th−3−3−3−1110−1−2−3−2−1

[0157]Test A reveals a positive Before Peak Test (signifying start of a new event) at the third value i.e. T=3 (underlined) and a positive After Peak Test (signifying end of peak stage and start of after event) at the 17th value i.e. at T=−3 (underlined). An event peak is represented by the data corresponding to 3>T>−2. Accordingly the event peak is represented by data corresponding to the 15th and 16th values of T having values 1 and −1 respectively (shown with double underline).

Test B.1

[0158]1. Set two thresholds, α% and β%, to be...

example b.1

[0178]Assume a stream of segment-type vectors where the segment types in each vector having the highest likelihood of belonging are as follows, where f represents flat, r represents Before Peak, n represents null and d represents After Peak segment types:

[0179]f 30%, r 50%, r 89%, n 90%, f 95%, r 30%, d 10%, d 30%, r 20%, d 70%, f 20%, d 50%

[0180]Threshold α=80

[0181]Threshold β=50

[0182]Test B.1 reveals a positive Before Peak Test (signifying start of a new event) in data represented by the 3rd segment (where r=89%) in the sequence of segments obtained from the incoming data. Similarly, Test B.1 reveals a positive After Peak Test (signifying end of peak stage and start of after event) at the 10th segment (where d=70%).


PUM


Abstract

A method for analysing incoming data, comprising the steps of processing the incoming data in segments to output a sequence of segment types by extracting one or more properties of an incoming data segment and forming an Unknown Property Vector for each segment of data in the incoming data, and processing the sequence of segment types to identify events in the incoming data. The sequence of segment types is determined, for each segment, by reference to a set of Reference Property Vectors that are relevant to the Unknown Property Vector. This may involve application of first and/or second and/or further functions to identify at least a first subset of Reference Property Vectors that are relevant to the Unknown Property Vector. Alternatively, a logistic regression algorithm, derived using clustering or classification methods for identifying candidate vectors, may be used.

Description

FIELD OF THE INVENTION[0001]This invention relates to methods, systems and computer program products and related aspects for improving event detection using signals obtained from sensors. The invention relates particularly but not exclusively to processing of sensor signals obtained from wetness sensors such as those that may be employed to detect wetness in incontinence pads, diapers, nappies, wound dressings and the like.BACKGROUND TO THE INVENTION[0002]Incontinence is a condition in which there is an uncontrolled release of discharges or evacuations. Urinary incontinence refers to loss of bladder control resulting in involuntary or uncontrolled urination. Other forms of incontinence include faecal or bowel incontinence.[0003]Treatment options for incontinence can include behaviour management, medication and surgery. In circumstances where treatment is not available or unsuccessful, the only option is to address the incontinence events themselves. Such methods include the incontin...

Claims


Application Information

Patent Timeline
IPC IPC(8): G06F17/30G16H40/67
CPCG06F17/30595A61F13/42G06F16/284G16H40/67
Inventor MASHINCHI, MOHAMMAD HADIBARDA, DAVID ALBERTHUANG, JIAN
Owner FRED BERGMAN HEALTHCARE PTY LTD
Why Eureka
Try Eureka