Ice keel prediction from sar, optical imagery and upward looking sonars

a technology of optical imagery and ice keel, which is applied in the direction of instruments, measurement devices, and using reradiation, can solve the problems of sar imagery sea ice thickness data not finding much use in the oil and gas industry, and the rcs value is distorted

Inactive Publication Date: 2014-10-23
CONOCOPHILLIPS CO
View PDF3 Cites 15 Cited by
  • Summary
  • Abstract
  • Description
  • Claims
  • Application Information

AI Technical Summary

Benefits of technology

[0017]The present invention is a method of making ice keel predictions using Synthetic Aperture Radar (SAR), optical imagery and upward looking sonars (ULS). Generally, the present invention correlates ice keel thickness measured by ULS during the previous winter season with satellite images of ice. The relational expression can then be used to estimate ice thickness in the future using SAR only. This allows for the use of SAR and optical imagery to track the movement of ice near drilling equipment and to estimate the ice thickness in near-real time, thus allowing for evasive action to be taken when necessary.
[0018]Once the ice melts in the summer, data from the ULS can be used to determine the accuracy of the SAR-only thickness predictions of the previous winter. This allows for the correlation to be refined over the course of multiple years to provide a more accurate relational expression.
[0019]The benefit of such a correlation is the ability to construct near-real time ice movement forecasts and ice keel thickness to help access the threat to oil facilities, and to facilitate informed ice management threat mitigation processes. The present invention is expected to help the oil industry explore and recover hydrocarbons from oil reserves in the Arctic and reduce the risks of accidents and leaks.
[0037]As such, the present invention takes advantage of the current satellite technology. Today, there are more satellites available and these satellites are better at collecting images. As such, there exist a constellation of satellites capable of collecting SAR and optical images of the sea ice every 4-5 hours per day, and the interval continues to decrease as more satellites are deployed. This produces enough images to show ice movement in closer to real time, thus allowing time to prepare and take evasive actions.
[0047]The stereo imagery for the SAR and optical imagery allows identifying various ice features without ambiguity. Furthermore, relative size and movement of the ice can be determined from the SAR and optical imagery. This information may also influence the evasive methods taken by rigs.
[0059]The term “leads” as used herein refers to a feature of ice that is a region of open water formed by the motion of the ice. During winter months, the open water remains in the leads for a short period of time before refreezing.

Problems solved by technology

However, the presence of snow on top of the ice is known to distort the RCS values.
As such, the sea ice thickness data from SAR imagery has not found much use in the oil and gas industry.

Method used


Image

  • Ice keel prediction from sar, optical imagery and upward looking sonars
  • Ice keel prediction from sar, optical imagery and upward looking sonars
  • Ice keel prediction from sar, optical imagery and upward looking sonars

Examples


example

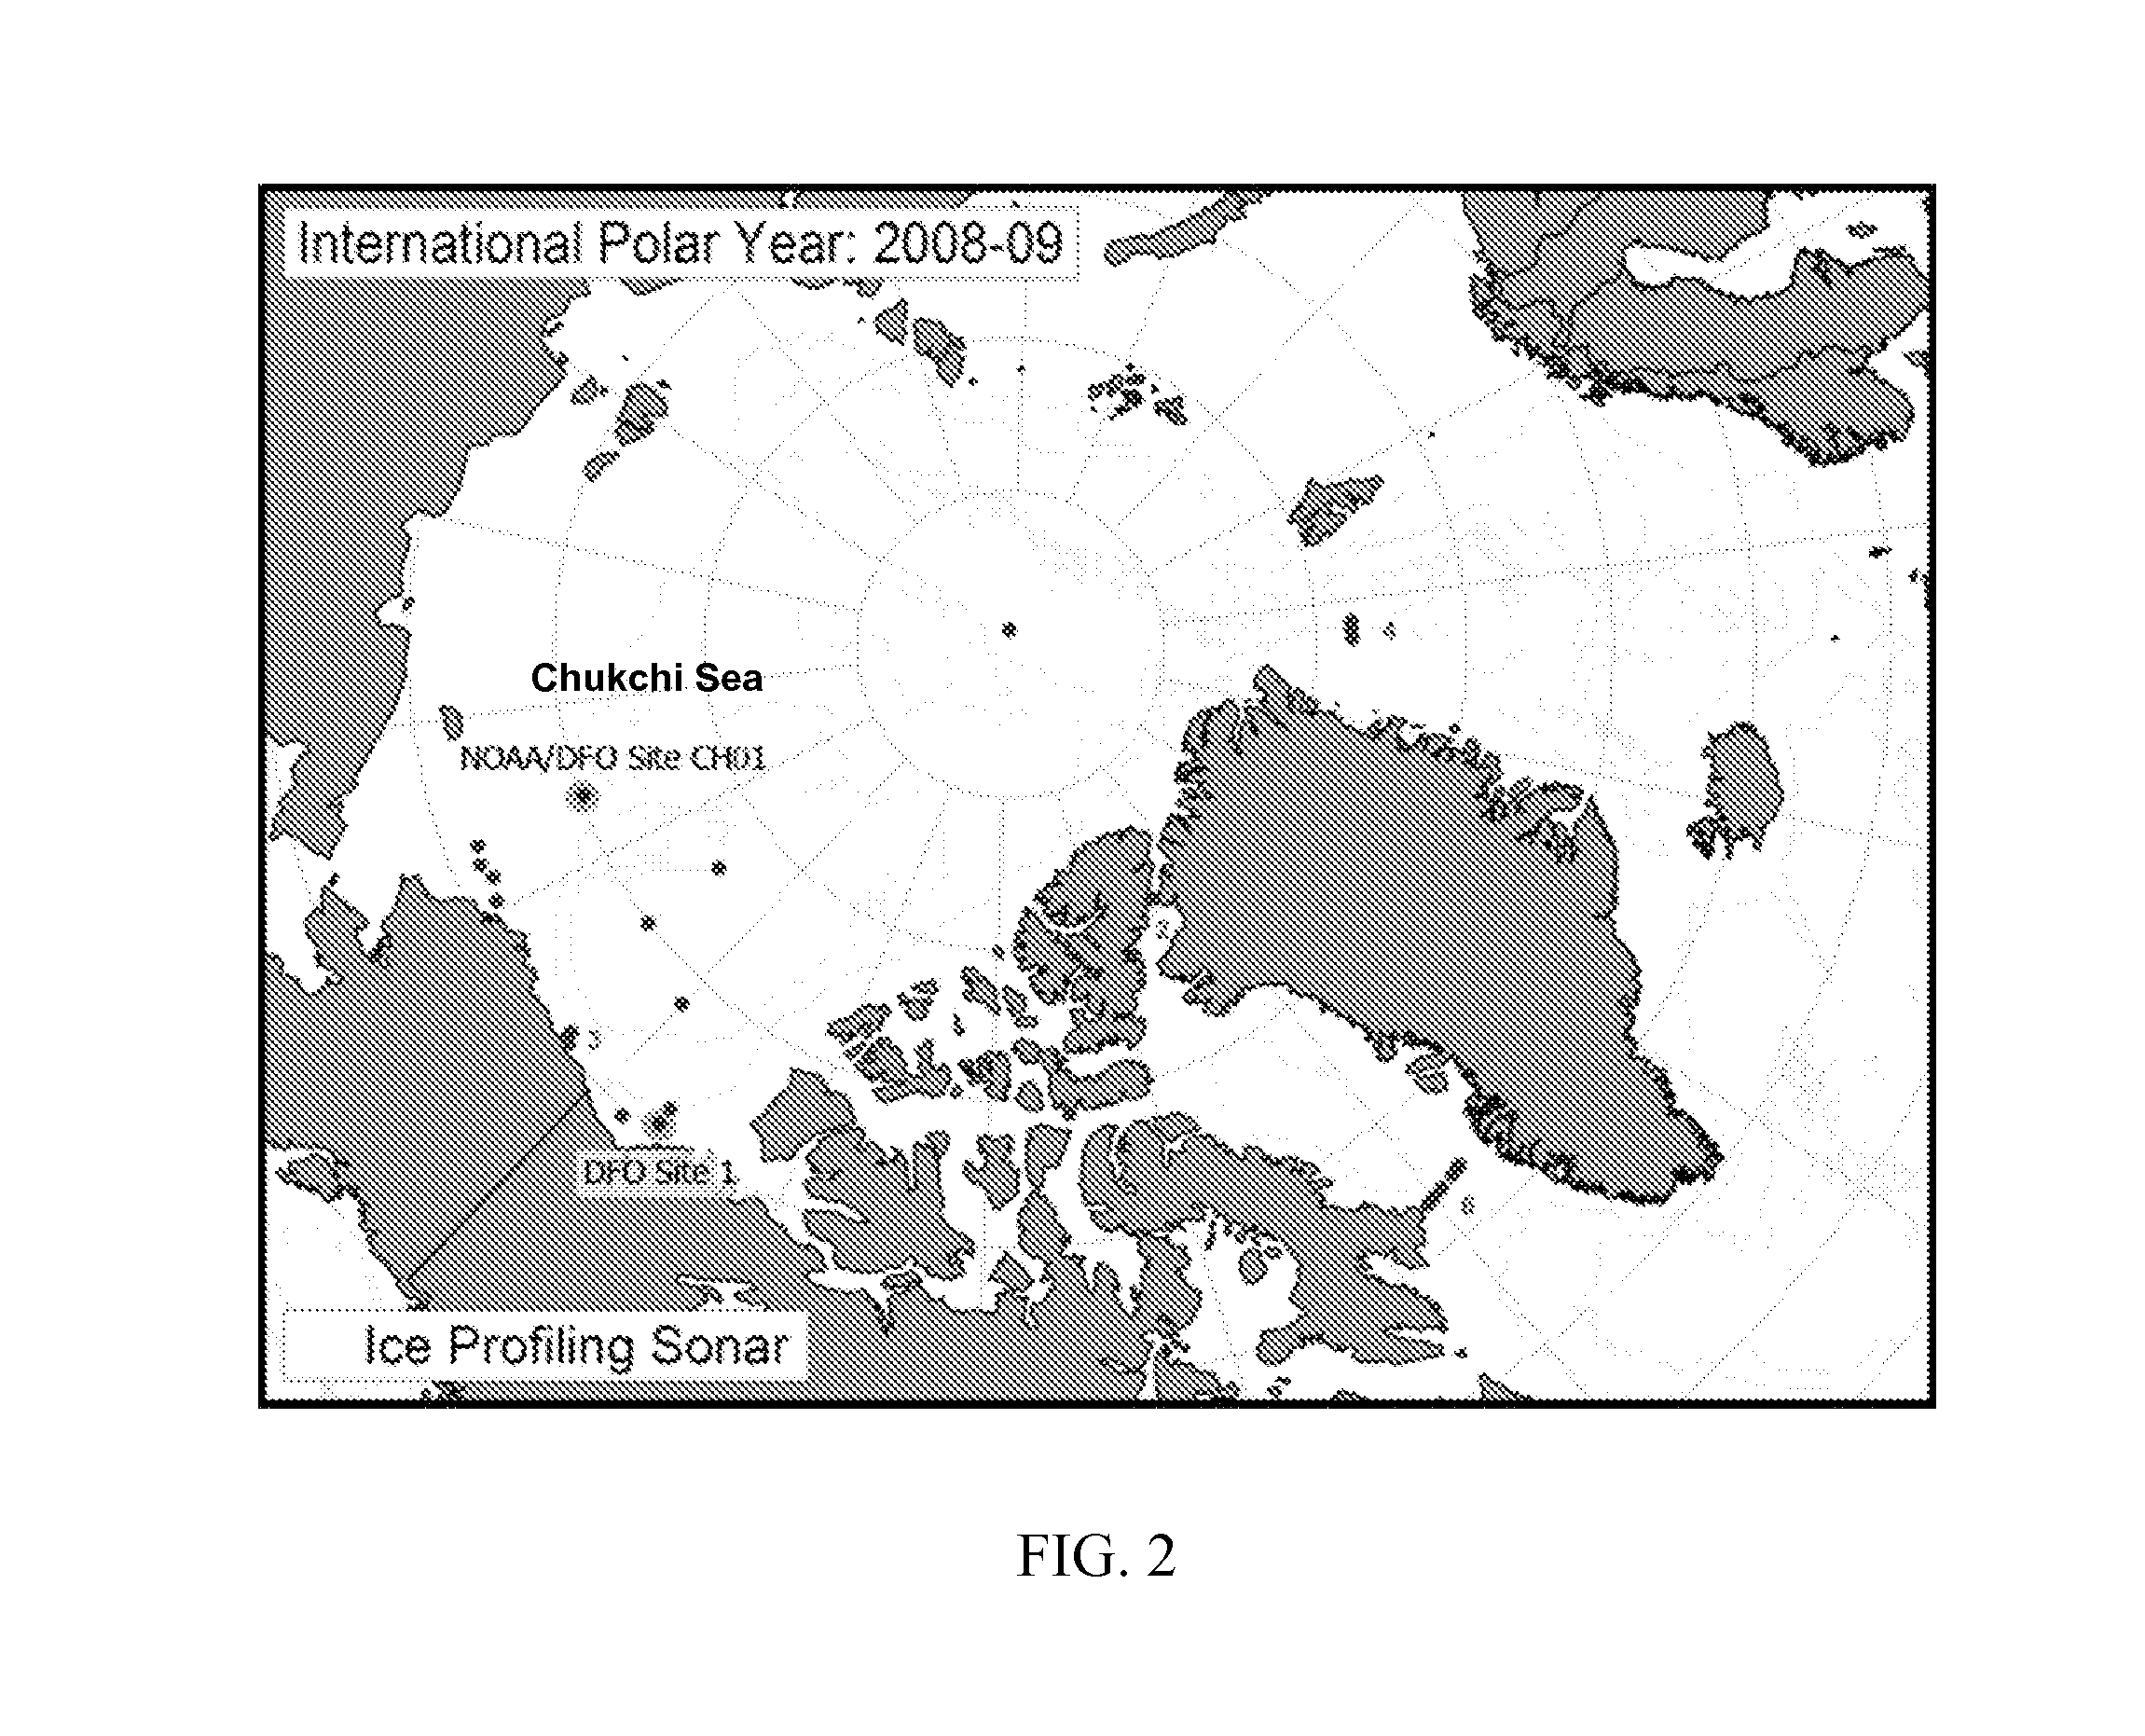
[0086]Tables 1 and 2 display ice draft measurements taken for Site I during Winter 2008-09 and 2009-10, respectively.

TABLE 1Winter 2008-09 (Lat: 70°59.972N; Lon: 165°0.073W)Date / TimeMax Draft (m)Mean Draft (m)4 / 30 11:0226.4216.095 / 8 13:2626.1814.455 / 11 2:1125.8315.734 / 30 22:5824.8416.895 / 12 0:4624.7118.296 / 30 5:0523.6614.974 / 1 13:4922.9915.915 / 10 14:4222.7113.676 / 25 1:0422.6315.615 / 15 1:3421.9913.04

TABLE 2Winter 2009-10 (Lat: 70°59.9510N; Lon: 165°0.134W)Date / TimeMax Draft (m)Mean Draft (m)3 / 12 2:1426.6715.184 / 22 13:2226.2518.895 / 10 10:3225.1816.623 / 6 17:2624.0617.115 / 5 15:3323.718.226 / 1 8:4122.5112.094 / 22 14:0322.4715.043 / 6 9:1722.1714.793 / 16 22:2621.6713.664 / 29 4:0621.5115.25

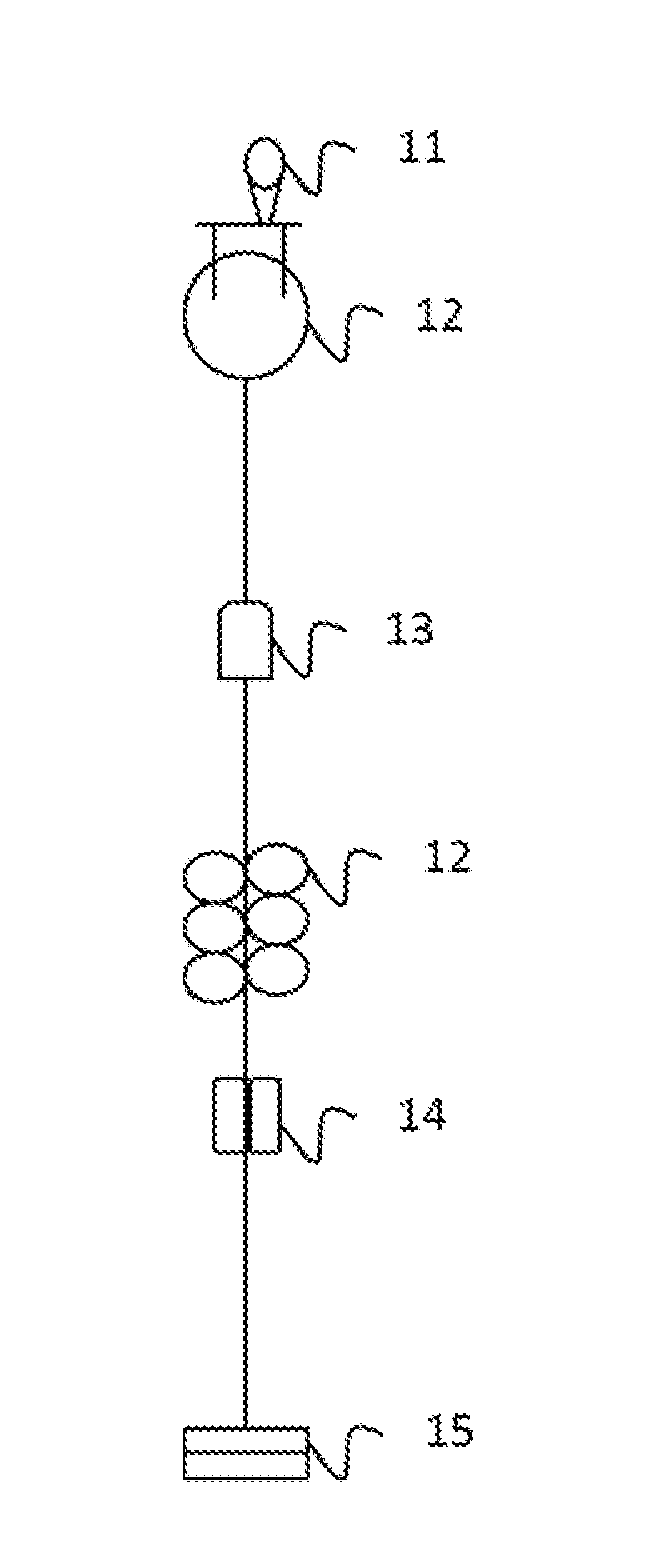
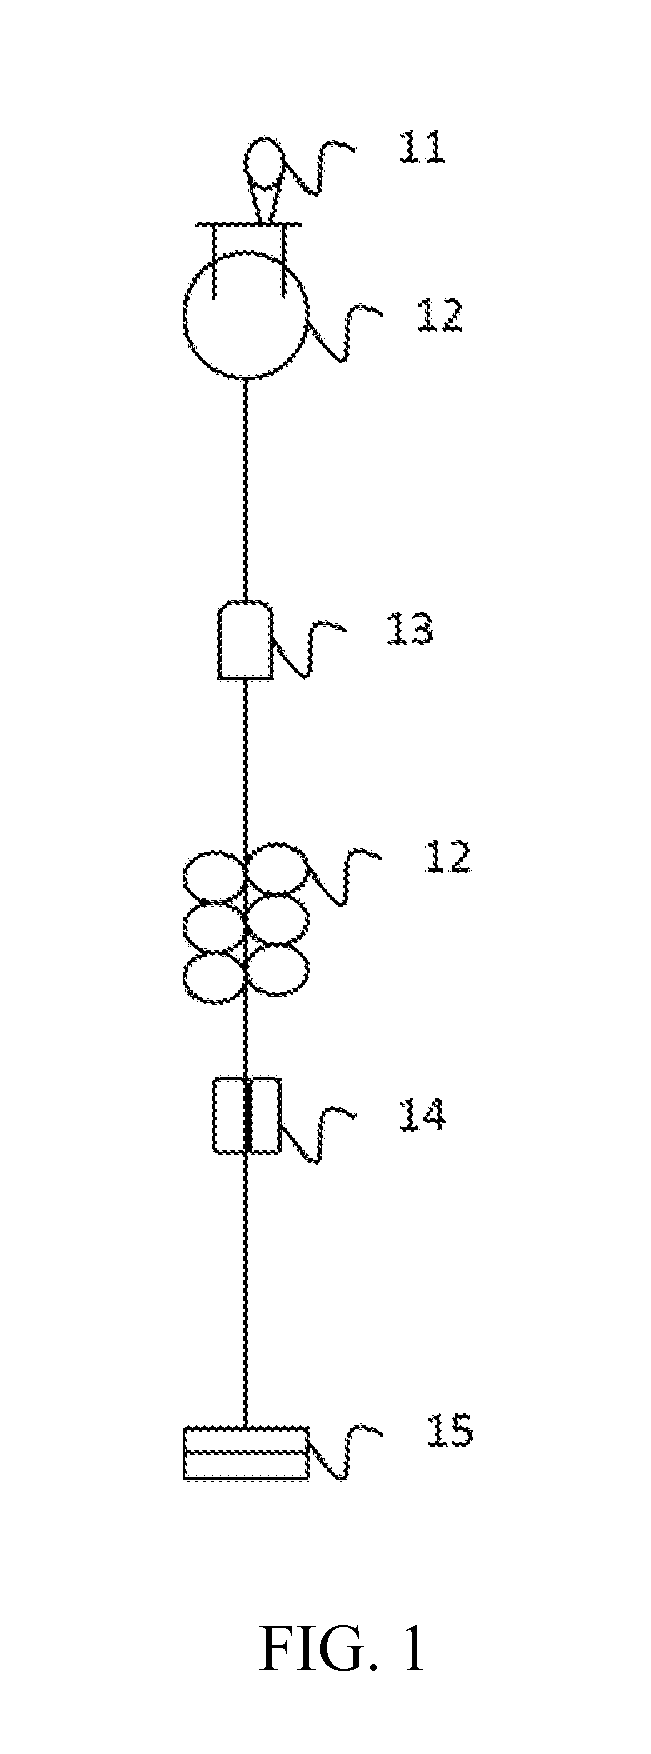
[0087]Processing ULS Data: Measurements were collected every 12 hrs from Sep. 9, 2008 until Aug. 28, 2009 by an Ice Profiling Sonar (IPS) ULS and ADCP moored at Site I, located at Lat: 70°59.972N; Lon: 165°0.073W. The data was processed using the Ice Profiling Sonar Processing Toolbox for Matlab, which is prov...


PUM


Abstract

A method correlates satellite image data with data taken from multiple upward-looking sonars moored on the sea floor. The correlation of this information facilitates the prediction of ice thickness in later seasons using synthetic aperture radiation only, thus allowing for the assessment of threats to oil exploration, production or completion facilities located in the Arctic Ocean.

Description

CROSS-REFERENCE TO RELATED APPLICATIONS[0001]This application is a non-provisional application which claims benefit under 35 USC §119(e) to U.S. Provisional Application Ser. No. 61 / 815,077 filed Apr. 23, 2013, entitled “ICE KEEL PREDICTION FROM SAR, OPTICAL IMAGERY AND UPWARD LOOKING SONARS,” which is incorporated herein in its entirety.STATEMENT FEDERALLY SPONSORED RESEARCH OR DEVELOPMENT[0002]Not ApplicableREFERENCE TO MICROFICHE APPENDIX[0003]Not applicable.FIELD OF THE INVENTION[0004]This invention relates generally to simultaneous measurements of ice movement and keel thickness, and particularly to a method of correlating ice thickness as determined by upward looking sonars with synthetic aperture radar (“SAR”) images for future real-time ice thickness predictions using only SAR.BACKGROUND OF THE INVENTION[0005]Due to increasing need of oil and field depletion, finding new hydrocarbon reservoirs and resources has become paramount. Most areas of the world have been scoured looki...

Claims


Application Information

Patent Timeline
Patent Type & Authority Applications(United States)
IPC IPC(8): G01S13/90
CPCG01S13/90G01S13/862G01S15/87G01S15/88
Inventor SOOFI, KHALID A.COLOGGI, JOHN R.BERTA, DOMINIQUE P.NOBLE, PETER G.YETSKO, CHRISTOPHER M.
Owner CONOCOPHILLIPS CO
Why Eureka
Try Eureka