Vehicle interface

a technology of vehicle interface and interface, applied in the field of vehicle interface, can solve the problems of ineffective generated visualization, inconvenient use, and inability to properly function with existing visualization, and achieve the effects of low network speed, high level, and more detailed

Active Publication Date: 2015-05-14
WELLS FARGO BANK NA
View PDF5 Cites 18 Cited by
  • Summary
  • Abstract
  • Description
  • Claims
  • Application Information

AI Technical Summary

Benefits of technology

[0005]This brief description is provided to introduce a selection of concepts in a simplified form that are described below in the detailed description. This brief description is not intended to be an extensive overview of the claimed subject matter, identify key factors or essential features of the claimed subject matter, nor is it intended to be used to limit the scope of the claimed subject matter.
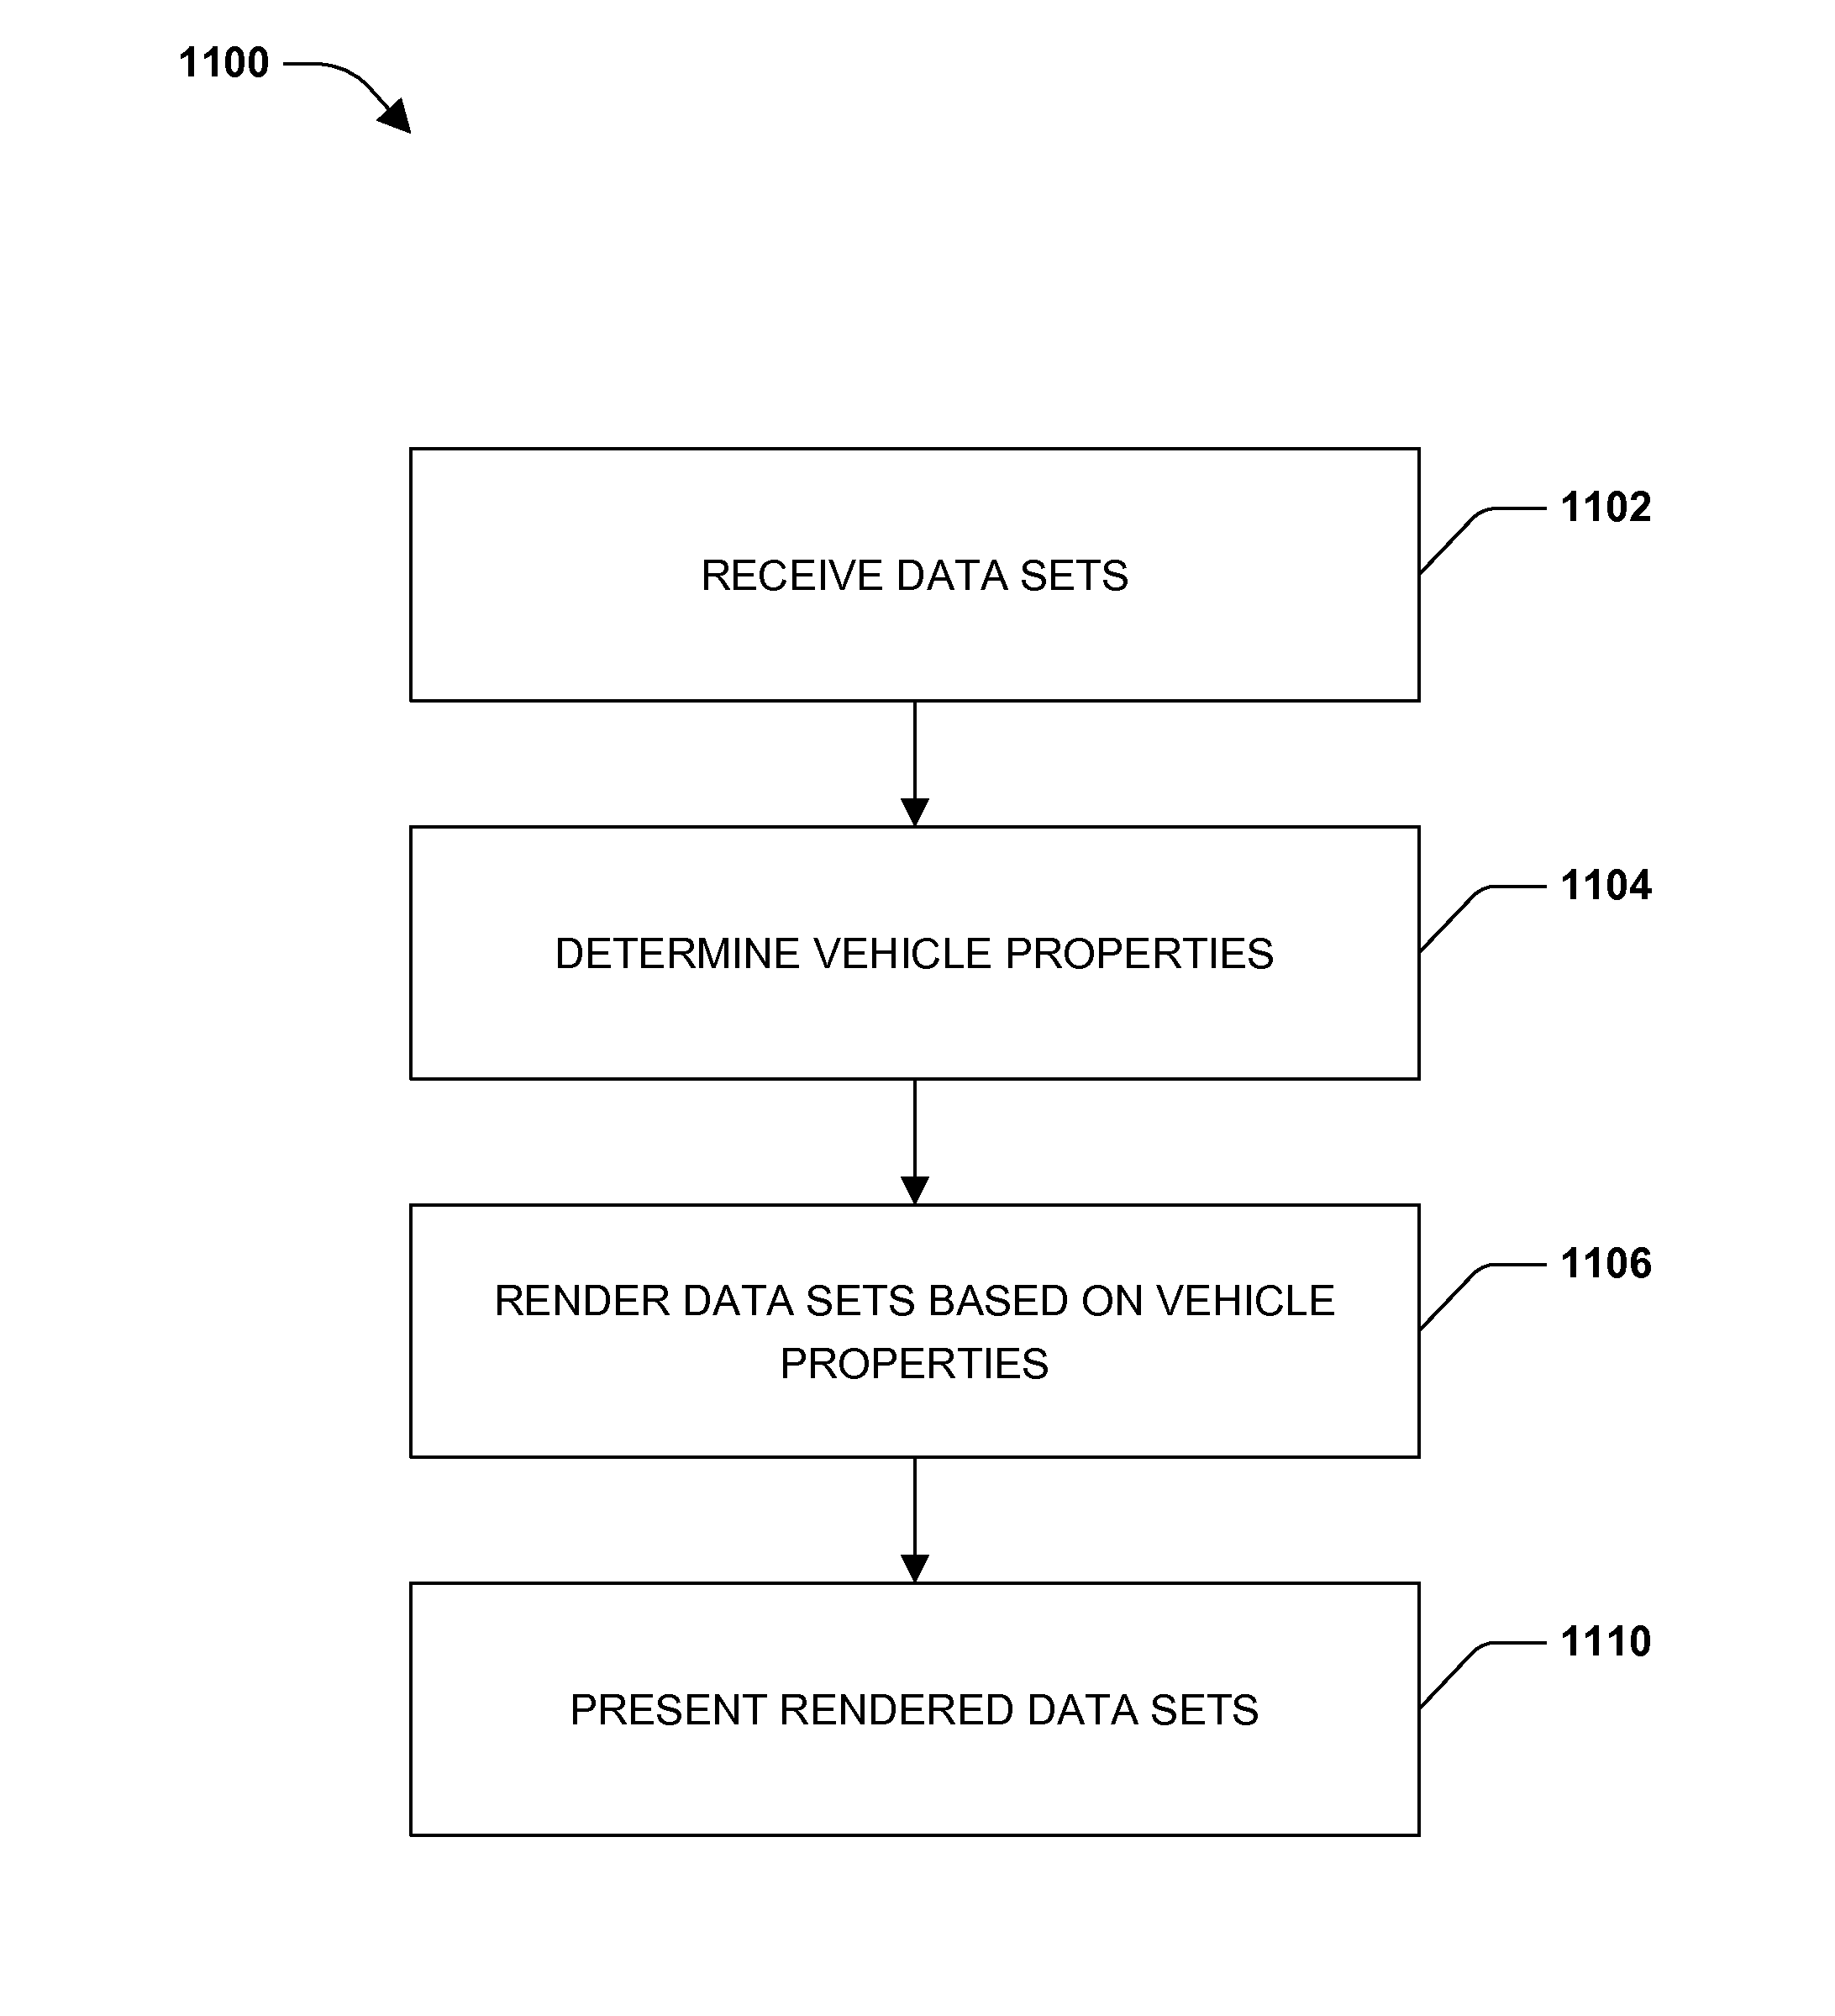
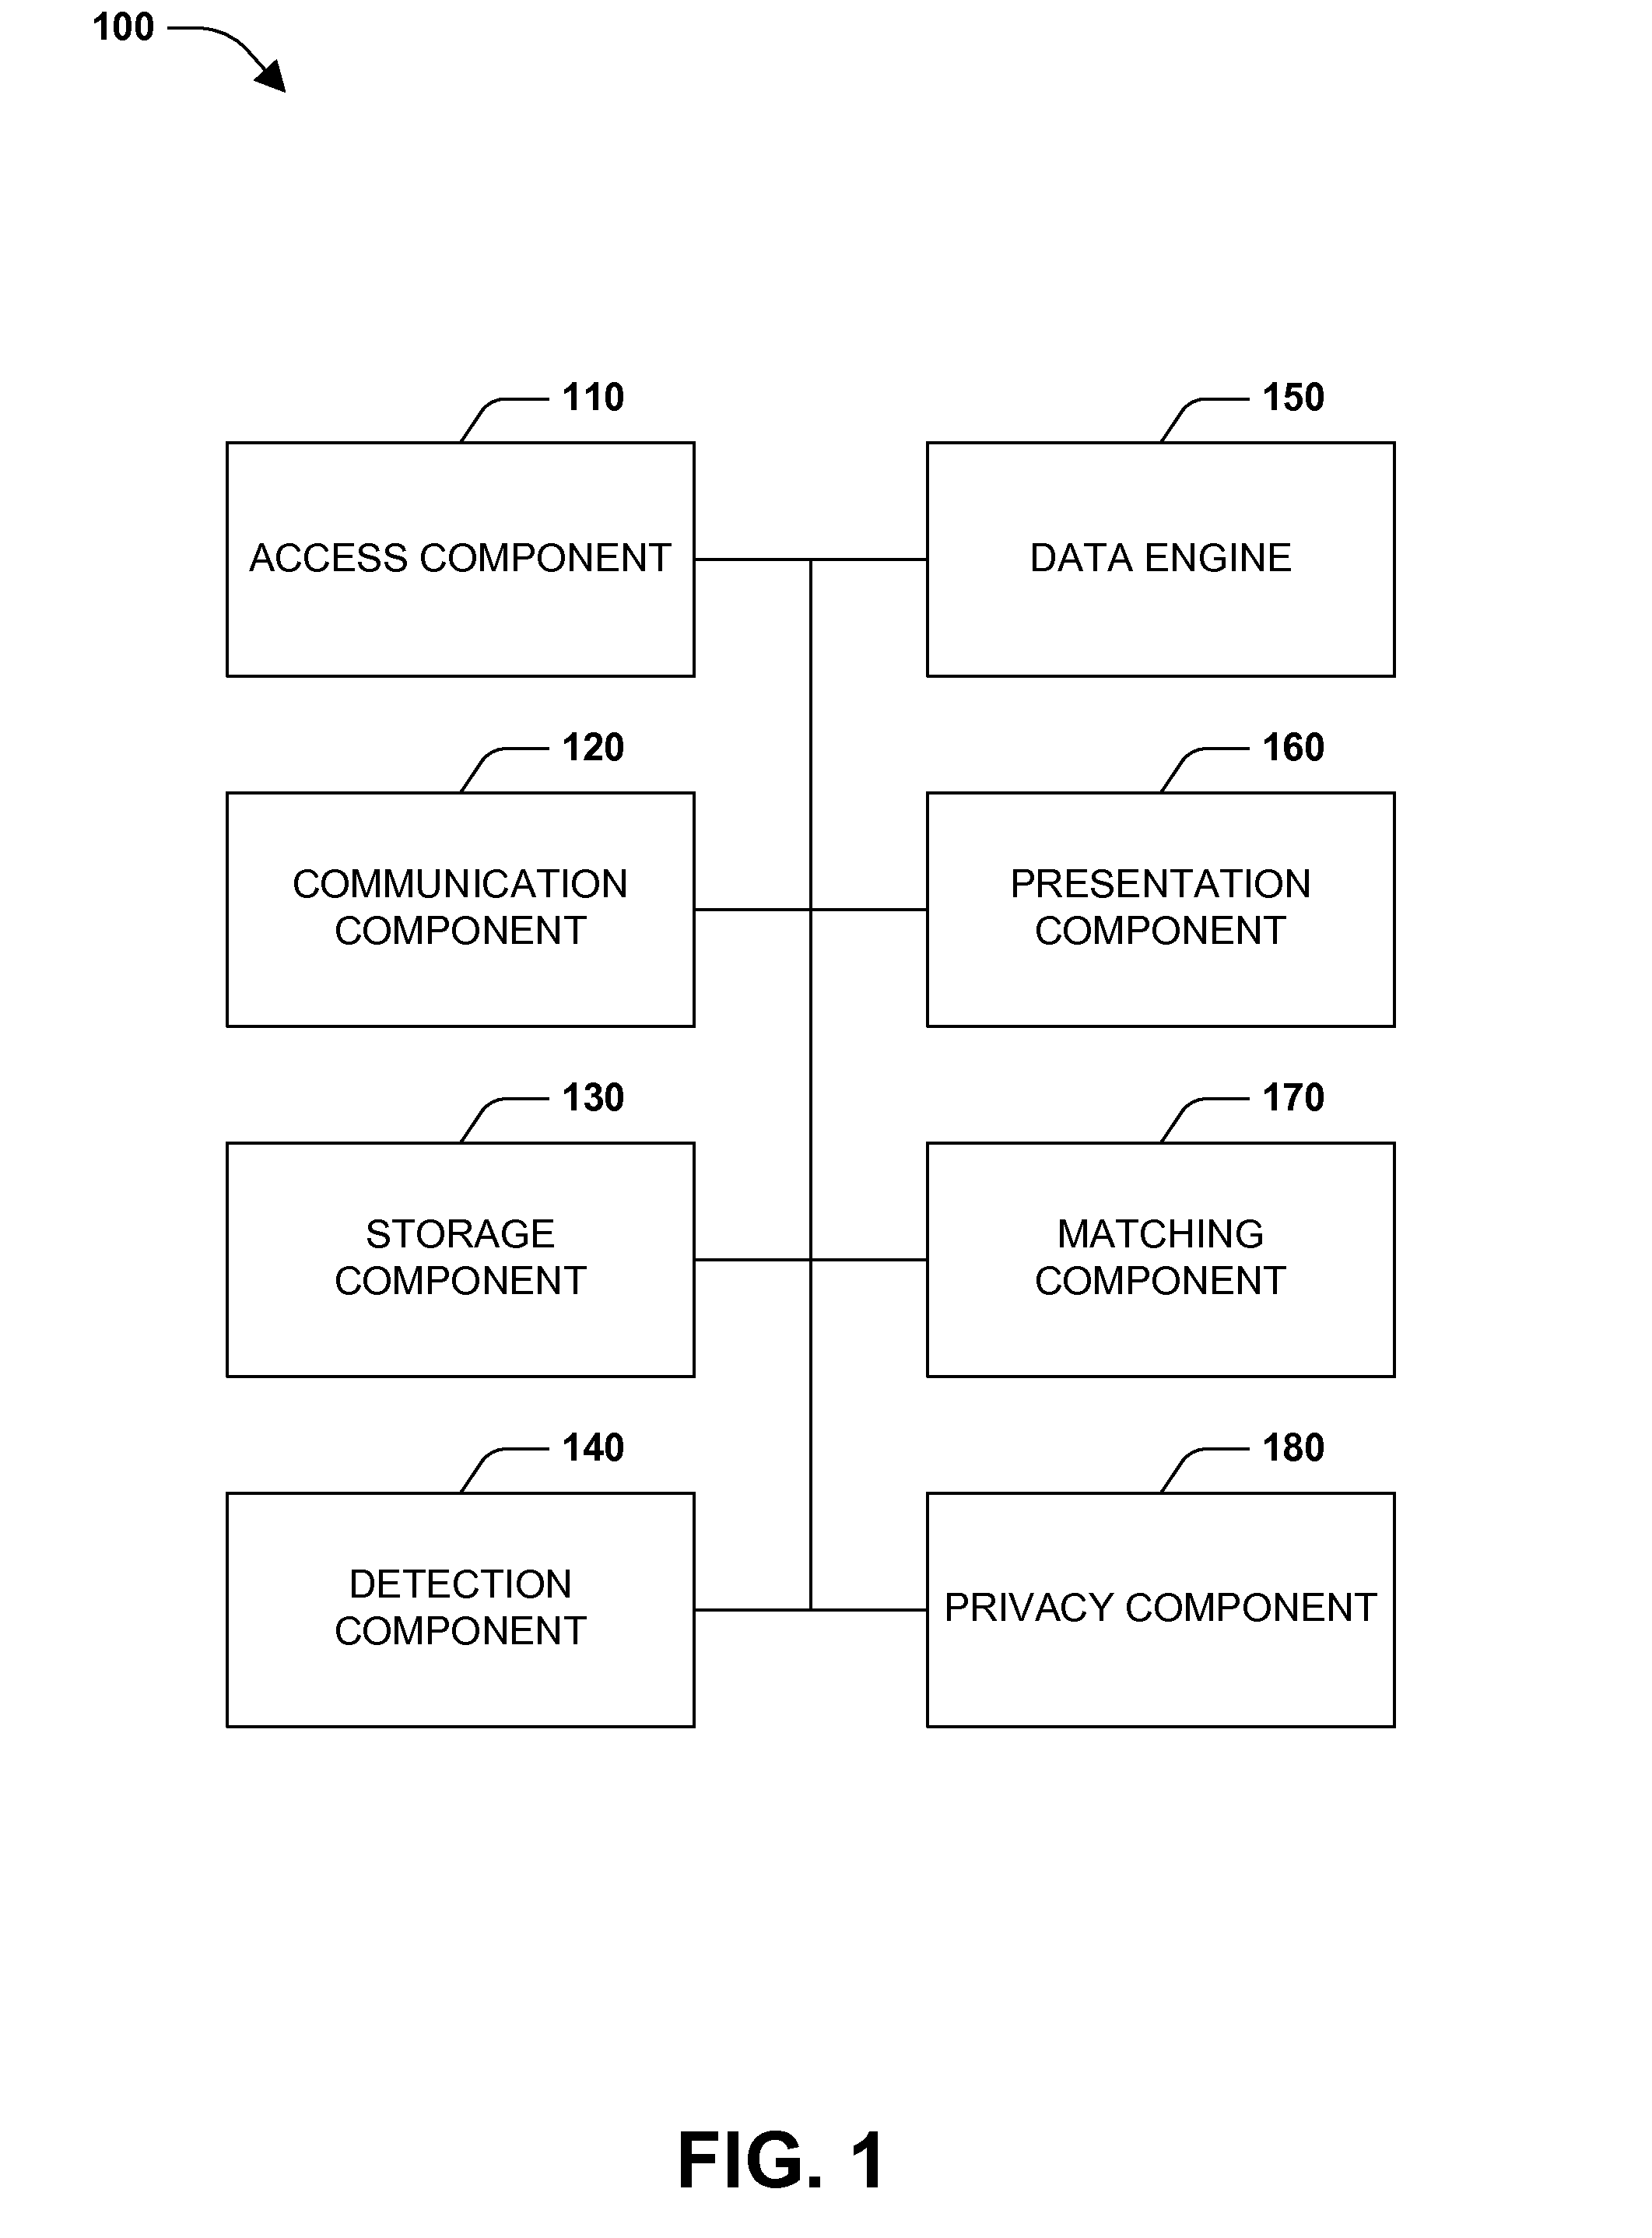
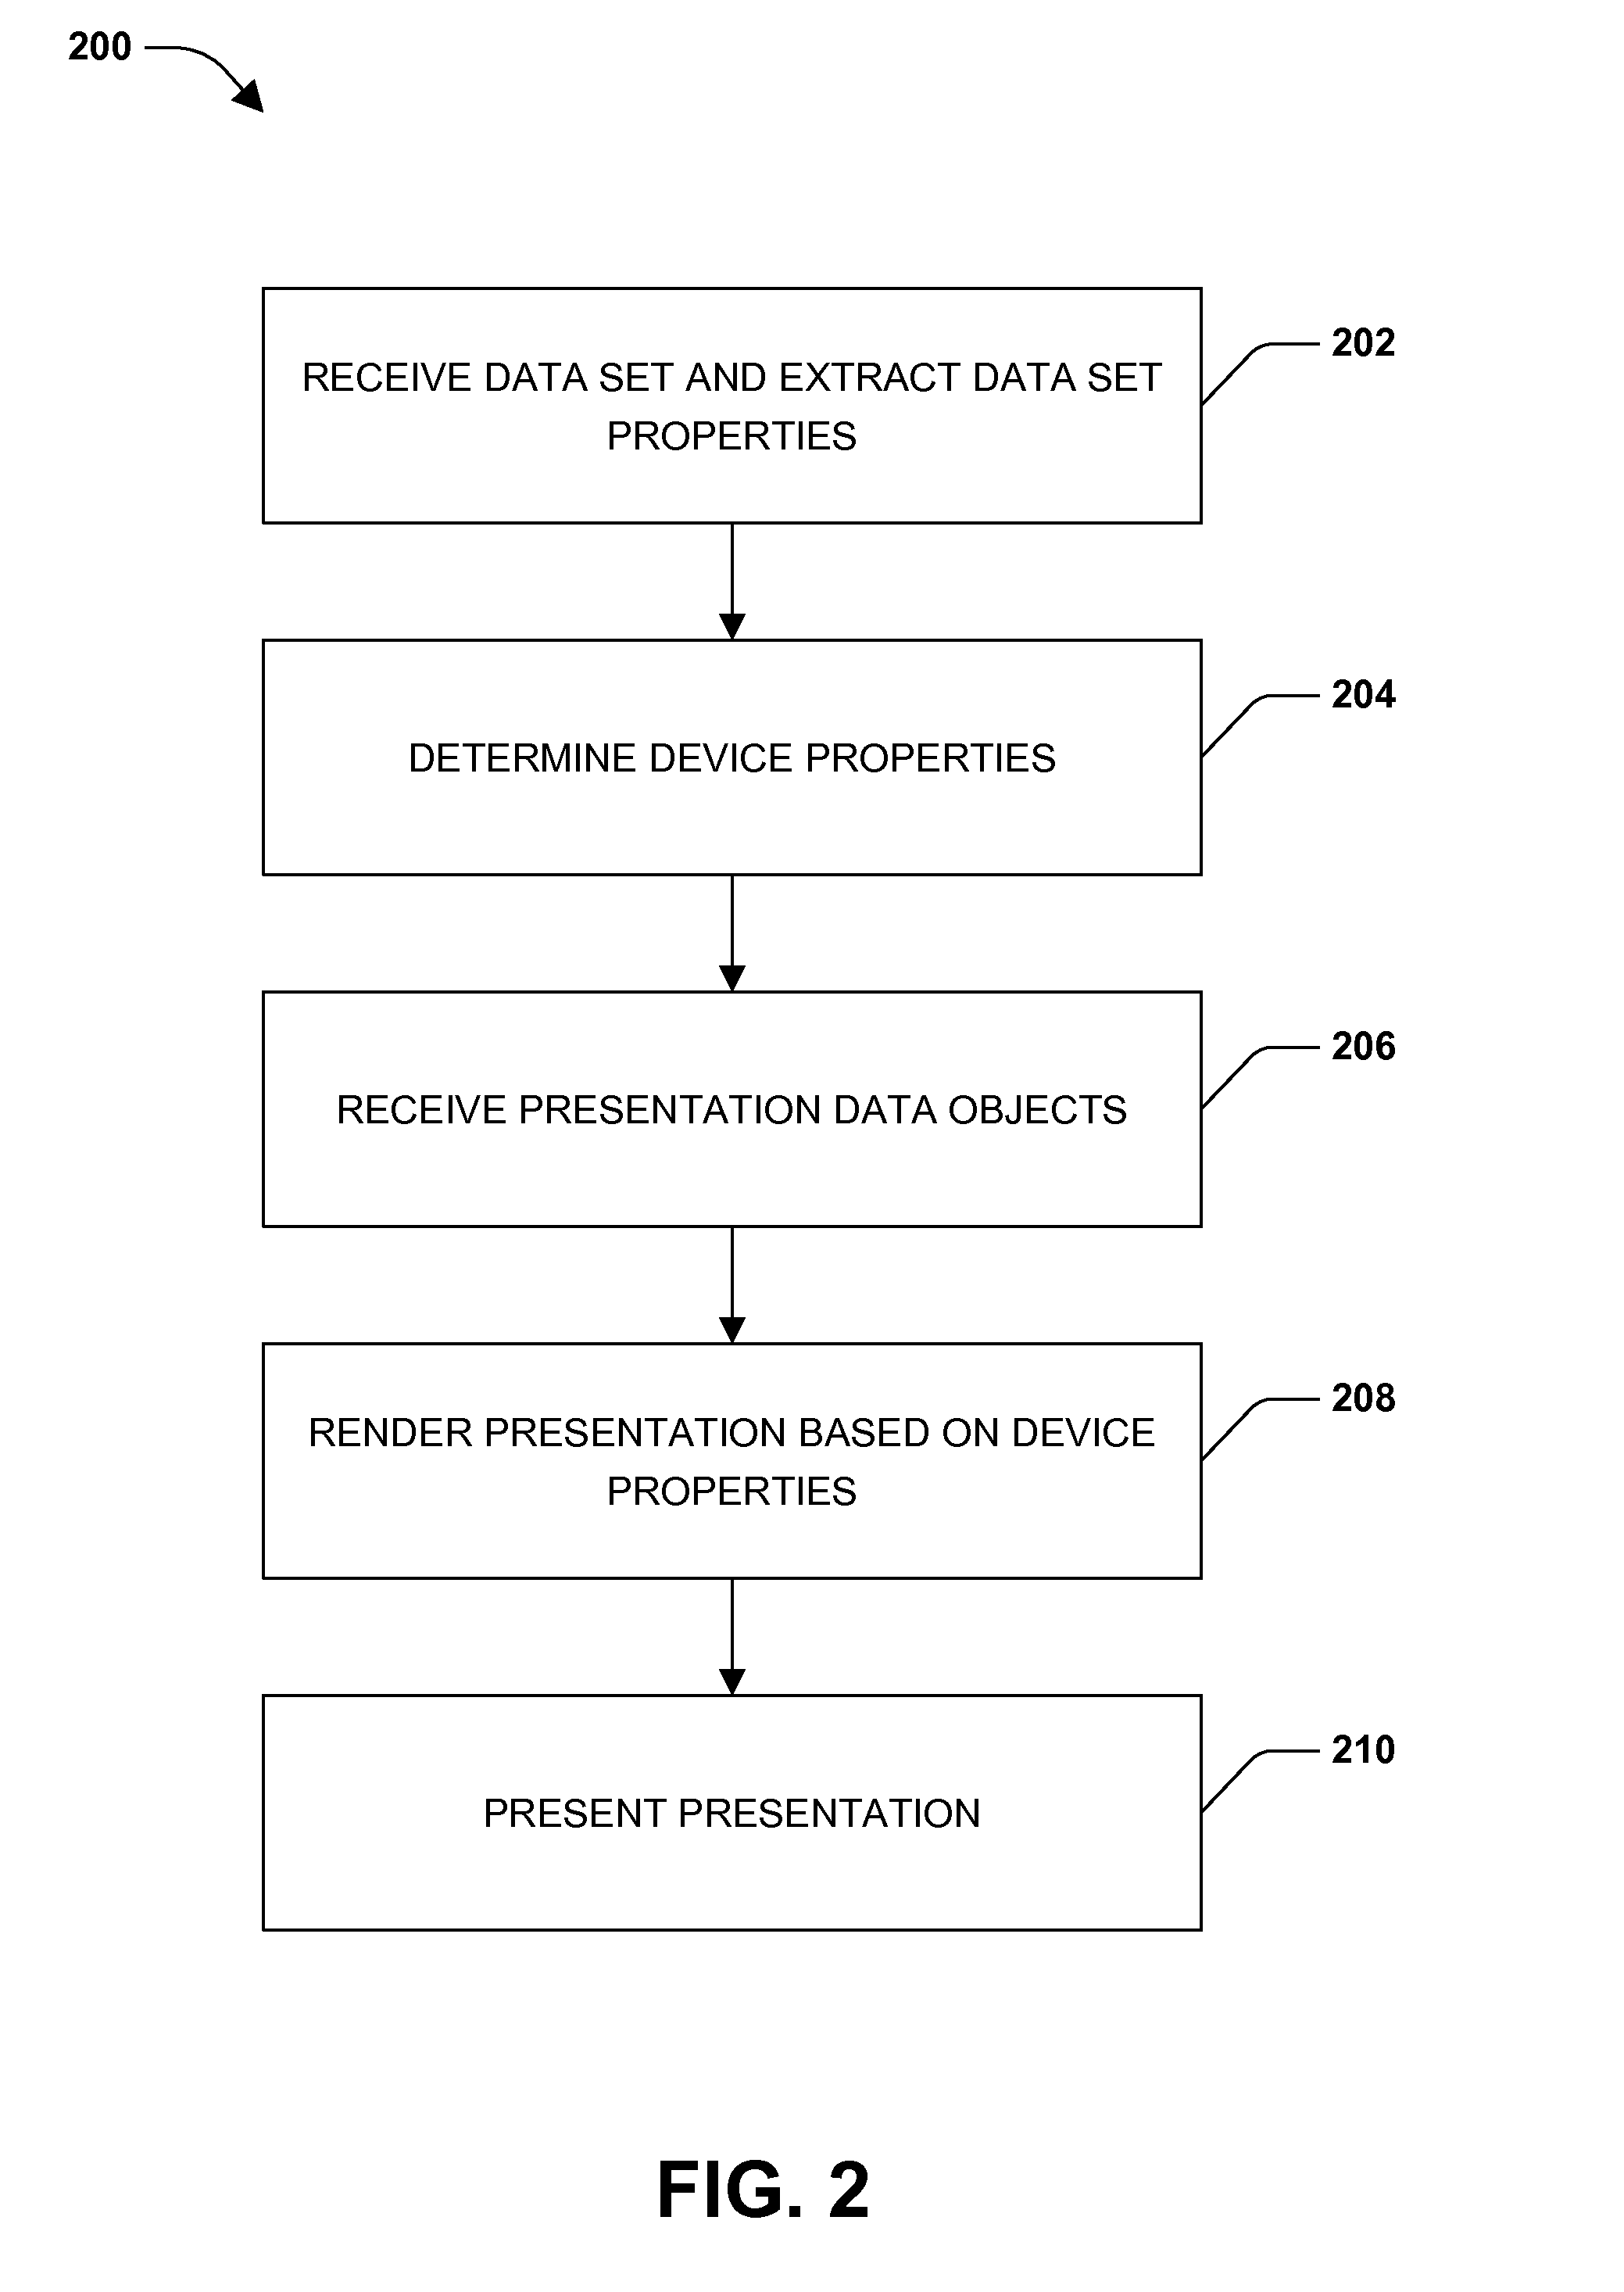
[0006]One or more embodiments of intelligent data management are provided herein. A presentation can be realized based on properties of a data set (e.g., the number and type of fields or columns in the data set). A system for data presentation, data presentation system, or an intelligent data presentation system can visualize, render, or present data of a data set using a variety of schemes, formats, visualizations, or presentations based on one or more data set properties. Additionally, the data presentation system can detect one or more capabilities of a device (e.g., device capabilities) or one or more properties of a device (e.g., device properties) and render or select an appropriate presentation or visualization based on these capabilities or properties. Because the capabilities or properties of a device can be taken into account when selecting a presentation or visualization, presentations, renderings, or interfaces can be generated, selected, or presented in a more effective manner.
[0007]As an example, a pool of one or more presentations may be rendered or generated for a data set and a presentation may be selected or matched from the pool of presentations as a best fit for a device based on one or more device properties or one or more device capabilities. According to other aspects, a single presentation may be selected as a best fit for a device and be rendered or presented by the device. Here, the selection of the presentation can be based on one or more of the device properties, device capabilities, or data set properties. That is, in some scenarios, multiple presentations or a pool of presentations may be generated or selected, while one presentation may be generated (e.g., from a pool of available or possible presentations) in other scenarios.
[0008]As a result, presentations, interfaces, or renderings can be rendered or presented in a dynamic manner when a new type of data set or a new field of a data set is encountered or consumed. This means that different presentations can be presented in different scenarios, such as after a data set is changed or updated, or when a data set is accessed from different devices having different properties or capabilities. For example, when a user accesses his or her banking data on a first mobile device (e.g., mobile phone or smartphone), a first presentation may be presented, while a second presentation (e.g., different than the first presentation) may be presented when the user accesses the banking data on second mobile device (e.g., different than the first mobile device, such as having a different screen size, etc.). As another example, if a mobile device is associated with a data plan or has limited data usage or a slower network speed than another device, a first presentation presented on a mobile device may include high level information or be in text format, while a second presentation presented on a desktop computer may include more detailed information or have more graphical content or higher resolution content. In yet another example, a first presentation may be presented while a device is in a first mode (e.g., a vehicle in drive) and a second presentation may be presented while a device is in a second mode (e.g., a vehicle in park).
[0009]Further, a presentation may be selected based on potential interactions a user may have with the presentation. Similarly, potential interactions may be determined based on device capabilities, which may include capabilities enabled via peripherals attached to the device (e.g., a mouse, a motion sensor, an image capture device, etc.), and the like. In this way, data sets can be loosely coupled with presentations or visualizations. Data sets may be decoupled such that a data presentation system can dynamically select a proper, matching, or best fit presentation from a pool of presentations for a corresponding data set or a newly encountered data set having a new data set type according to one or more device properties.

Problems solved by technology

However, as a data set is updated, such as when the number of rows or the number of columns changes, the generated visualization may no longer remain effective.
When a field of a data set is not hierarchically arrange-able or hierarchically comparable, scatter plot visualizations may not be as useful.
Similarly, if a previously available field is no longer available, the existing visualization may not function properly.

Method used


Image

  • Vehicle interface
  • Vehicle interface
  • Vehicle interface

Examples


Embodiment Construction

[0025]Embodiments or examples, illustrated in the drawings are disclosed below using specific language. It will nevertheless be understood that the embodiments or examples are not intended to be limiting. Any alterations and modifications in the disclosed embodiments, and any further applications of the principles disclosed in this document are contemplated as would normally occur to one of ordinary skill in the pertinent art. Although features may be described with reference to one embodiment, for example, it will be appreciated that these features may be implemented in other embodiments.

[0026]For one or more of the figures herein, one or more boundaries, such as boundary 1314 of FIG. 13, for example, may be drawn with different heights, widths, perimeters, aspect ratios, shapes, etc. relative to one another merely for illustrative purposes, and are not necessarily drawn to scale. For example, because dashed or dotted lines may be used to represent different boundaries, if the dash...


PUM


Abstract

One or more embodiments of techniques or systems for intelligent data presentation are provided herein. Data can be presented on similar devices having different characteristics in different manners. For example, data may be rendered in a first manner on a first device having one monitor, the same data may be rendered in a second manner on a second device having two displays or a different display size. Financial information, sales data, banking information, etc. may be presented in a variety of ways based on capabilities or properties of a device accessing the information or data. Similarly, renderings may be selected based on interaction capabilities or interaction options a user may have with different renderings or presentations. In other embodiments, user interaction with an automated teller machine (ATM), call center, vehicle, or other interface can be based on device properties or device capabilities.

Description

BACKGROUND[0001]Generally, a visualization is a way or a type of rendering to present data to a user. For example, a visualization may be a bar graph, a chart, a scatter plot, etc. When data from a data set is visualized or presented, such as by a visualization system, visualizations are often tightly coupled with the data set that is being presented. This means that a data set may be presented using merely one type of visualization. For example, when a data set is two-dimensional or 2-D, the data set may include one or more columns of data entries and one or more rows of data entries. The columns of the data set may represent features or fields, while the rows of the data set may correspond to records of those features or fields. However, as a data set is updated, such as when the number of rows or the number of columns changes, the generated visualization may no longer remain effective. That is, program code or source code for generating a visualization may follow assumptions rela...

Claims


Application Information

Patent Timeline
Patent Type & Authority Applications(United States)
IPC IPC(8): G06F3/0484G06F21/60
CPCG06F21/60G06F3/0484G06F2221/2105G06Q10/10
Inventor ELLIS, STEPHEN M.SAHNI, BIPINHATCH, DAVIDRAZZAQ, SHAHID
Owner WELLS FARGO BANK NA
Why Eureka
Try Eureka