Automated quality control of diagnostic radiology

a radiology and quality control technology, applied in the field of medical diagnostic quality assessment, can solve the problems of loss of productivity, 4% of radiological interpretations reported during daily practice, and limited assessment to the information availabl

Active Publication Date: 2017-02-23
RGT UNIV OF CALIFORNIA
View PDF28 Cites 16 Cited by
  • Summary
  • Abstract
  • Description
  • Claims
  • Application Information

AI Technical Summary

Benefits of technology

[0013]In one aspect, the system of the present disclosure uses a data-driven approach to objectively measure the diagnostic accuracy and value of diagnostic imaging reports (e.g. radiology) based on a comparison against a “precision diagnosis” rendered by other clinical data sources such as pathology, surgery, laboratory tests, etc. The system further utilizes the evaluation of the diagnostic accuracy of radiologists or any individual who may provide interpretations from diagnostic images (imagers), subspecialty sections, modalities, and entire departments to provide a means for quantitatively assessing differences between imaging-derived interpretations and other clinical information, providing a basis for continuing education and quality improvement.
[0014]In one aspect, the system performs an automated mapping between image-based findings and findings from “precision diagnosis” sources, computing the concordance between the two findings. The system allows for real-time or retrospective analysis of imager diagnostic performance (e.g., accuracy of diagnosis, time required until diagnosis) and provides a means for adaptively assigning new cases to imagers based on their performance on past studies.

Problems solved by technology

However, previous studies have demonstrated that approximately 4% of radiological interpretations reported during daily practice contain errors.
Nevertheless, several shortcomings are noted: 1) both peer-review systems do not address variability in interpretation, assuming that another radiologists' findings serves as the “gold-standard”; 2) the process is time consuming, resulting in lost productivity; 3) the criteria for grading may not be clearly defined or followed by reviewers; and 4) the assessment is limited to the information available at the time of interpretation, which does not address the broader question of what value the radiologic interpretation has on the patient's outcome.

Method used


Image

  • Automated quality control of diagnostic radiology
  • Automated quality control of diagnostic radiology
  • Automated quality control of diagnostic radiology

Examples


Embodiment Construction

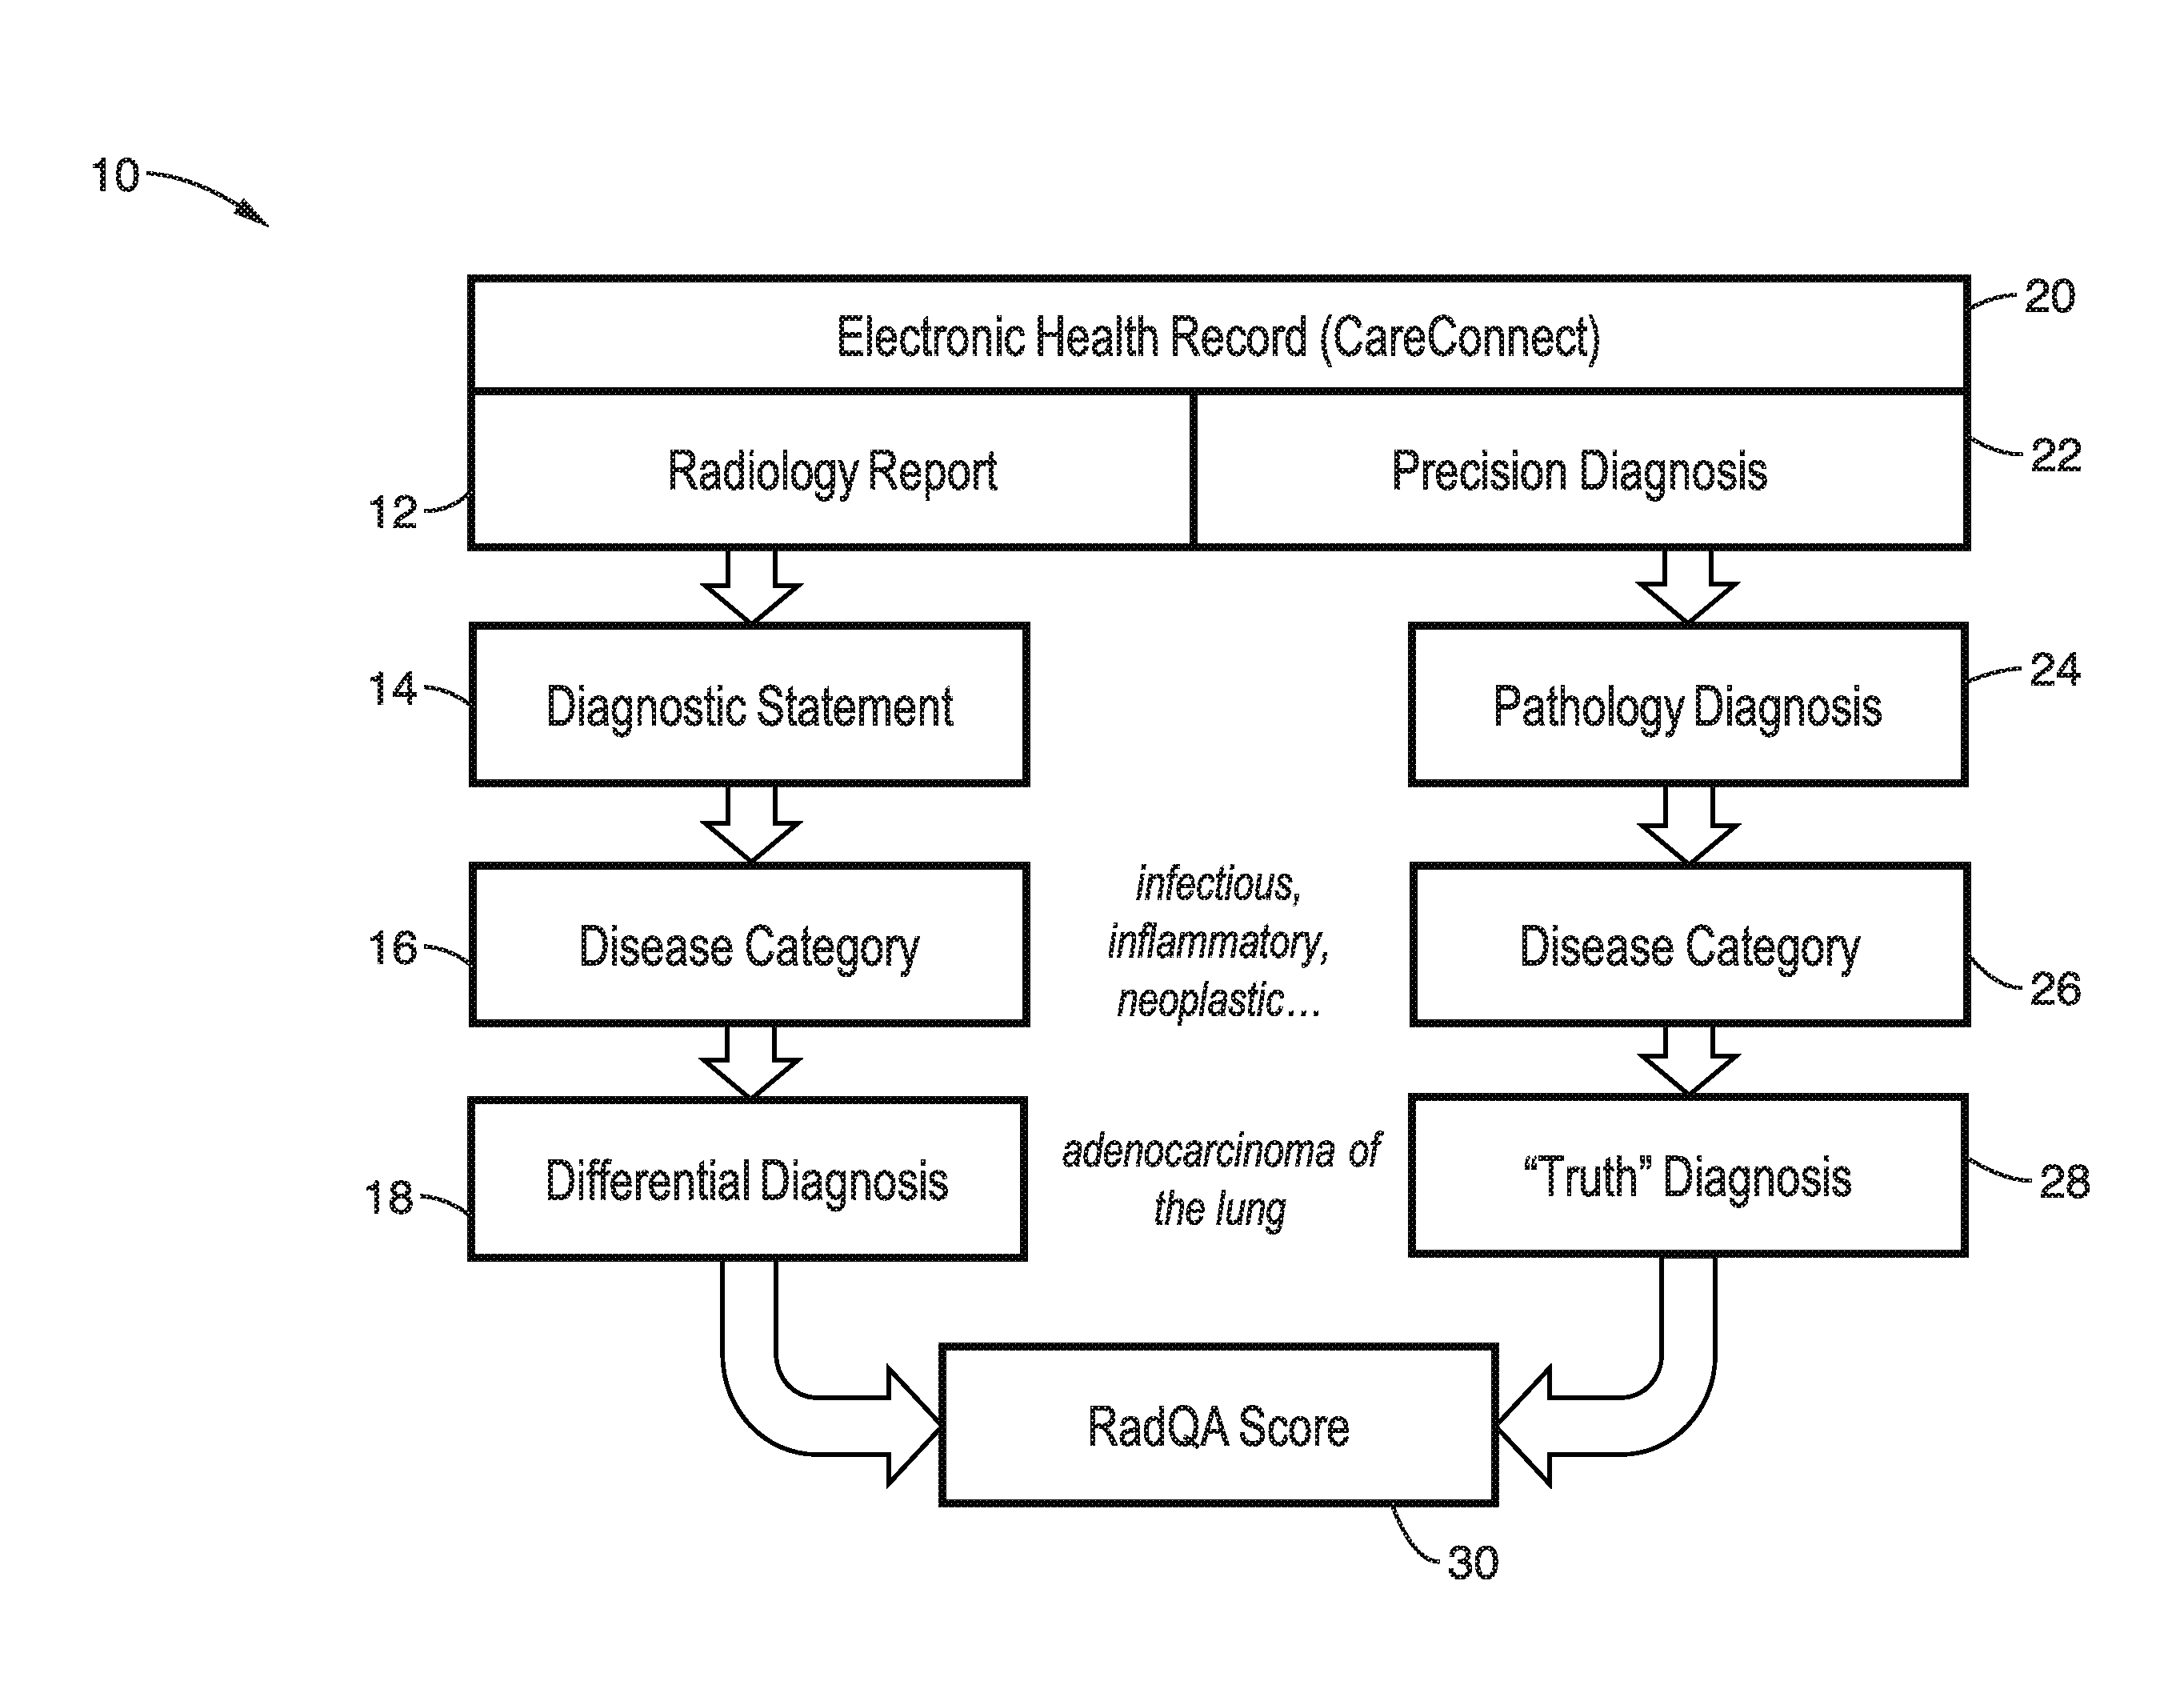
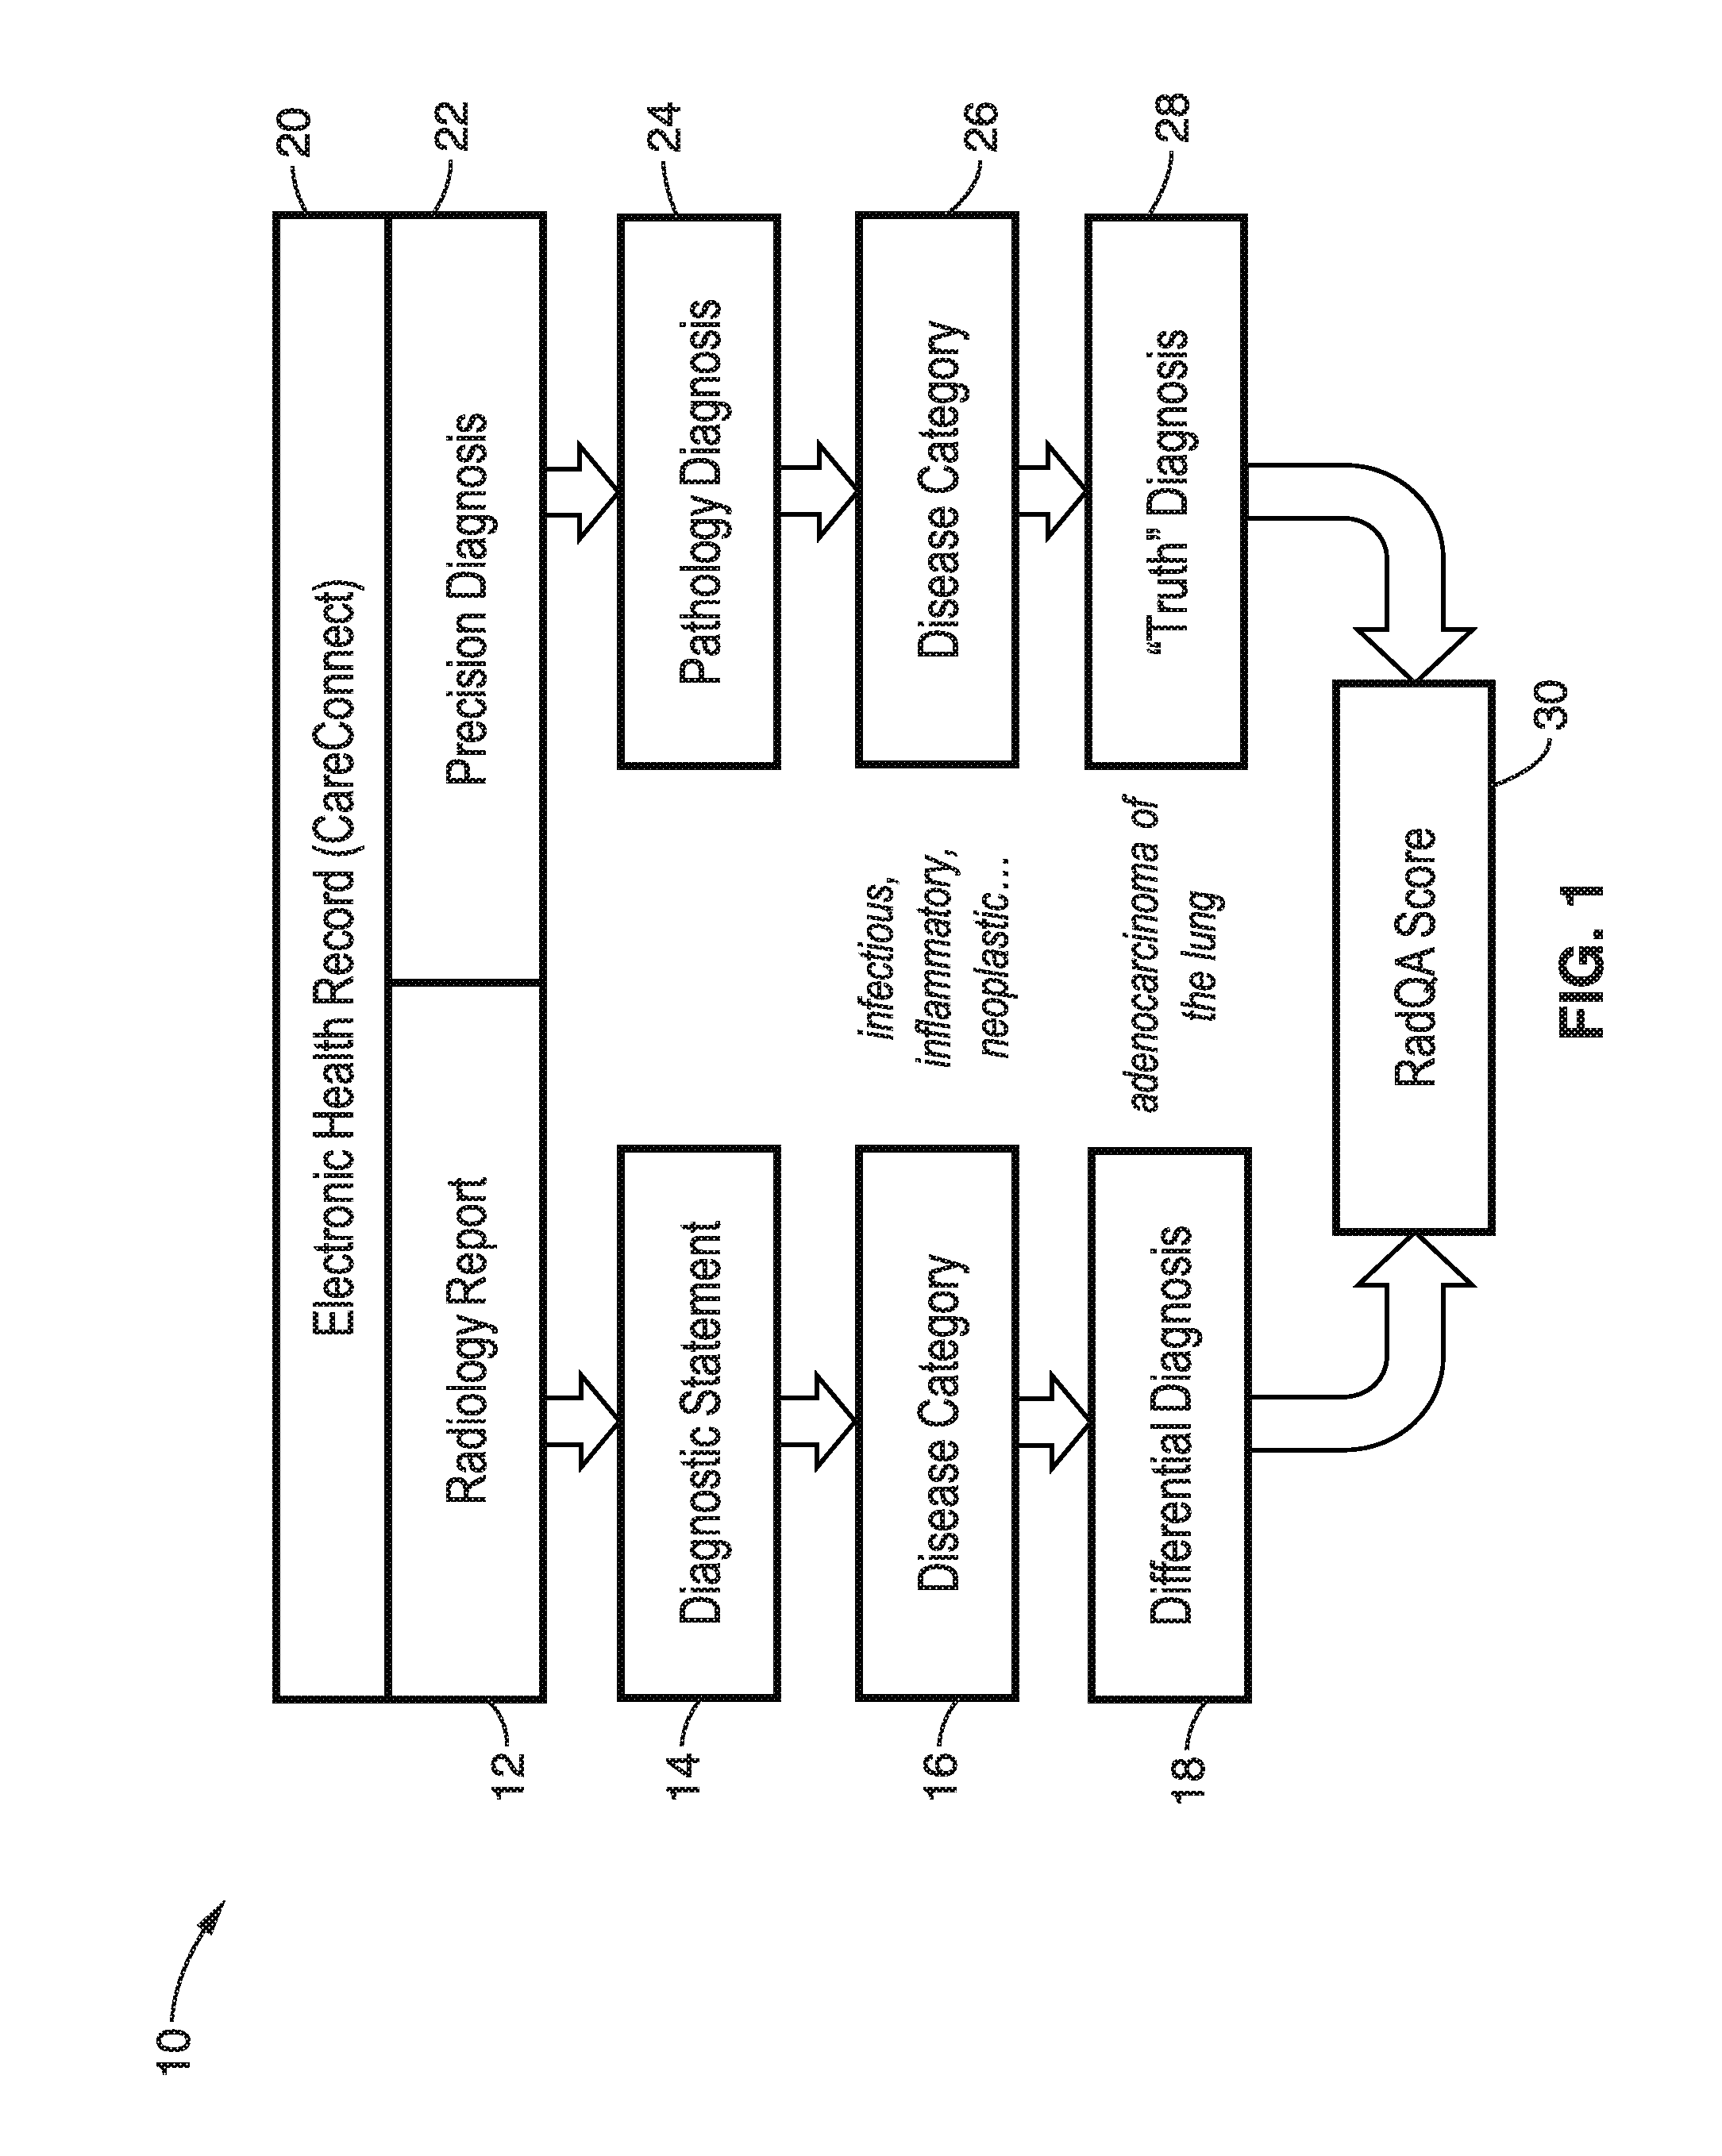
[0032]The system and methods detailed below objectively assess diagnostic accuracy based on comparison with findings from other clinical sources such as pathology (“precision diagnosis”) rather than an interpretation rendered by peers.

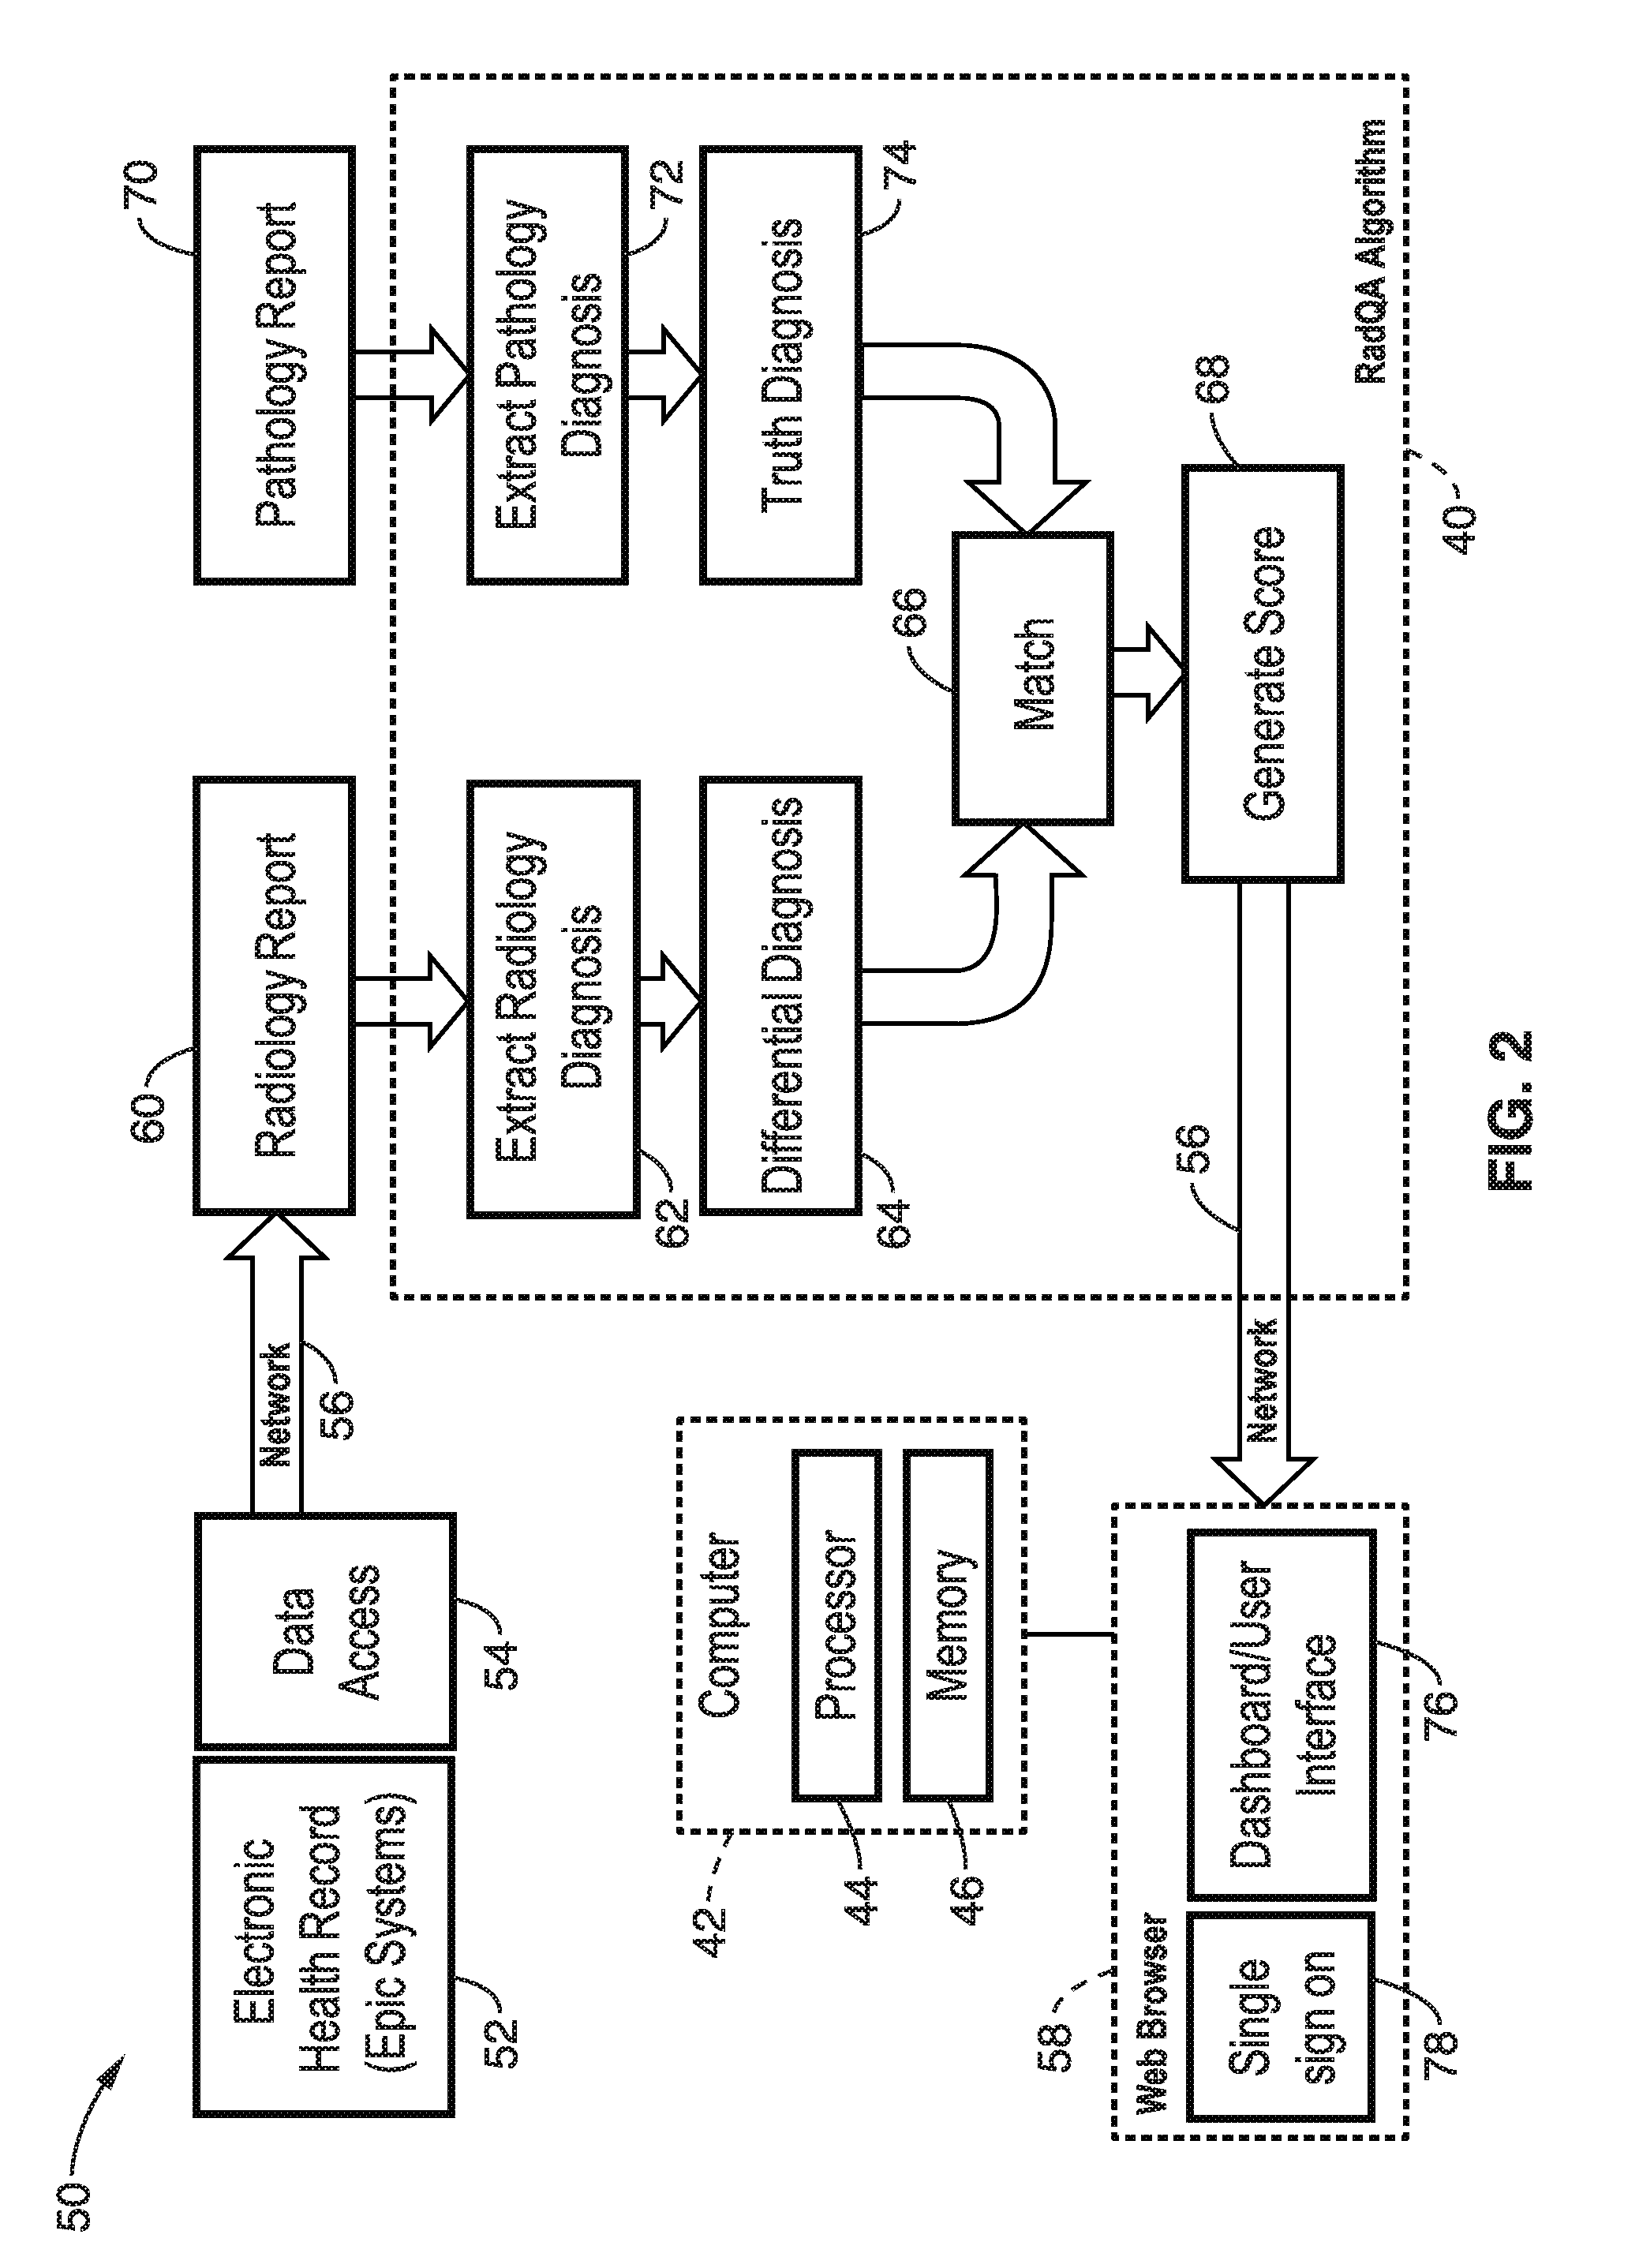
[0033]The system detailed below is particularly directed to evaluation of the concordance between breast biopsy recommendations reported using Breast Imaging-Reporting and Data System (BI-RADS) and actual pathological diagnosis from those individuals who undergo a biopsy. The system integrates real-time data from clinical systems as inputs to automatically generate a dashboard that reports information about the concordance rates between as-signed BIRADS scores and pathology assessments. The system routinely retrieves radiology exam information for breast imaging such as modality, exam and interpretation dates, signing radiologist, BIRADS assessment, and full-text report. For the same patients, the system also retrieves information from the pathology la...


PUM


Abstract

A system is disclosed using a data-driven approach to objectively measure the diagnostic accuracy and value of diagnostic imaging reports using data captured routinely as part of the electronic health record. The system further utilizes the evaluation of the diagnostic accuracy of individual radiologists (imagers), subspecialty sections, modalities, and entire departments based on a comparison against a “precision diagnosis” rendered by other clinical data sources such as pathology, surgery, laboratory tests, etc.

Description

CROSS-REFERENCE TO RELATED APPLICATIONS[0001]This application is a 35 U.S.C. §111(a) continuation of PCT international application number PCT / US2015 / 018825 filed on Mar. 4, 2015, incorporated herein by reference in its entirety, which claims priority to, and the benefit of, U.S. provisional patent application Ser. No. 61 / 947,563 filed on Mar. 4, 2014, incorporated herein by reference in its entirety. Priority is claimed to each of the foregoing applications.[0002]The above-referenced PCT international application was published as PCT International Publication No. WO 2015 / 018825 on Sep. 11, 2015, which publication is incorporated herein by reference in its entirety.STATEMENT REGARDING FEDERALLY SPONSORED RESEARCH OR DEVELOPMENT[0003]Not ApplicableINCORPORATION-BY-REFERENCE OF COMPUTER PROGRAM APPENDIX[0004]Not ApplicableNOTICE OF MATERIAL SUBJECT TO COPYRIGHT PROTECTION[0005]A portion of the material in this patent document is subject to copyright protection under the copyright laws ...

Claims


Application Information

Patent Timeline
Patent Type & Authority Applications(United States)
IPC IPC(8): G06F19/00G06T7/00G16H10/60G16H30/40G16H40/20G16H50/20
CPCG06F19/327G06T7/0012G06T2207/10116G06T2207/30096G06T2207/30068G06Q10/103G16H40/20G16H30/40G16H50/20G16H15/00G16H10/00G16H80/00G16H10/60G16H30/20
Inventor ENZMANN, DIETERHSU, WILLIAMARNOLD, COREY W.BUI, ALEX A.T.
Owner RGT UNIV OF CALIFORNIA
Why Eureka
Try Eureka