Gas-mapping 3D imager measurement techniques and method of data processing

a 3d imager and gas mapping technology, applied in the direction of fluid speed measurement, measurement of fluid loss/gain rate, instruments, etc., can solve the problem of high cost of lidar and photogrammetric sensors for producing high-quality 3d spatial data, and achieve the effect of reducing measurement time, improving detection confidence, and reducing the time needed to monitor

Active Publication Date: 2017-04-06
BRIDGER PHOTONICS
View PDF5 Cites 59 Cited by
  • Summary
  • Abstract
  • Description
  • Claims
  • Application Information

AI Technical Summary

Benefits of technology

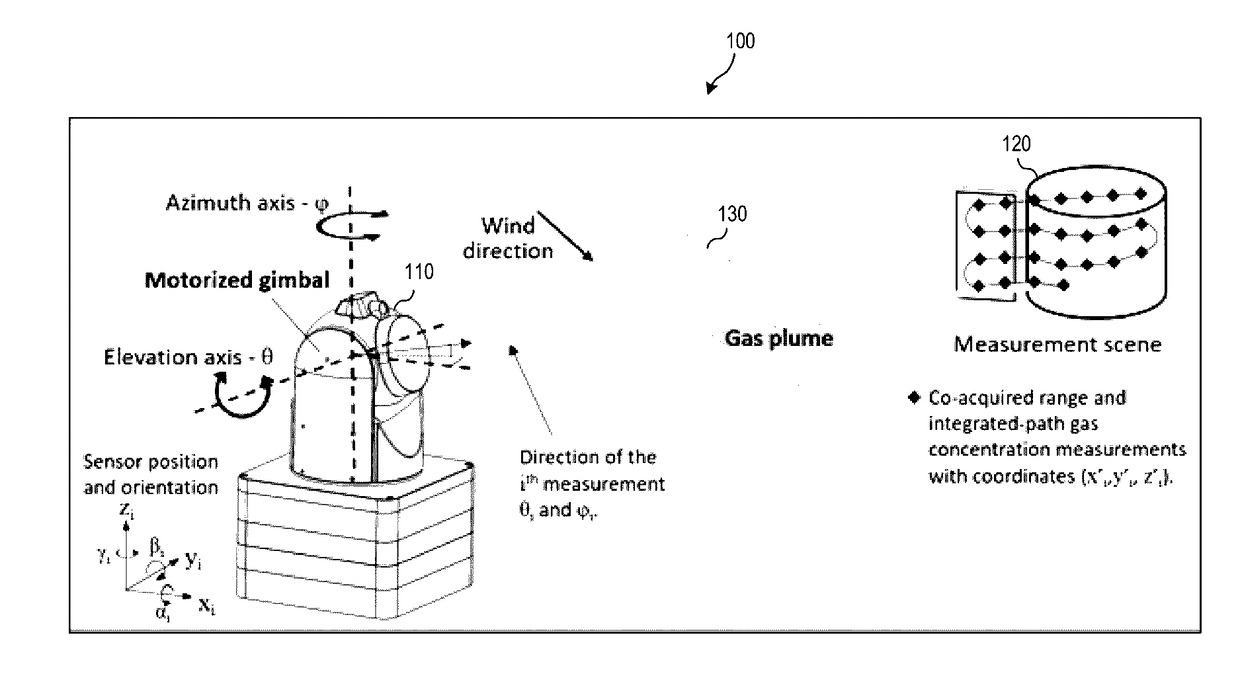
[0010]A method is provided for reducing the time needed to monitor for gas leaks, comprising: utilizing 3D spatial data to identify regions and / or structures of a scene for gas monitoring and / or regions that may be occluded from view; utilizing the identified regions and / or structures of the scene to determine a gas sensing measurement procedure that exhibits reduced measurement time and / or improved detection confidence compared to a gas sensing measurement procedure created without knowledge of the 3D spatial data of the scene; and utilizing the determined gas sensing measurement procedure to perform gas sensing of a scene.
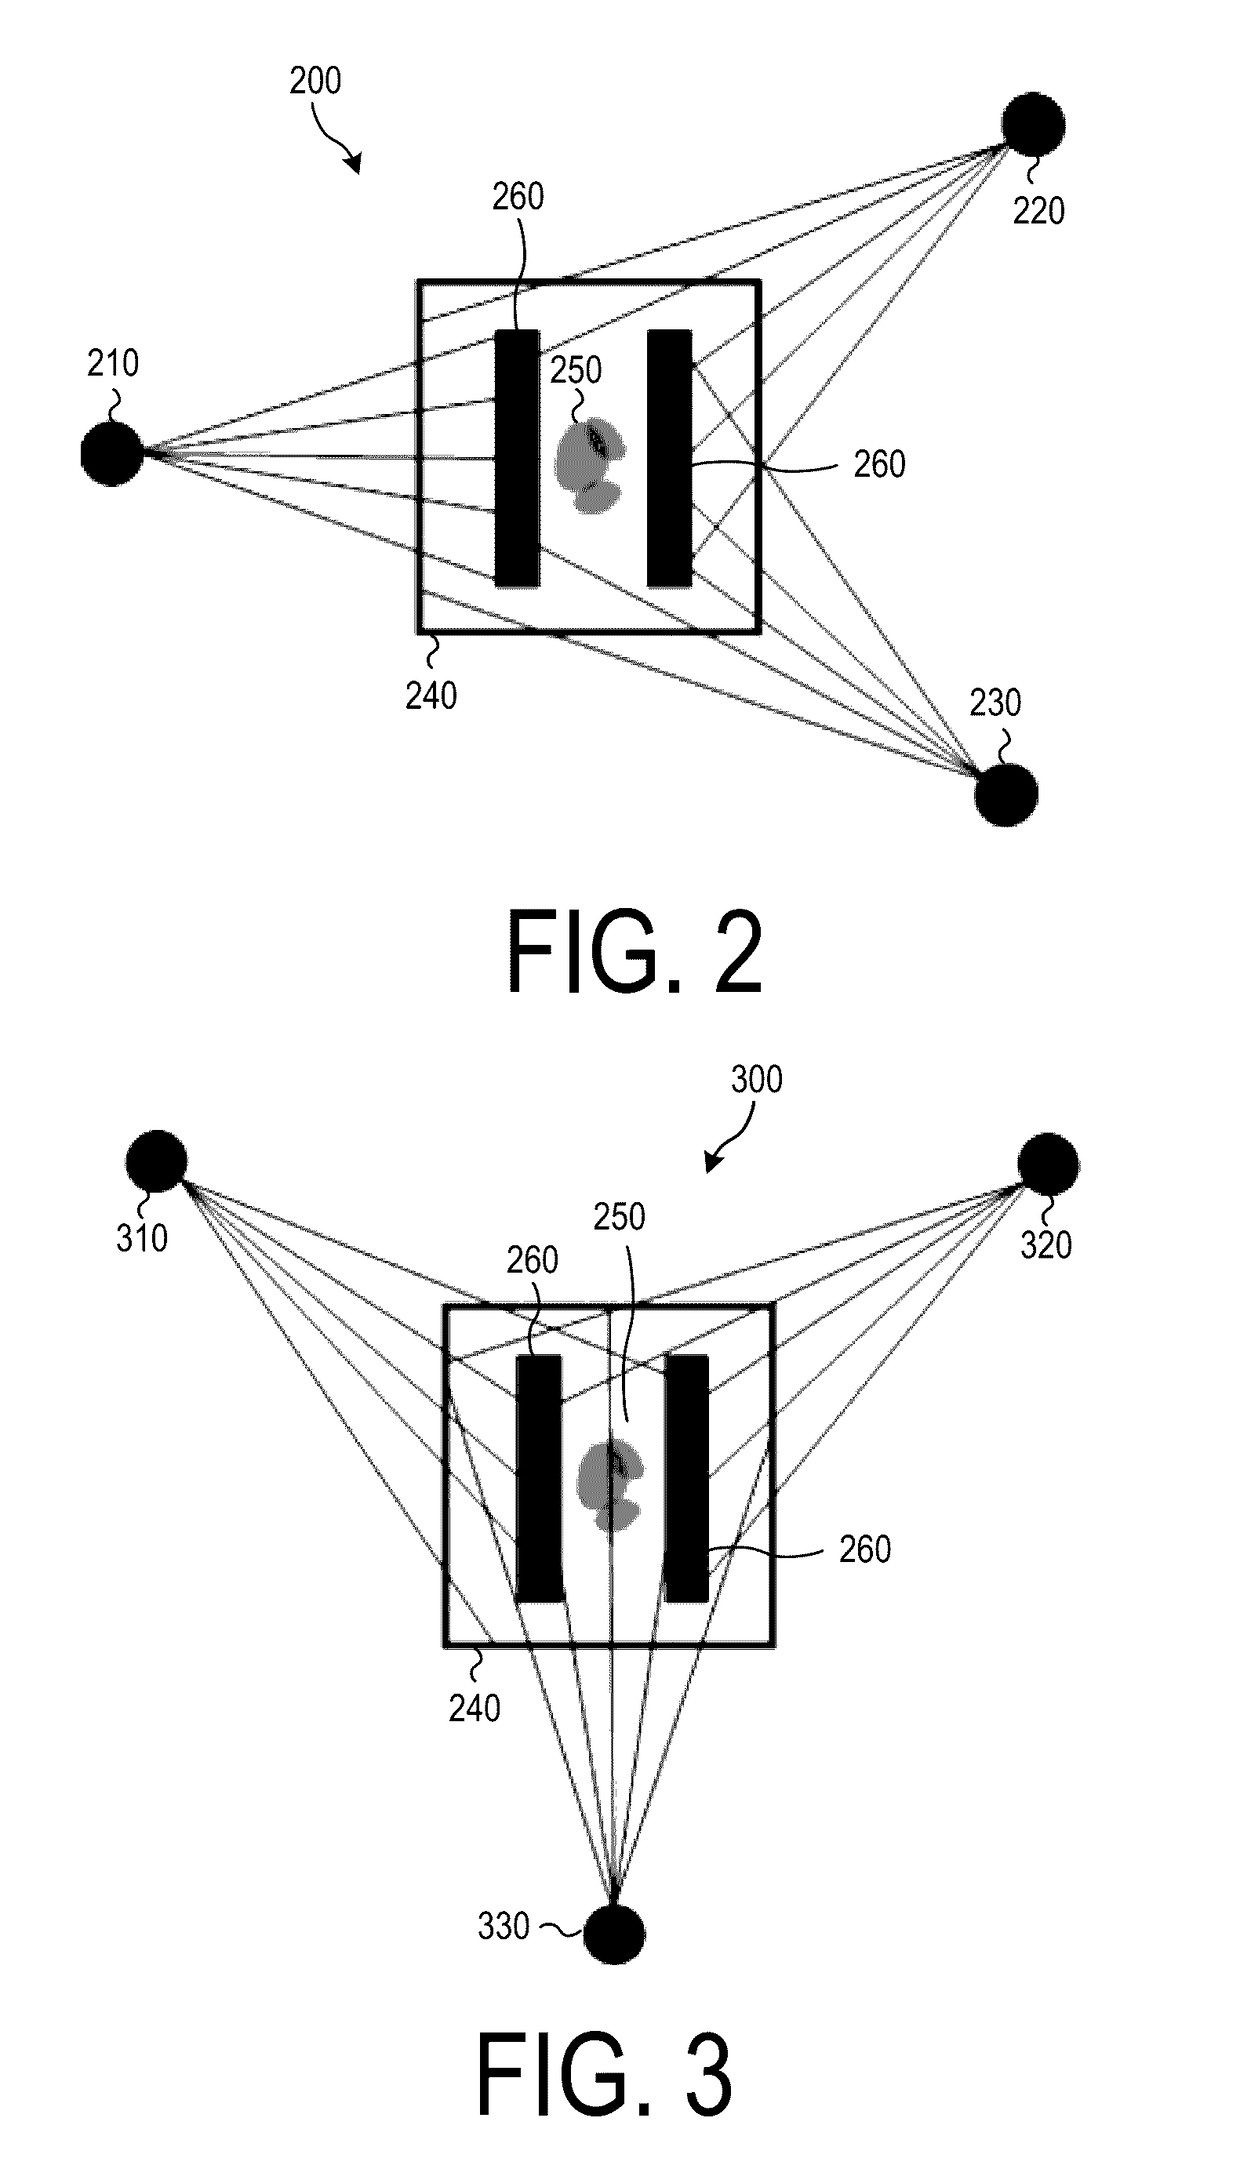
[0020]Gas sensing measurements from a plurality of viewing locations may be used to improve the determination of a gas leak source location or the location and extent of a gas plume.
[0023]Gas sensing measurements from a plurality of viewing locations may be used to improve the accuracy of the anomalous gas quantity determination.
[0026]The method may further comprise: performing measurements of a plume from more than one position to determine a location of the plume and to improve the leak rate estimate.
[0028]The closed-volume scan pattern measurement may be performed from more than one position to determine the plume location and improve the leak rate estimate.

Problems solved by technology

Recently, the cost of LiDAR and photogrammetric sensors for producing high-quality 3D spatial data have reached a point where the application and prevalence of 3D data has become widespread.

Method used


Image

  • Gas-mapping 3D imager measurement techniques and method of data processing
  • Gas-mapping 3D imager measurement techniques and method of data processing
  • Gas-mapping 3D imager measurement techniques and method of data processing

Examples


Embodiment Construction

[0049]The current disclosure is provided to further explain in an enabling fashion the best modes of performing one or more embodiments of the present invention. The disclosure is further offered to enhance an understanding and appreciation for the inventive principles and advantages thereof, rather than to limit in any manner the invention. The invention is defined solely by the appended claims including any amendments made during the pendency of this application and all equivalents of those claims as issued.

[0050]It is further understood that the use of relational terms such as first and second, and the like, if any, are used solely to distinguish one from another entity, item, or action without necessarily requiring or implying any actual such relationship or order between such entities, items or actions. It is noted that some embodiments may include a plurality of processes or steps, which can be performed in any order, unless expressly and necessarily limited to a particular or...


PUM

PropertyMeasurementUnit
distancesaaaaaaaaaa
timeaaaaaaaaaa
concentrationaaaaaaaaaa

Abstract

Measurement approaches and data analysis methods are disclosed for combining 3D topographic data with spatially-registered gas concentration data to increase the efficiency of gas monitoring and leak detection tasks. Here, the metric for efficiency is defined as reducing the measurement time required to achieve the detection, or non-detection, of a gas leak with a desired confidence level. Methods are presented for localizing and quantifying detected gas leaks. Particular attention is paid to the combination of 3D spatial data with path-integrated gas concentration measurements acquired using remote gas sensing technologies, as this data can be used to determine the path-averaged gas concentration between the sensor and points in the measurement scene. Path-averaged gas concentration data is useful for finding and quantifying localized regions of elevated (or anomalous) gas concentration making it ideal for a variety of applications including: oil and gas pipeline monitoring, facility leak and emissions monitoring, and environmental monitoring.

Description

CROSS REFERENCE TO RELATED APPLICATIONS[0001]This application claims the benefit of provisional U.S. application Ser. No. 62 / 237,992, filed Oct. 6, 2015, the contents of which are incorporated herein by reference.FIELD OF THE INVENTION[0002]The present invention generally relates to the application of 3D spatial data and gas concentration data to perform gas leak detection and monitoring.BACKGROUND OF THE INVENTION[0003]Improved gas detection and monitoring technologies are needed for a variety of emerging applications including:[0004](1) leak detection and quantification for oil and gas and chemical processing infrastructure,[0005](2) emissions monitoring from landfill and waste treatment facilities,[0006](3) monitoring and verification for carbon sequestration, and[0007](4) environmental terrestrial monitoring to better understand the carbon cycle.[0008]Sensor solutions to meet the needs of emerging applications must provide cost effective, large-area, high-sensitivity, and quanti...

Claims


Application Information

Patent Timeline
Patent Type & Authority Applications(United States)
IPC IPC(8): G01M3/28G06K9/00G01N21/53G01M3/38G01B21/20G01P5/00
CPCG01M3/28G01B21/20G06K9/00201G01N21/53G01M3/38G01P5/00G01C15/00G01N21/39G01N2021/1793G01N2021/1795G06V20/64
Inventor THORPE, MICHAELKREITINGER, AARONCROUCH, STEPHEN
Owner BRIDGER PHOTONICS
Why Eureka
Try Eureka