Method and System for Extraction of Noise Parameters of Nonlinear Devices

a nonlinear device and noise parameter technology, applied in the direction of demodulation, transmission monitoring, electrical equipment, etc., can solve the problems of reducing the sensitivity of the signal, the difficulty of signal detection, and the poor noise figures of the mixer, so as to reduce the noise factor of the mixer

Active Publication Date: 2017-10-26
UTI LLP
View PDF0 Cites 12 Cited by
  • Summary
  • Abstract
  • Description
  • Claims
  • Application Information

AI Technical Summary

Benefits of technology

[0009]The benefit of using this method is that it allows for the measurement of the mixer noise parameters and thus the noise correlation coefficients that fully characterize the noise behavior of a given device. Representing the mixer noise behavior in terms of noise parameters, instead of noise-correlation coefficients, is beneficial as it directly relates mixer NF to the output impedance of the circuit preceding the mixer and thus permits proper design of a matching network located between the two circuits.
[0010]Noise parameters have the advantage of being intuitive as they explicitly define the optimal matching conditions at each HSB of a device to minimize its noise factor. The proposed mixer noise model permits treating a mixer as a “black box” component. This model becomes more relevant when the IF frequency is large and thus the signal-source impedance experiences significant variation from radio frequency (RF) to IM frequency.

Problems solved by technology

Noise figures of mixers are generally poor due to noise from HSB frequencies being converted to the output IF.
This makes signal detection more difficult.
In addition, noise at the output of non-linear circuits, such as power amplifiers, couples to inputs of nearby receivers thereby reducing their sensitivity.
These methods do not fully characterize the noise contribution of HSBs, and in particular the image frequency (IM) band, to the overall mixer noise figure and do not fully model the sensitivity to mismatch between the optimum admittance (or equivalent impedance or reflection coefficient) and the actual implemented admittance at the HBS frequencies.
Thus, the noise model is not complete as effects of all impedance terminations on NF are not characterized.
These methods are ideal for the computation of mixer noise correlation coefficients in a simulated environment; however, no method exists to measure the corresponding mixer noise parameters or noise correlation coefficients for each port.

Method used


Image

  • Method and System for Extraction of Noise Parameters of Nonlinear Devices
  • Method and System for Extraction of Noise Parameters of Nonlinear Devices
  • Method and System for Extraction of Noise Parameters of Nonlinear Devices

Examples


example 1

Mixer Noise Simulation

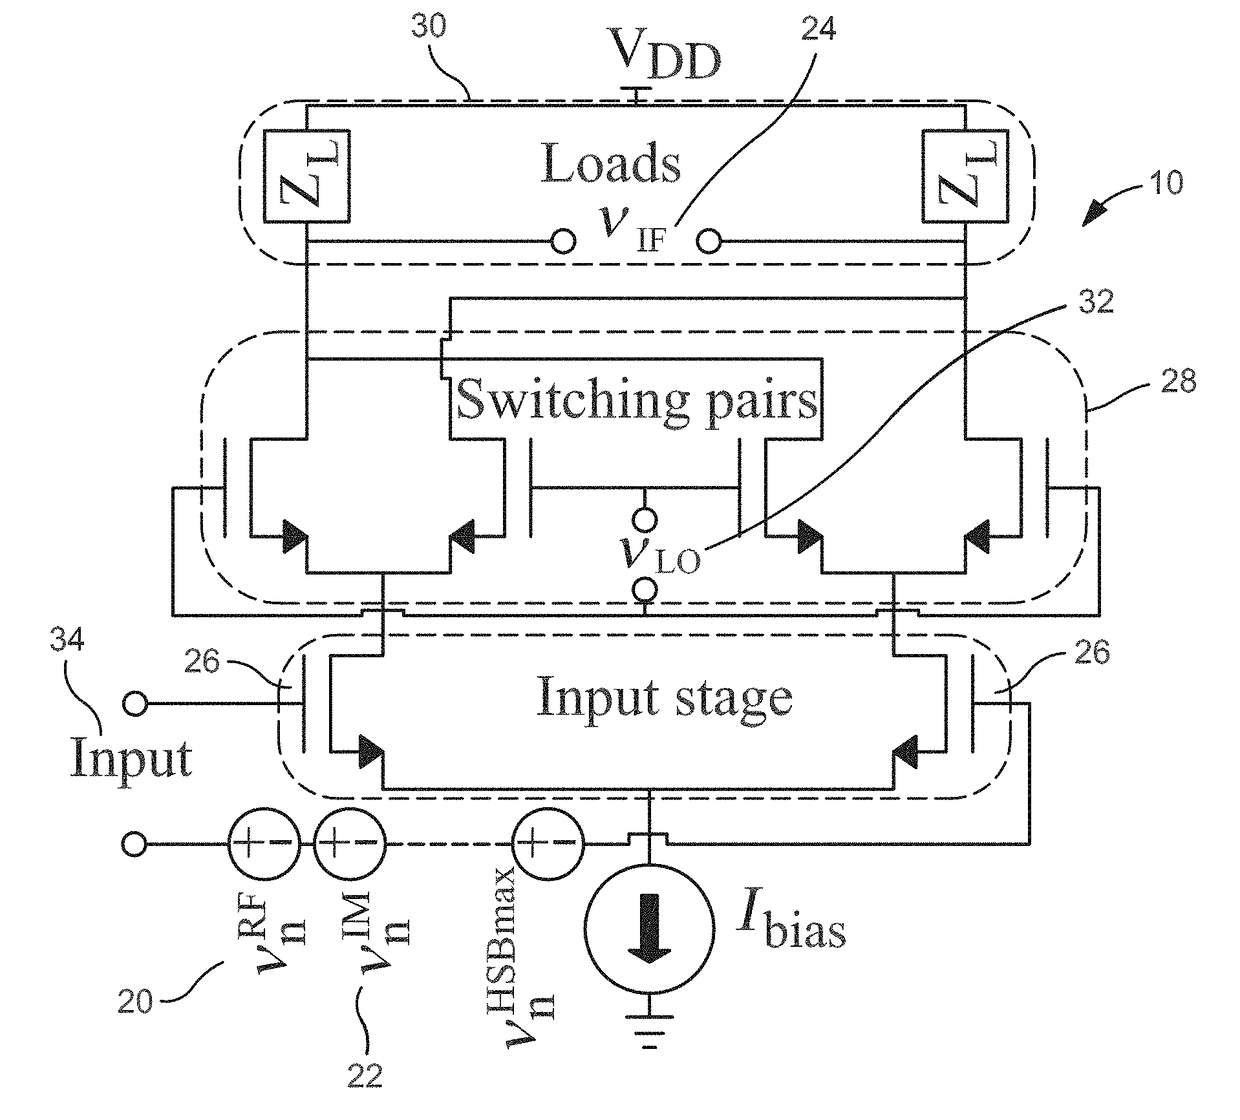
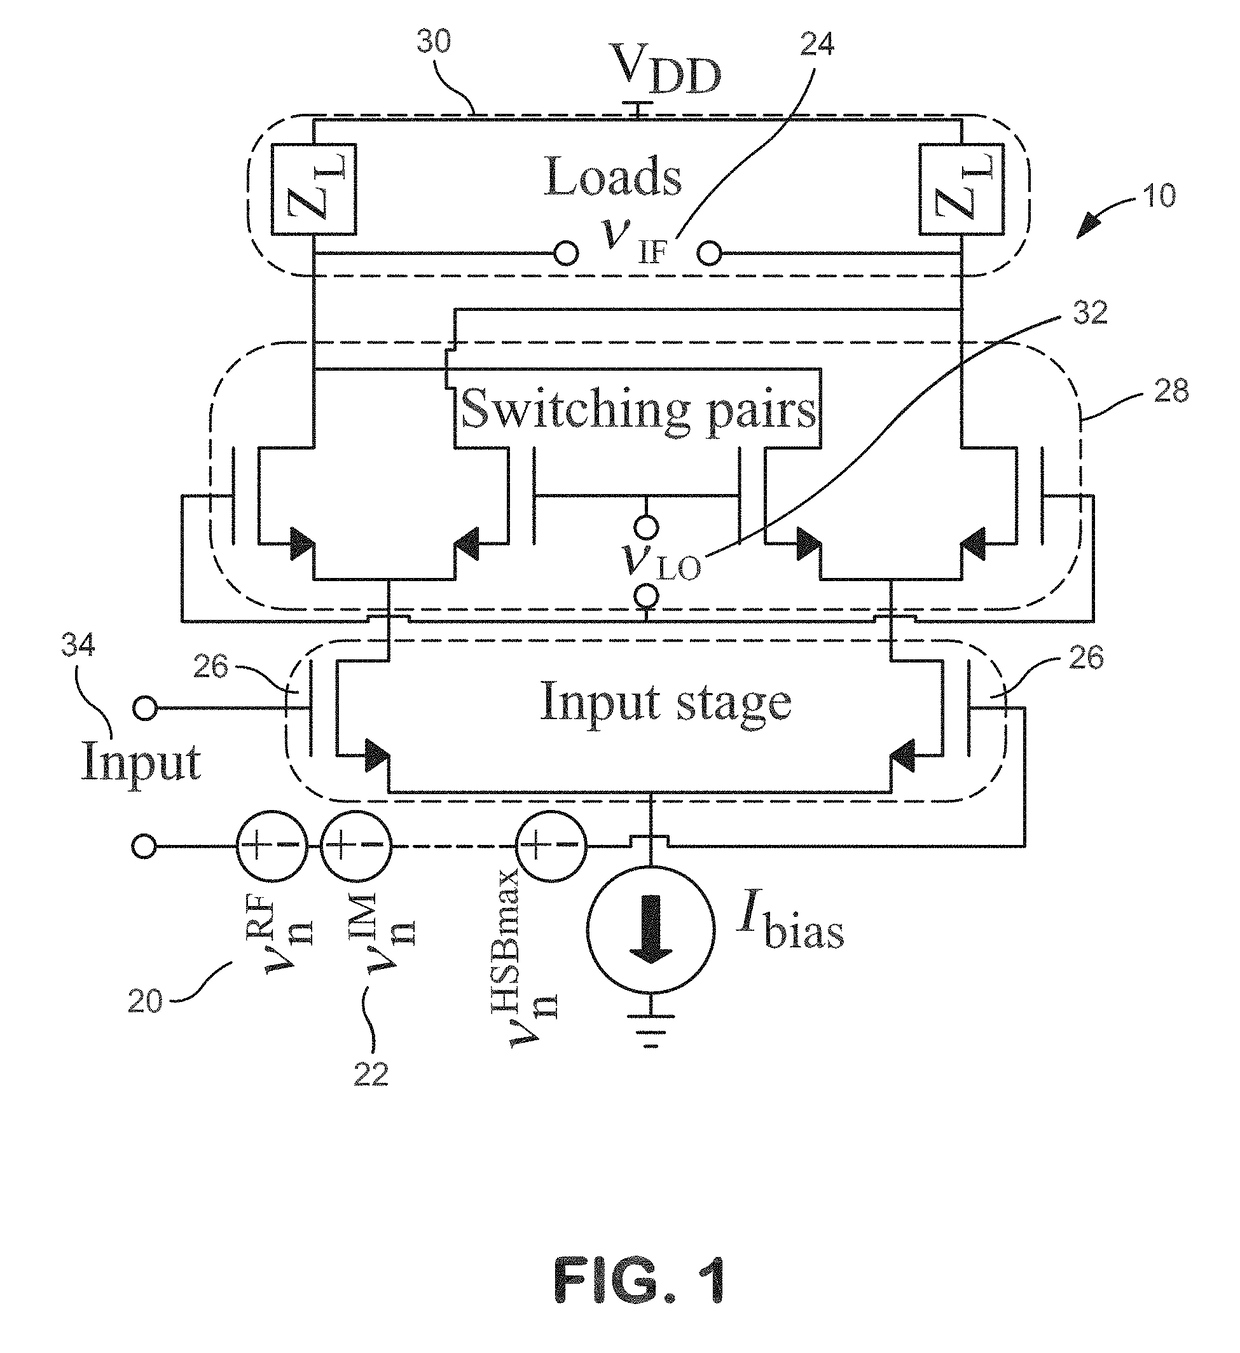
[0076]The purpose the following simulations is to determine whether the noise parameters proposed in Equation 7 can be measured using the procedure in described herein (see FIG. 5). A Gilbert cell mixer was designed in IBM 0.13-μm CMOS as shown in FIG. 1. The mixer had an LO of 2.4 GHz, RF of 1.9 GHz, and an IF of 500 MHz. The RF port and IF port were terminated with ideal baluns for single-ended simulations. A harmonic balance simulation of the entire measurement procedure was carried out in Agilent's Advanced Design System (ADS). This harmonic balance simulation considers sources of noise of each component in FIG. 5, and treats the mixer in FIG. 1 as a “black box.” The particular design in FIG. 1 is provided as an example so that the noise behavior of the DUT used to test the measurement setup could be reproduced.

[0077]Table I displays values of the “measured” VC-parameters, receiver properties, and noise source properties. Since the device is an active mixer...

example 2

Experimental Measurements

[0084]Measurements of noise parameters of two commercial Gilbert cell mixers, Analog Devices ADL5801 and Linear Technology LTC5593, are discussed in this example.

A. Experimental Setup

[0085]S-parameter measurements were performed with a PNA-5242A VNA and an N4691-60004 calibration kit. All S-parameters were averaged 32 times. The VC-parameters were measured with the same VNA utilizing the frequency offset and vector-mixer / converter (VMC) measurement options 080 and 083. The vector conversion parameter measurement set up included a Reference Mixer (mini Circuits ZX05-153LH+) and a 850-MHZ lowpass filter, a Calibration Mixer (mini Circuits ZX05-153LH+) and a 850-MHZ lowpass filter, a DUT (Linear Technology LTC5593), and DUT (Analog Devices ADL5801). These allowed for vector and scalar calibrated frequency converter measurements [22]-[24]. Option 083 suggests that VMC measurements be performed on devices with high isolation (>20dB) [23], which is appropriate for...

example 3

Comparative Example

[0097]A mixer measurement procedure was reported in L. D'Addario, “Noise parameters of SIS mixers,” IEEE Transactions on Microwave Theory and Techniques, vol. 36, no. 7, pp. 1196-1206, 1988, which is incorporated by reference herein in its entirety for comparison. The procedure herein is compared to this reported procedure. However, the approach in D'Addario, 1988 was not as complete, which does not allow for a direct comparison. In addition, some important information, such as signal-source impedances for the IM sideband that would be needed for a direct comparison, was not reported in the reference. While D'Addario does not solve for all HSB noise parameters independently, the work in this reference serves as a proof of concept for the proposed measurement system, as it demonstrates that a set of noise parameters exists for each HSB.

[0098]Analysis of FIGS. 1(c) and (d) from Addario shows the similarities and differences between our measurement procedures. The pr...


PUM


Abstract

Noise parameters are used to characterize noise performance of linear devices, such as amplifiers. Such noise parameters have not been used for frequency conversion devices, such as mixers. Direct measurements of single-side-band noise figures are accurately represented by the measured noise parameters, which fully characterize the noise figure of the mixers for all harmonic impedance loading conditions. Each harmonic side band of frequencies contributing noise to the mixer output is associated with a set of noise parameters. A measurement method for extracting the noise parameters is described.

Description

CROSS-REFERENCE TO RELATED APPLICATION[0001]This application claims the benefit of U.S. provisional application 62 / 326,458, filed Apr. 22, 2016 and U.S. provisional application 62 / 376,281, filed Aug. 17, 2016. Each of which is incorporated by reference herein in its entirety.BACKGROUND OF THE INVENTION[0002]A mixer or frequency mixer or frequency conversion device is an electrical circuit that creates new frequencies from frequencies of signals applied to it. In its most common application, two signals at frequencies are applied to a mixer, and it produces new signals as the sum or difference of the original frequencies. Other frequency components may also be produced in a practical frequency mixer. Mixers are widely used to shift signals from one frequency range to another, but also as a product detector, modulator, phase detector or frequency multiplier. Mixers can be coupled with a filter to either up-convert or down-convert an input signal frequency, but in receiver systems they...

Claims


Application Information

Patent Timeline
Patent Type & Authority Applications(United States)
IPC IPC(8): H04B1/10H04B17/345
CPCH04B17/345H04B1/10H03D7/1441H03D7/1458
Inventor BELOSTOTSKI, LEOHIMMELFARB, MICHAEL
Owner UTI LLP
Why Eureka
Try Eureka