Mass Spectrometry Data Analysis Method

Active Publication Date: 2018-01-18
JEOL LTD
View PDF0 Cites 9 Cited by
  • Summary
  • Abstract
  • Description
  • Claims
  • Application Information

AI Technical Summary

Benefits of technology

[0034]According to the mass spectrometry data analysis method of the present invention as described above, the degree of polymerization of each repeat unit can be plotted equidistantly, so the distribution of the degree of polymerization can be clearly comprehended, regardless of whether or not the repeat units are simila

Problems solved by technology

In a case where multiple terminal structures exist, or in a copolymer having two or more types of repeat units, the mass spectrum becomes complicated, and it is difficult to obtain informat

Method used


Image

  • Mass Spectrometry Data Analysis Method
  • Mass Spectrometry Data Analysis Method
  • Mass Spectrometry Data Analysis Method

Examples


Example

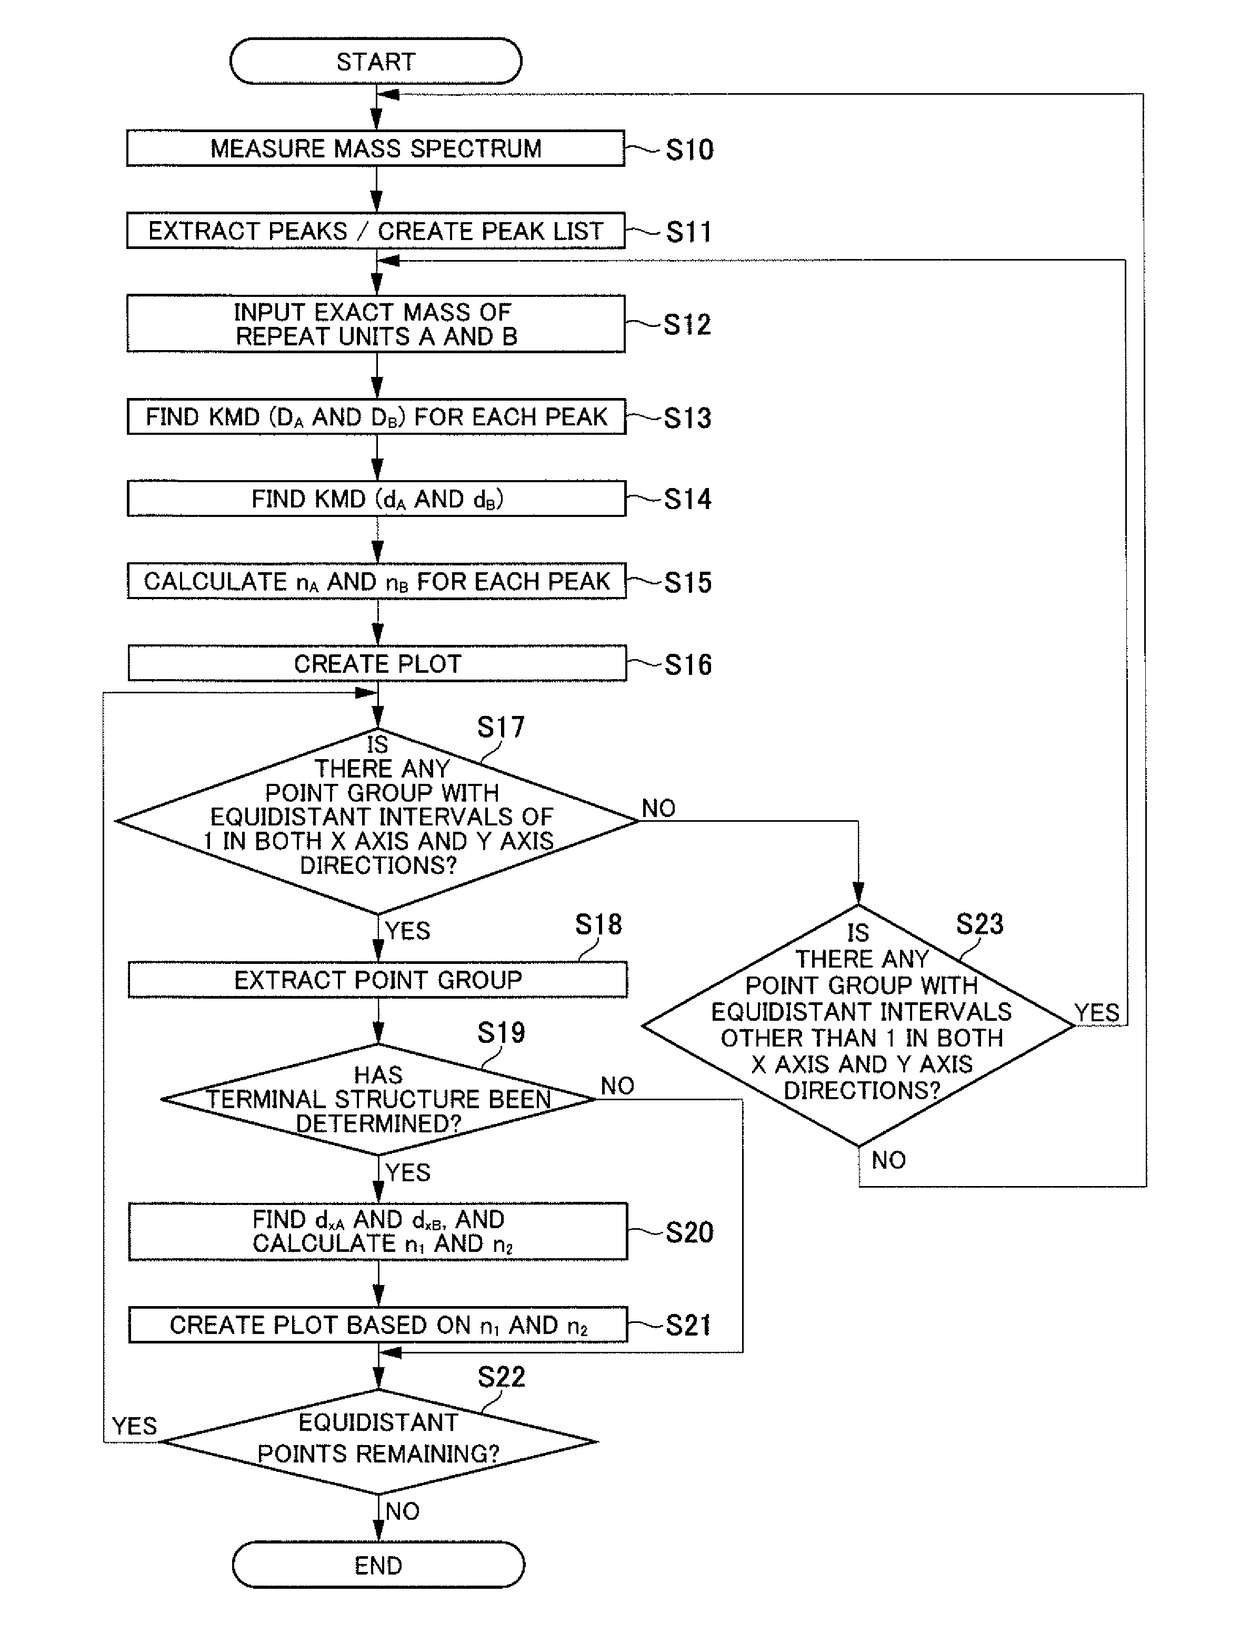
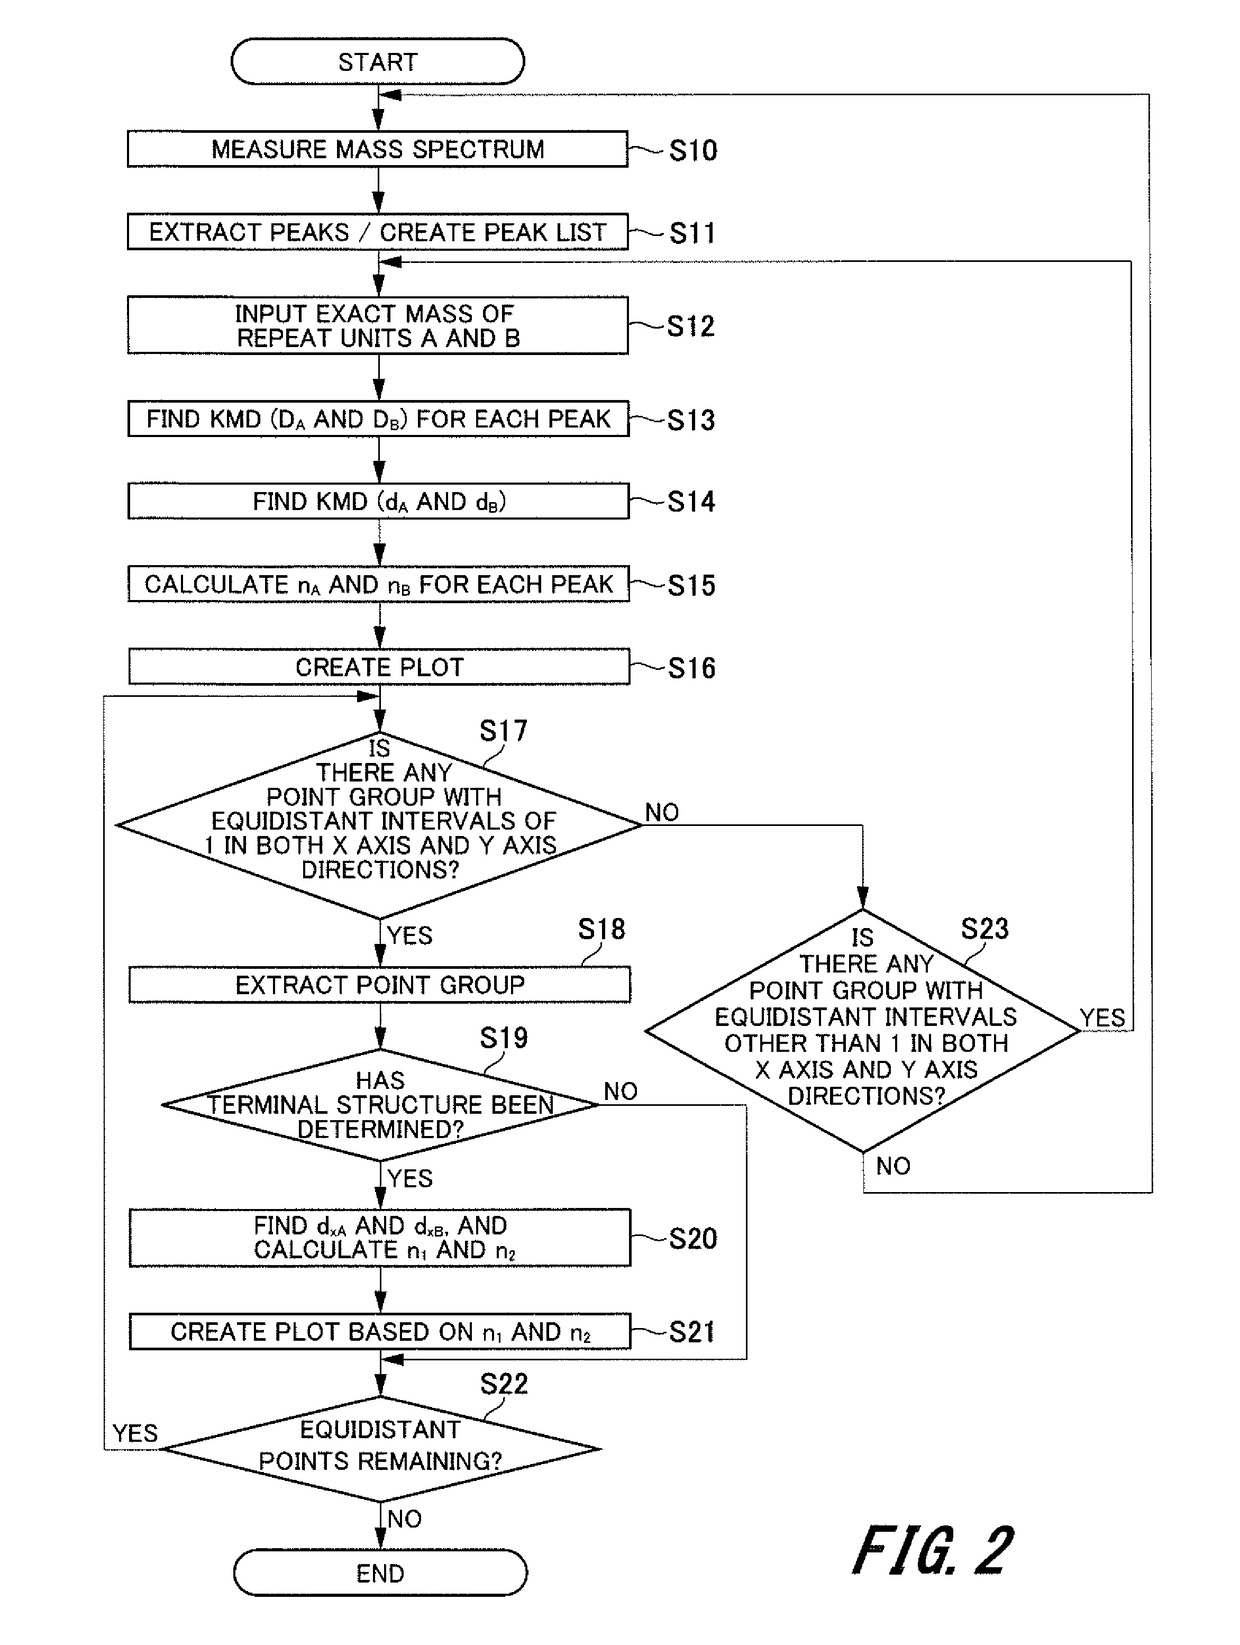
[0050]A preferred embodiment of the present invention will be described in detail below with reference to the drawings. It should be noted that the embodiment described below does not unreasonably restrict the contents of the present invention laid forth in the Claims. Further, not all configurations described below are necessarily essential components of the present invention.

1. Mass Spectroscope

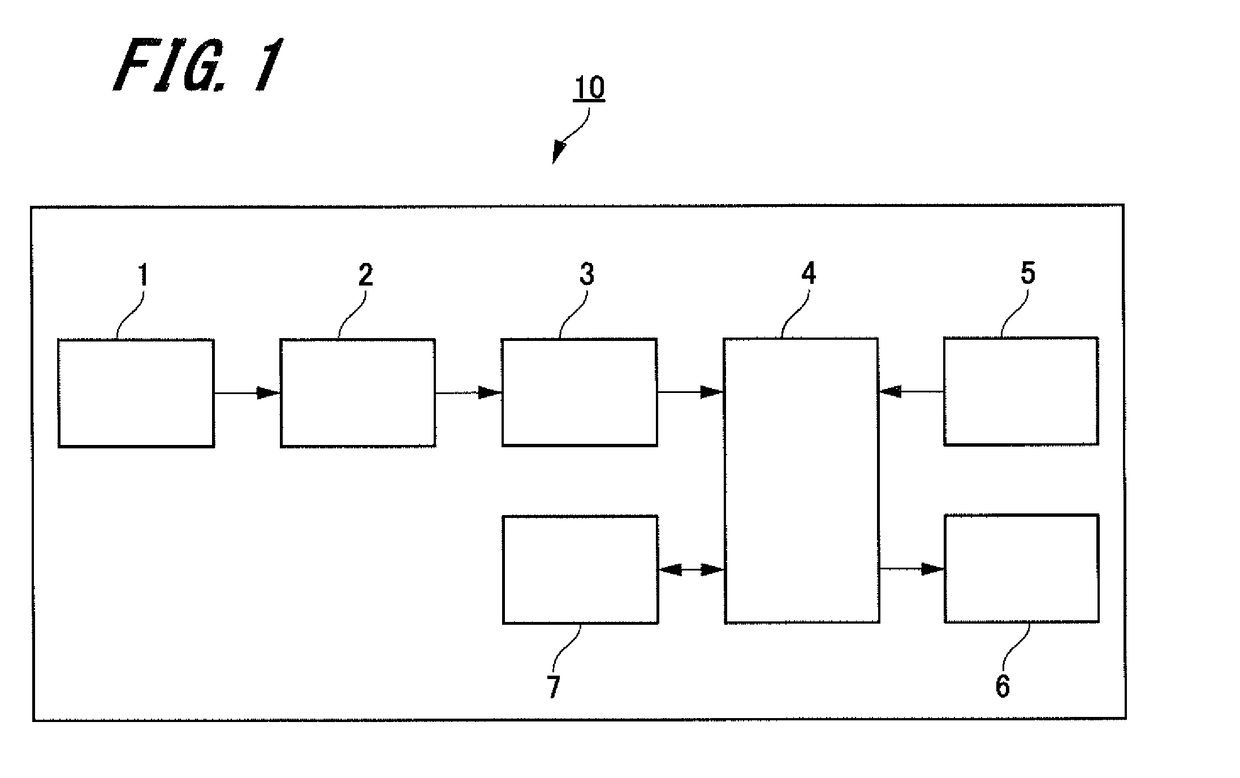
[0051]FIG. 1 is a schematic configuration diagram (block diagram) of a mass spectroscope for carrying out the mass spectrometry data analysis method according to the present invention.

[0052]The mass spectroscope 10 illustrated in FIG. 1 includes an ion source 1, a mass spectrometry unit 2, a detection unit 3, a processing unit 4, an operating unit 5, a display unit 6, and a storage unit 7.

[0053]The ion source 1 ionizes a specimen according to a predetermined method, and the generated specimen ions are introduced to the mass spectrometry unit 2.

[0054]The mass spectrometry unit 2 separates th...


PUM


Abstract

A mass spectrometry data analysis method for analyzing a specimen having a composition where two different reference chemical structures A and B that are each repeated, includes acquiring exact mass information of each peak in a mass spectrum of the specimen by mass spectrometry, acquiring Kendrick mass defect information DA and DB where a decimal number part has been extracted from mass information obtained by performing Kendrick mass conversion computation processing on exact mass information of each peak, acquiring mass defect information dB and dA where a decimal number part has been extracted from mass information of B based on A and A based on B of the reference chemical structures A and B, calculating
nA=DB/dA,nB=DA/dB
regarding DA, DB, dA, and dB, and obtaining degree-of-polymerization information nA and nB, and displaying plots corresponding to each peak on two-dimensional coordinates where nA and nB are axes.

Description

BACKGROUND OF THE INVENTION1. Field of the Invention[0001]The present invention relates to a mass spectrometry data analysis method.2. Description of the Related Art[0002]In mass spectrometry, a polymer that has only one type of repeat unit exhibits only one type of peak interval in a mass spectrum where the horizontal axis is mass-to-charge ratio m / z and the vertical axis is ionic intensity, as illustrated in FIG. 6A. Accordingly, the dispersion state of the degree of polymerization illustrated in FIG. 6B can be read relatively easily from the mass spectrum in FIG. 6A.[0003]Kendrick mass plot is one technique to visualize distribution information of a specimen having a repeat unit (e.g., see Anal. Chem., 2007, 79, p 4074-4082).[0004]In a Kendrick mass plot, a Kendrick mass defect (KMD) is found for each peak appearing in a mass spectrum, and each peak is plotted on coordinates where the horizontal axis is mass, and the vertical axis is the KMD. The KMD refers to the remainder obtai...

Claims


Application Information

Patent Timeline
IPC IPC(8): H01J49/00
CPCH01J49/0036
Inventor KUBO, AYUMI
Owner JEOL LTD
Why Eureka
Try Eureka