Cohort explorer for visualizing comprehensive sample relationships through multi-modal feature variations

a multi-modal feature and sample relationship technology, applied in the field of cohort explorer for visualizing comprehensive sample relationships through multi-modal feature variations, can solve problems such as difficulty in showing where a single patient is

Inactive Publication Date: 2018-11-15
KONINKLJIJKE PHILIPS NV
View PDF4 Cites 5 Cited by
  • Summary
  • Abstract
  • Description
  • Claims
  • Application Information

AI Technical Summary

Benefits of technology

[0004]Embodiments described herein provide an improved presentation for exploration and comparison of multi-modal features of cohort samples with patient-oriented omic data (genomic, transcriptomic, proteomic, epigenomic, etc.), and patient-oriented information on social, economic, environmental, scientific, engineering, or any other types of data. In particular, Embodiments described herein include a system and method that provide an interactive visualization tool for summarizing and presenting patient and cohort data. Further, embodiments described herein provide interactive access to underlying intergenic genomic information, methylation and gene / exon expression data, on a genic scale, and nucleotide sequence, amino acid sequence and methylation data, on a molecular scale.

Problems solved by technology

However, it is very difficult to show where a single patient is situated with respect to many parameters from clinical and genomic data and other data representative of the quality of life, where the patient data is sourced from a multitude of information sources in the clinical (e.g., Electronic Medical Record—EMR, and genomics information system) and personal life (e.g., quality of life inferred from quantified self-devices and social media) domains

Method used


Image

  • Cohort explorer for visualizing comprehensive sample relationships through multi-modal feature variations
  • Cohort explorer for visualizing comprehensive sample relationships through multi-modal feature variations
  • Cohort explorer for visualizing comprehensive sample relationships through multi-modal feature variations

Examples


Embodiment Construction

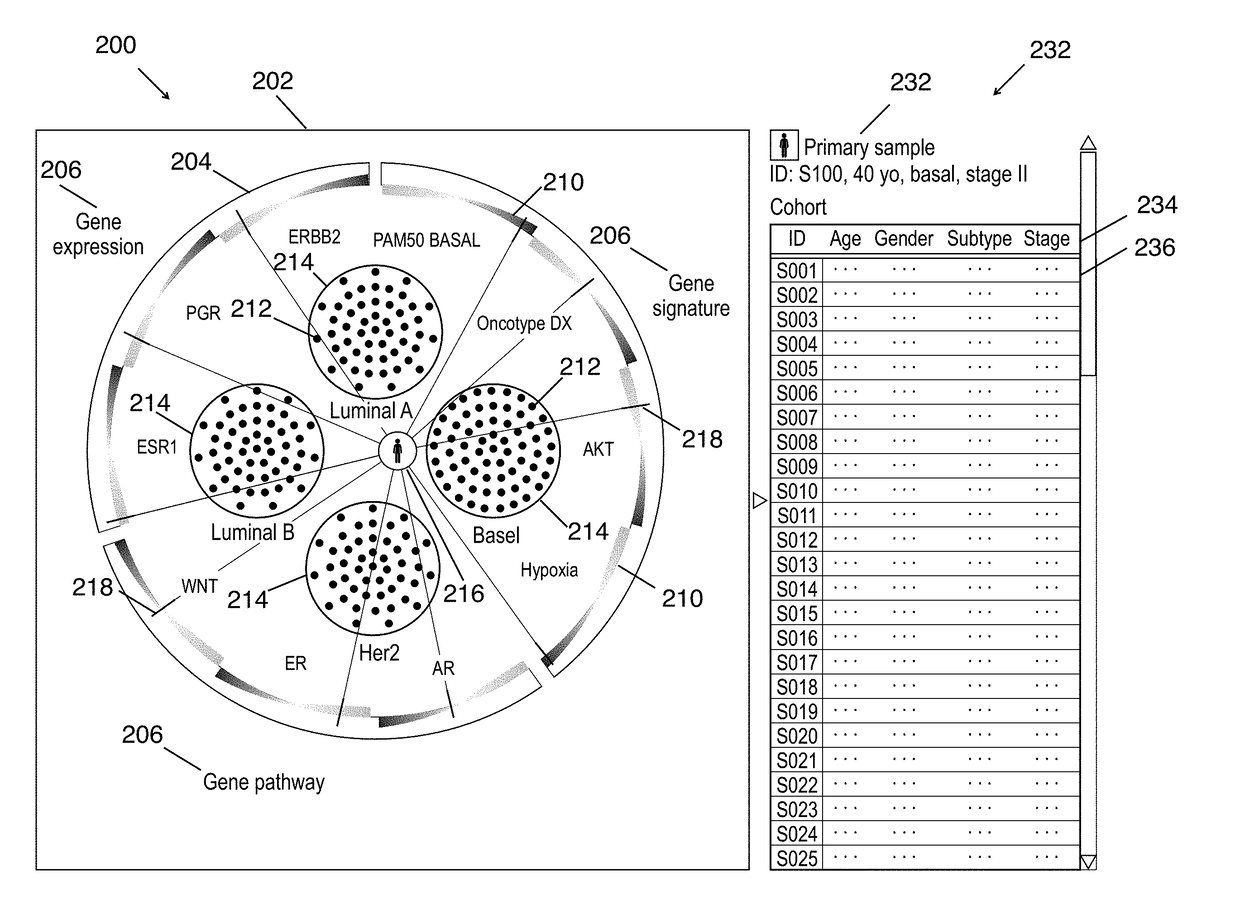
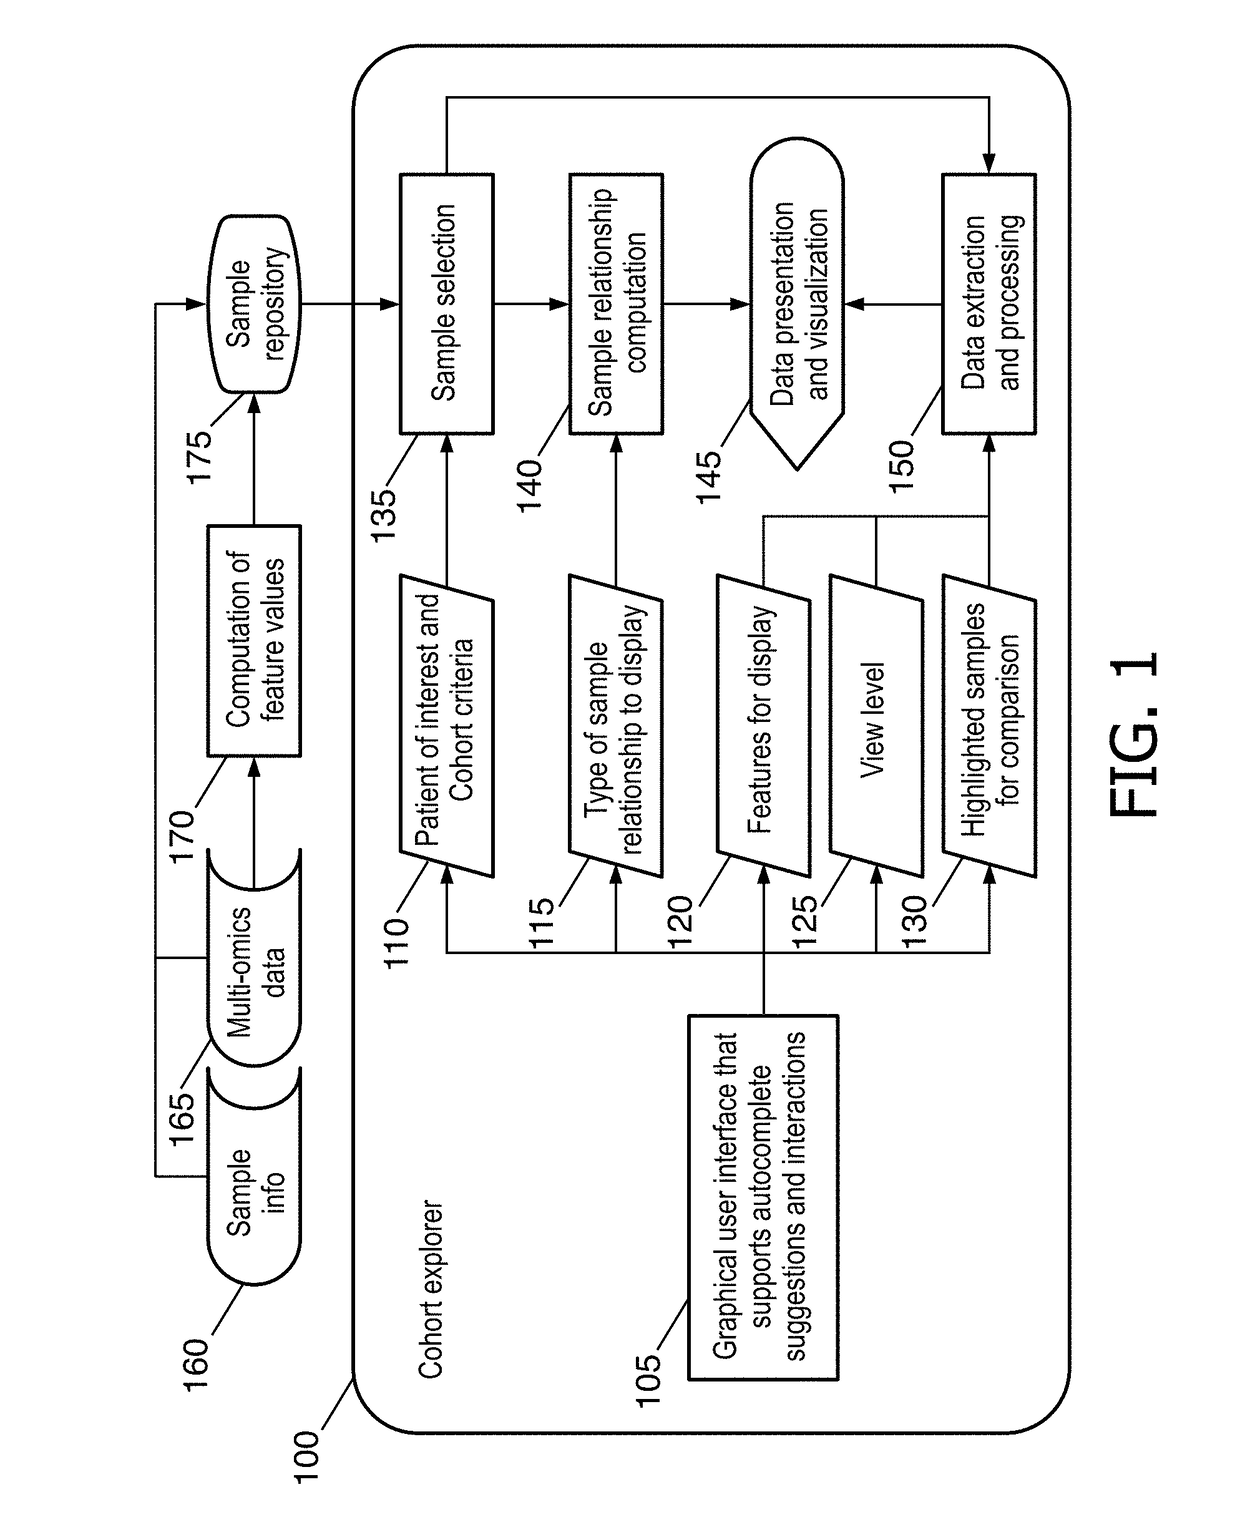
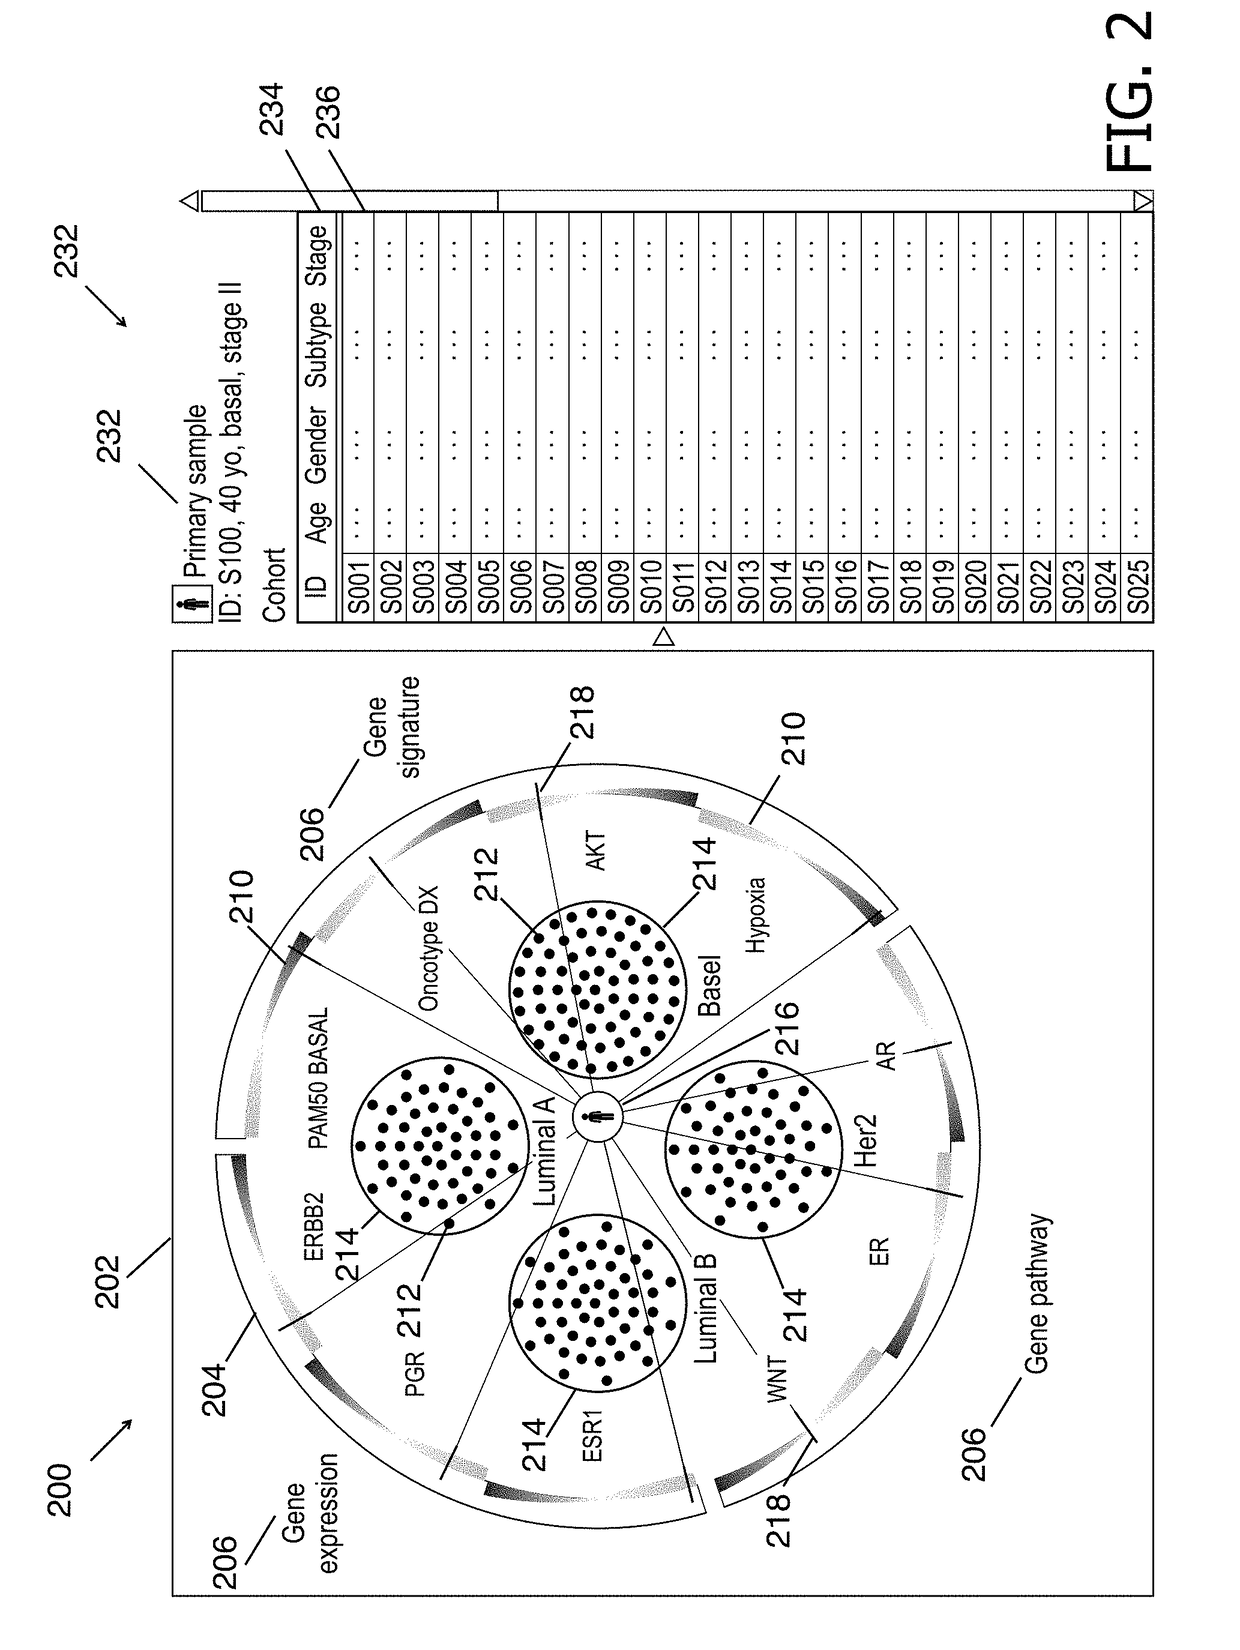
[0049]The embodiments described herein relate to a data-driven integrative visualization system and a method for visualization and exploration of the multi-modal features of a cohort of samples. Specifically, a method for providing an interactive computation and visualization front-end of a genomics platform for presenting the complex multiparametric and high dimensional, multi-omic data of a patient with respect to a cohort of samples, that assists the user in understanding the similarities and differences across individual or groups of samples, identify any correlation among different features and improve treatment planning and long-term patient care, is described. The method includes obtaining and inputting multi-omic data of a patient and / or cohorts, identifying multi-modal feature variations and their relationships, and displaying this information in an interactive format on a GUI, from which the user can access and view further information. The medical practitioner is able to ...


PUM


Abstract

A data-driven integrative visualization system and a method for visualization and exploration of the multi-modal features of a cohort of samples, is disclosed Specifically, a method for providing an interactive computation and visualization front-end of a genomics platform for presenting the complex multiparametric and high dimensional, multi-omic data of a patient with respect to a cohort of samples, that assists the user in understanding the similarities and differences across individual or groups of samples, identify correlation among different features and improve treatment planning and long term patient care, is described. The method may include obtaining and inputting multi-omic data of a patient and/or cohorts, identifying multi-modal feature variations and their relationships, and displaying this information in an interactive circular format on a GUI, from which the user can access further information. The system may provide an improved process of integrative analysis on a patient's multi-omic data for effective treatment planning.

Description

CROSS REFERENCE TO RELATED APPLICATIONS[0001]This application claims priority to U.S. Provisional Patent Application No. 62 / 504,112, filed on May 10, 2017, the entire disclosure of which is hereby incorporated herein for all purposes.TECHNOLOGICAL FIELD[0002]Various exemplary embodiments disclosed herein relate generally to a cohort explorer for visualizing comprehensive sample relationships through multi-modal feature variations.BACKGROUND[0003]Various visualization methods exist that present patient clinical data and lifestyle (quality of life) data which include results from a single modality measurement, for example a waterfall plot showing gene expression levels on a single gene, or tables in patient charts using EMR data. However, it is very difficult to show where a single patient is situated with respect to many parameters from clinical and genomic data and other data representative of the quality of life, where the patient data is sourced from a multitude of information sou...

Claims


Application Information

Patent Timeline
Patent Type & Authority Applications(United States)
IPC IPC(8): G16H10/60G16H15/00G06T11/20G16B40/30G16B45/00
CPCG16H10/60G16H15/00G06T11/206G06T2200/24G06T2210/41G06F3/04817G06F3/0482G16H50/70G16B40/00G16B45/00G16B40/30
Inventor CHEUNG, YEE HIMMAO, YONGDIMITROVA, NEVENKABANERJEE, NILANJANADE BONT, JOHANNA MARIARAIJMAKERS, JOZEF HIERONYMUS MARIAVOLYANSKYY, KOSTYANTYN
Owner KONINKLJIJKE PHILIPS NV
Why Eureka
Try Eureka