
Systems and Methods for Evaluating Contrast Sensitivity and Other Visual Metrics

a contrast sensitivity and visual metric technology, applied in the field of visual perception, can solve the problems of not addressing one of the fundamental restrictions of traditional psychophysical tasks, unrealistic time required to measure multiple thresholds with conventional psychophysical staircase procedures in clinical settings, and reducing the number of sweeps. , the effect of high predictive power

Active Publication Date: 2020-04-23
BURKE NEUROLOGICAL INST
View PDF0 Cites 9 Cited by
  • Summary
  • Abstract
  • Description
  • Claims
  • Application Information

AI Technical Summary

Benefits of technology

The present invention is a method for displaying stimuli to a participant in a research study, where the stimuli move in a predetermined path or avoid collisions with other stimuli. The value of evidence from target tracking is weighted based on the stimulus's movement pattern, and the eye tracker is adjusted in real time to improve the accuracy of gaze position data. An algorithm is also used to identify the most predictive sweeps in a population for future research sessions. These technical effects can improve the accuracy and efficiency of research studies by delivering relevant stimuli and reducing the number of sweeps needed for analysis.

Problems solved by technology

Unlike other measures of basic visual function, the CSF describes a continuum of sensitivity thresholds and is consequently more difficult to assess than one-dimensional measures such as visual acuity.
It can be constructed from a sequence of independent contrast thresholds computed at different spatial frequencies, but the time required to measure multiple thresholds with conventional psychophysical staircase procedures is unrealistic in clinical settings.
Simultaneous two-dimensional Bayesian approaches can estimate a participant's CSF in less than five minutes and can even be run on a portable device, but they do not address one of the fundamental restrictions of traditional psychophysical tasks: their reliance on extended periods of attention and volitional perceptual report.
The tasks can be tedious because they require the repeated presentation of visually uninteresting stimuli such as filtered noise patterns and sinusoidal gratings.
Adaptive procedures also naturally become more difficult as the threshold of an observer's ability is approached; by design, these tasks spend as much time as possible presenting stimuli at peri-threshold combinations of contrast and spatial frequency.
These procedures can be tolerated by healthy adults, particularly if they are offered incentives, but are not well tolerated by observers who are less willing or less able to engage with the test, such as children or individuals with brain injury.
This strategy, however, does not help individuals (of any age) who have difficulty sustaining attention, following task instructions, or communicating their responses to an experimenter.
Preferential looking paradigms such as Teller cards circumvent the need for verbal communication, but they are still highly dependent on the participant's attention span.
Electrophysiological measures such as visual evoked potentials are also constrained by attention, and require specialized training to administer, can be unpleasant for the participant, and have reduced sensitivity relative to behavioral report.
Other elements of this procedure, however, are likely to pose problems for many participants.
The procedure takes almost twenty minutes to complete, which is an unrealistic requirement for inattentive or cognitively impaired participants.
The time can be reduced by combining the procedure with an adaptive staircase, but it is unclear how well this would work, as their OKN matching algorithm has a false positive rate of 50% and the time-sensitive nature of the task's individual trials appear vulnerable to lapses in attention.

Method used


Image

  • Systems and Methods for Evaluating Contrast Sensitivity and Other Visual Metrics
  • Systems and Methods for Evaluating Contrast Sensitivity and Other Visual Metrics
  • Systems and Methods for Evaluating Contrast Sensitivity and Other Visual Metrics

Examples


Embodiment Construction

[0065]The invention may be understood more readily by reference to the following detailed descriptions of embodiments of the invention. However, techniques, systems, and operating structures in accordance with the invention may be embodied in a wide variety of forms and modes, some of which may be quite different from those in the disclosed embodiments. Also, the features and elements disclosed herein may be combined to form various combinations without exclusivity, unless expressly stated otherwise. Consequently, the specific structural and functional details disclosed herein are merely representative. Yet, in that regard, they are deemed to afford the best embodiment for purposes of disclosure and to provide a basis for the claims herein, which define the scope of the invention. It must be noted that, as used in the specification and the appended claims, the singular forms “a”, “an”, and “the” include plural referents unless the context clearly indicates otherwise.

[0066]Where a ra...


PUM


Abstract

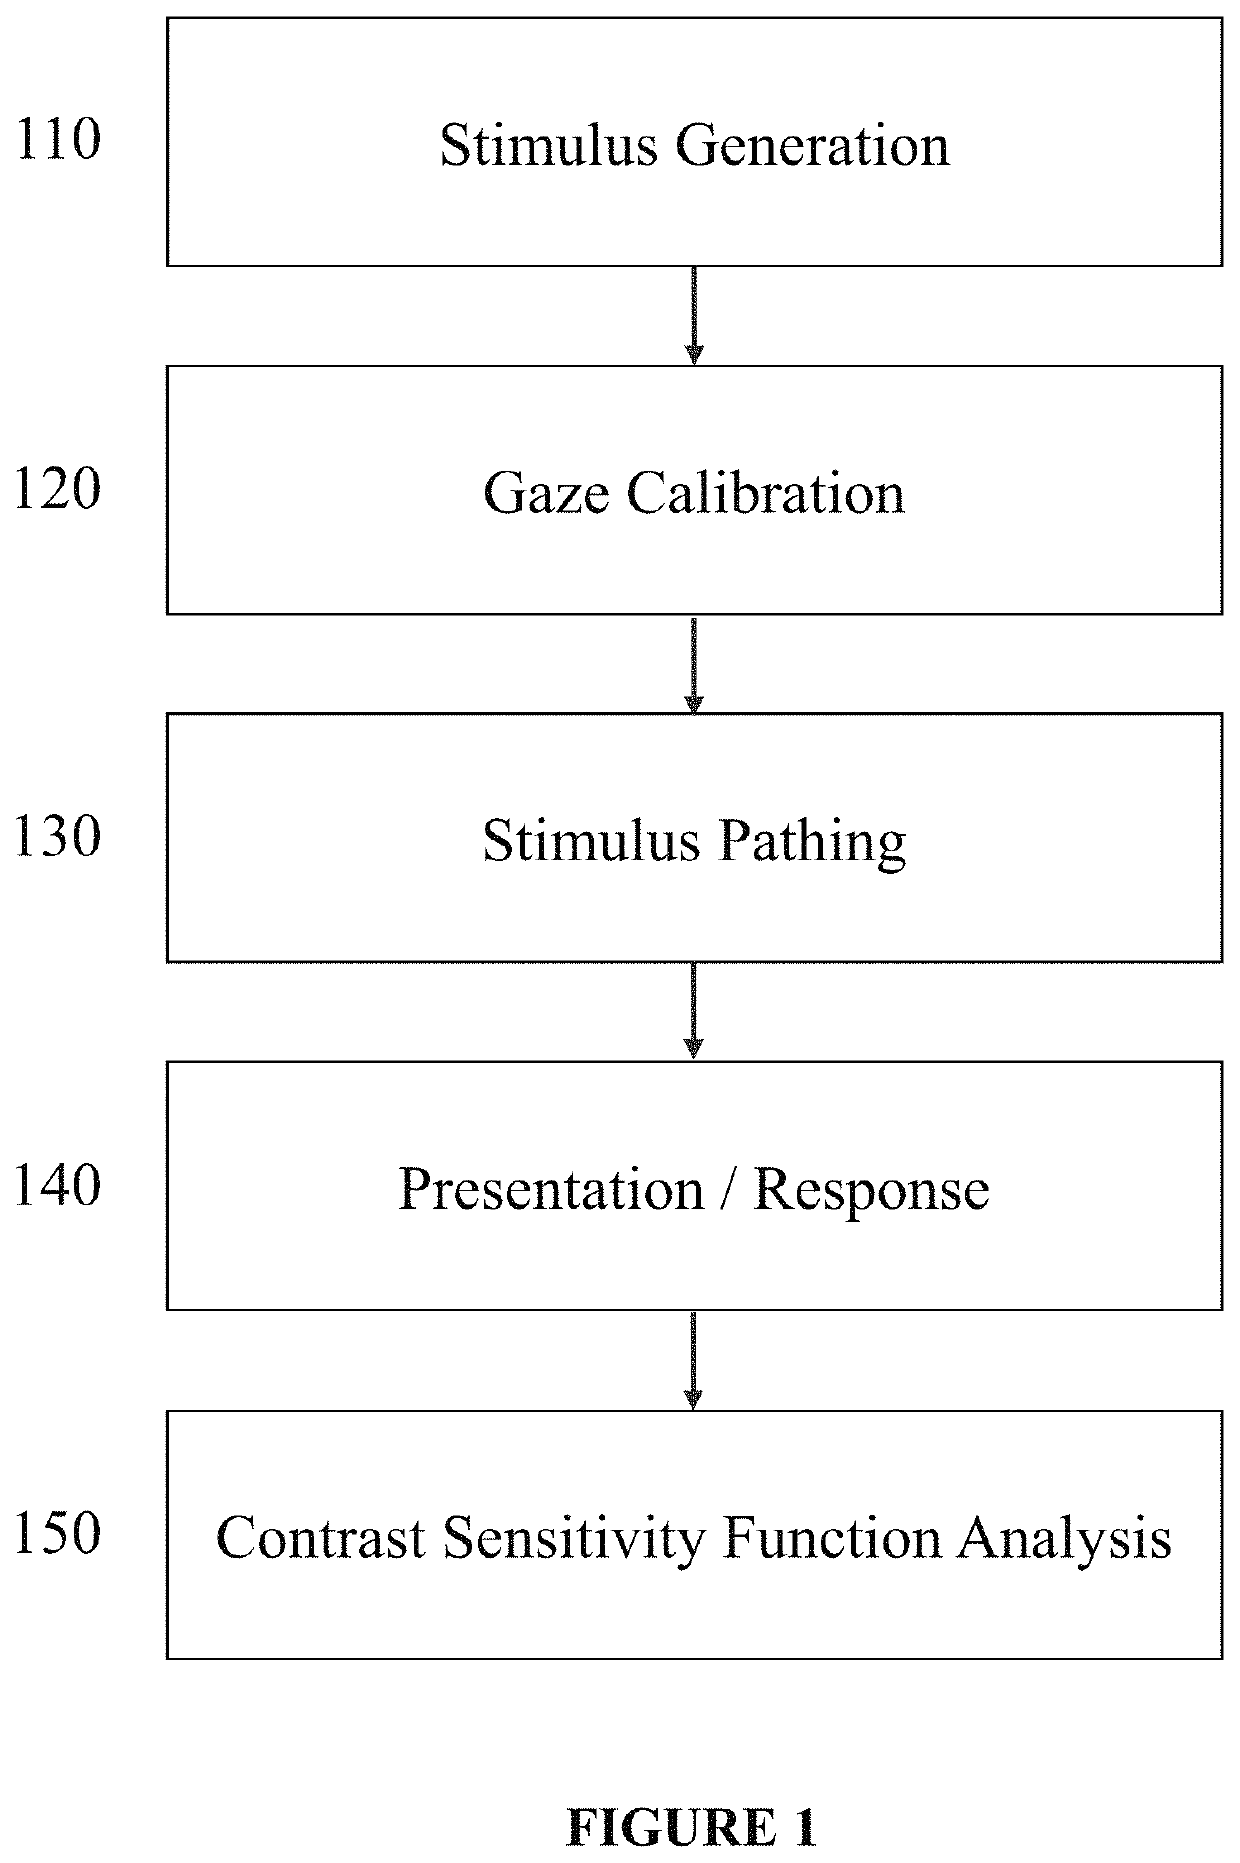
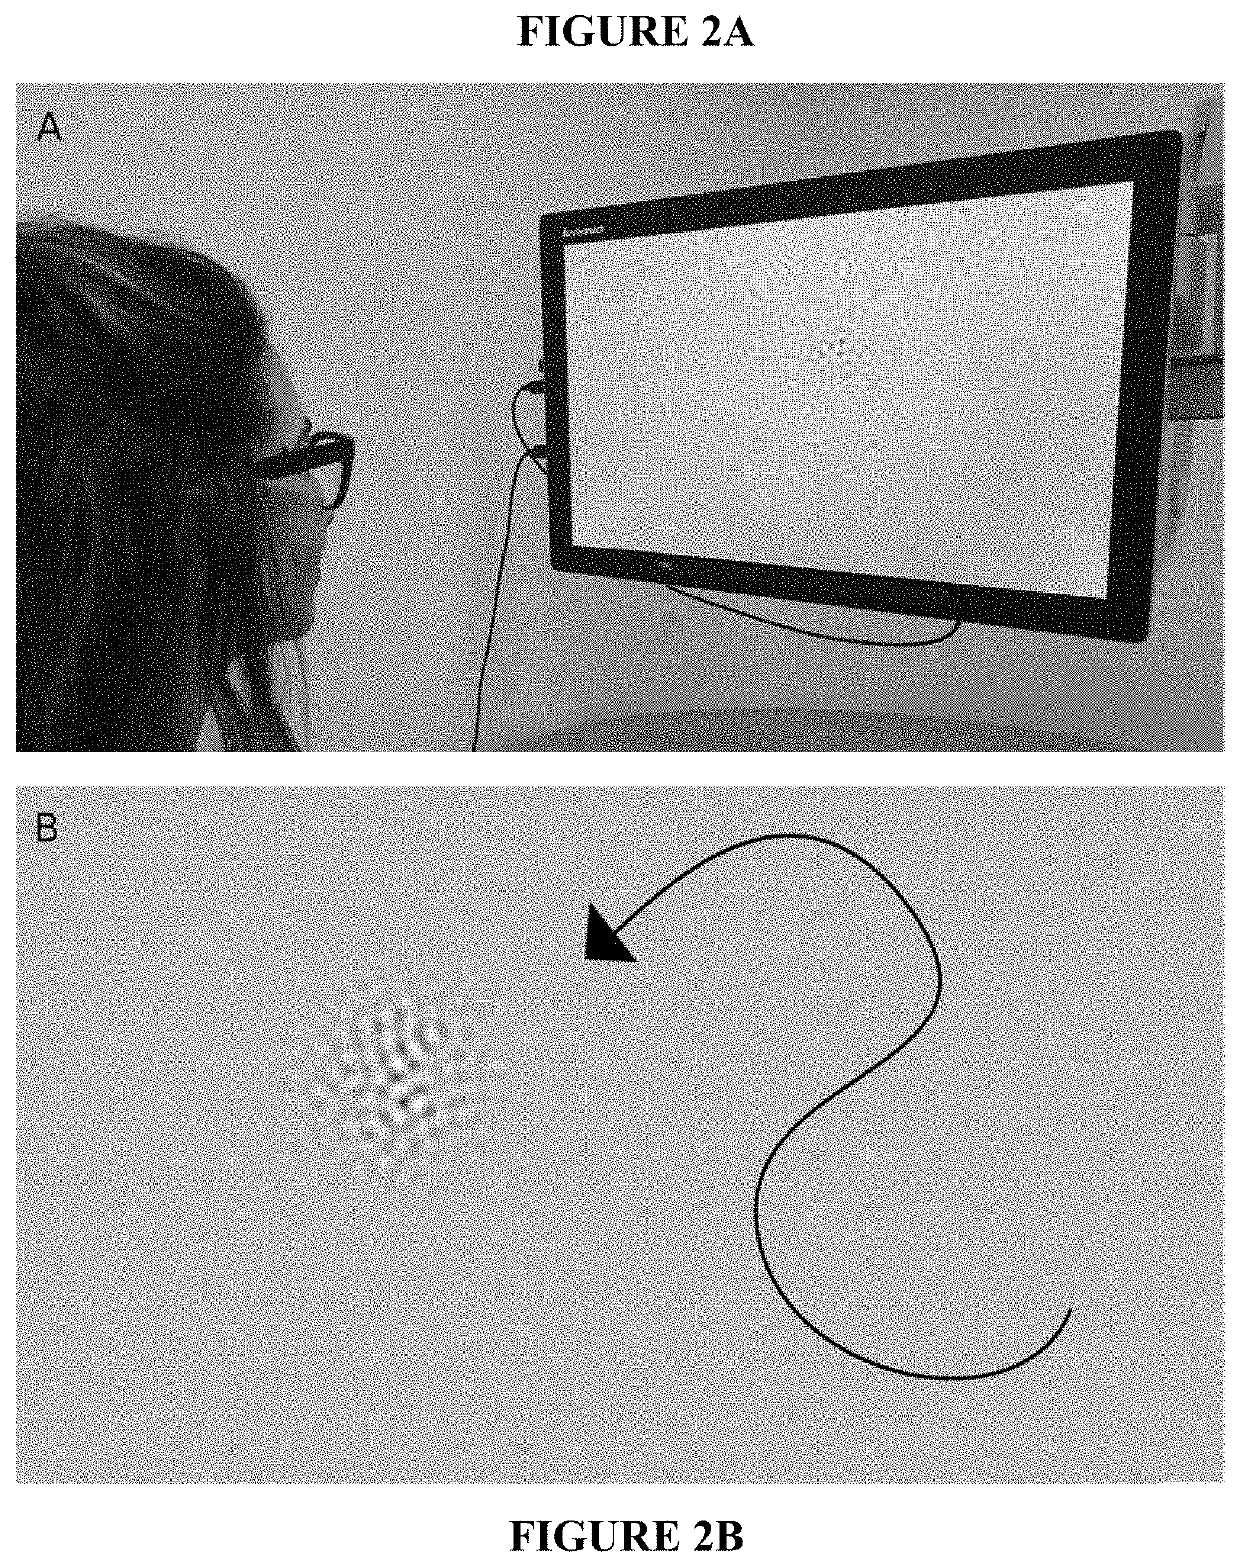
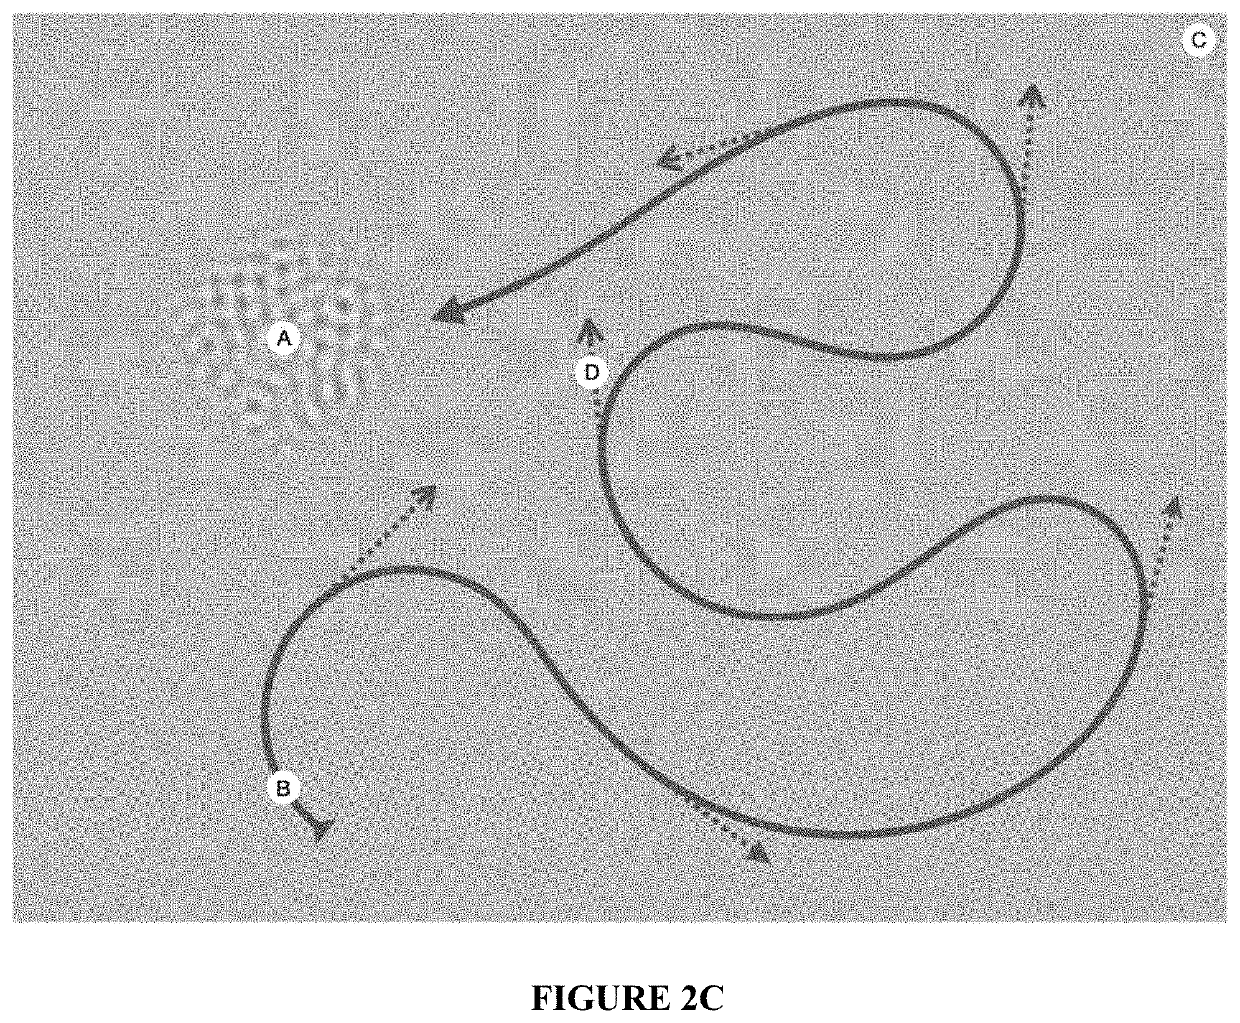
Contrast sensitivity is an informative measure of visual function, but current tools for assessing it are limited by the attentional, motor, and communicative abilities of the participant. These participants are often less able to engage with psychophysical tasks or follow an experiment's instructions, and alternative approaches have disadvantages that limit their usefulness in clinical settings. Here, we describe an efficient new measure of contrast sensitivity—‘Curveball’—that continuously infers stimulus visibility through smooth eye tracking instead of perceptual report. The procedure rapidly lowers stimulus contrast in real time until the threshold is found. The task is repeatable, well-correlated with results from conventional psychophysical methods, and sensitive to improvements in visual acuity from refractive correction. The procedure requires minimal instruction to administer and takes only five minutes to estimate a full contrast sensitivity function (CSF), which is comparable to the best existing methods available for healthy adults. Our technique relies on a minimum level of smooth tracking ability, which could limit its usefulness for participants with specific visual impairments, and we discuss potential solutions to this problem. Overall, our findings indicate that Curveball is a promising means of accurately assessing contrast sensitivity in previously neglected populations.A method to measure gaze tracking behavior comprising, displaying, on a display, one or more variable-contrast, variable-spatial-frequency stimuli each moving from a first location to a second location. Generating ordered sequences of stimuli (“sweeps”) that are incremented upon detected tracking behavior. Generating, by an eye-tracking monitor, a gaze position signal as the visual stimulus moves from the first position to the second position, the gaze position signal detecting a position of one or both eyes. Filtering the gaze position signal by identifying gaze position samples that are not consistent with the limitations of the human eye and / or visual system. Calculating a trajectory-match score for each stimulus on each frame from comparison of that stimulus's position to the gaze position signal over a time window. Identifying the visual function of the subject in response to the trajectory-match scores. Wherein the variable-contrast stimulus increases in contrast. Wherein the variable-contrast stimulus decreases in contrast. Wherein the variable-contrast stimulus alters in a step-wise manner by multiplying the current contrast by a variable between 0.5-1.5 on each frame. Wherein the variable-contrast stimulus is exchanged for the next stimulus in that sweep sequence. Wherein indirect progress along similar sweeps is inferred and recorded. Interpolating a contrast sensitivity function (CSF) from a set of one or more sweep sequences. Detecting, empirically, the subset of one or more sweep sequences that is most informative about the CSF for a given population.

Description

CROSS-REFERENCE TO RELATED APPLICATIONS[0001]This application claims the benefit of U.S. Provisional Patent Application No. 62 / 749,360, filed on Oct. 23, 2018. The entire contents of that application are incorporated herein by reference.FIELD OF THE INVENTION[0002]This invention relates to the field of assessing visual perception, and specifically to systems and methods for (a) inferring the visibility of visual stimuli from eye tracker data and (b) assessing the contrast sensitivity function.BACKGROUND OF THE INVENTION[0003]The contrast sensitivity function (CSF) is a useful measure of visual system performance because it quantifies fundamental features of how the visual system extracts form from light, and is well correlated with many other measures of visual health and disease. The best means through which to assess the CSF, however, is a matter of ongoing research. Unlike other measures of basic visual function, the CSF describes a continuum of sensitivity thresholds and is cons...

Claims


Application Information

Patent Timeline
IPC IPC(8): A61B3/02A61B3/113A61B3/00
CPCA61B3/022A61B3/113A61B3/0091
Inventor PRUSKY, GLENMOONEY, SCOTT WILLIAM JOSEPHHILL, NICHOLAS JEREMY
Owner BURKE NEUROLOGICAL INST
Learn More