Method and apparatus for predicting the available energy of a battery

a technology of available energy and battery, applied in the direction of parallel operation of dc sources, speed/acceleration/shock measurement devices, program control, etc., can solve the problems of battery wear, significant amount of charging and discharging, time-consuming,

Inactive Publication Date: 2003-09-09
SAMSUNG ELECTRONICS CO LTD
View PDF6 Cites 46 Cited by
  • Summary
  • Abstract
  • Description
  • Claims
  • Application Information

AI Technical Summary

Benefits of technology

Another object is to provide a method to predict the available energy of a battery over a range of battery SOC without having to discharge the battery or perform invasive testing.
The slope of the voltage response curve (dV / dt) is calculated by the computer A from the measured voltage data in response to the applied positive and negative current ramps. FIG. 3 indicates the voltage slope calculated for the voltage response of FIG. 2. FIG. 3 also shows the voltage curve (line 38). The slope value (line 39) is produced by the computer that continuously calculates dV / dt over the duration of the current ramps. The voltage value is on the graph left vertical axis and the slope value on the right vertical axis. Determination of the slope of the voltage curve (dV / dt) is accomplished by the computer calculating from its stored data the difference in successive voltage values over a small time interval. The number of calculations made is selected as needed. A greater number of calculations increases the resolution (accuracy), but also requires an increase in computer processing speed and memory capacity.
The calculated slope data preferably is subjected to an averaging process. In a preferred embodiment, a seven point averaging technique has been found to sufficiently eliminate noise caused by the electronic circuitry. Using fewer points for averaging may result in insufficient noise suppression, while including more points may suppress the sharpness of the dV / dt data.

Problems solved by technology

As seen, this method involves a significant amount of charging and discharging and is time consuming since it takes a relatively long time for each of the charge and discharge cycles.
The cycling method also may be destructive of the battery health.
For example, in a lead-acid storage battery, gassing may occur in overcharging the battery, and cause damage.
Also, there is wear of the battery due to the charge / discharge cycling.
Also, to do this, a battery has to be taken off line for testing, during which time the battery is not available for its designated application, such as in an UPS.
However, the method described in this patent is limited in application to batteries in a fully charged state, i.e., 100% SOC.

Method used


Image

  • Method and apparatus for predicting the available energy of a battery
  • Method and apparatus for predicting the available energy of a battery
  • Method and apparatus for predicting the available energy of a battery

Examples


Embodiment Construction

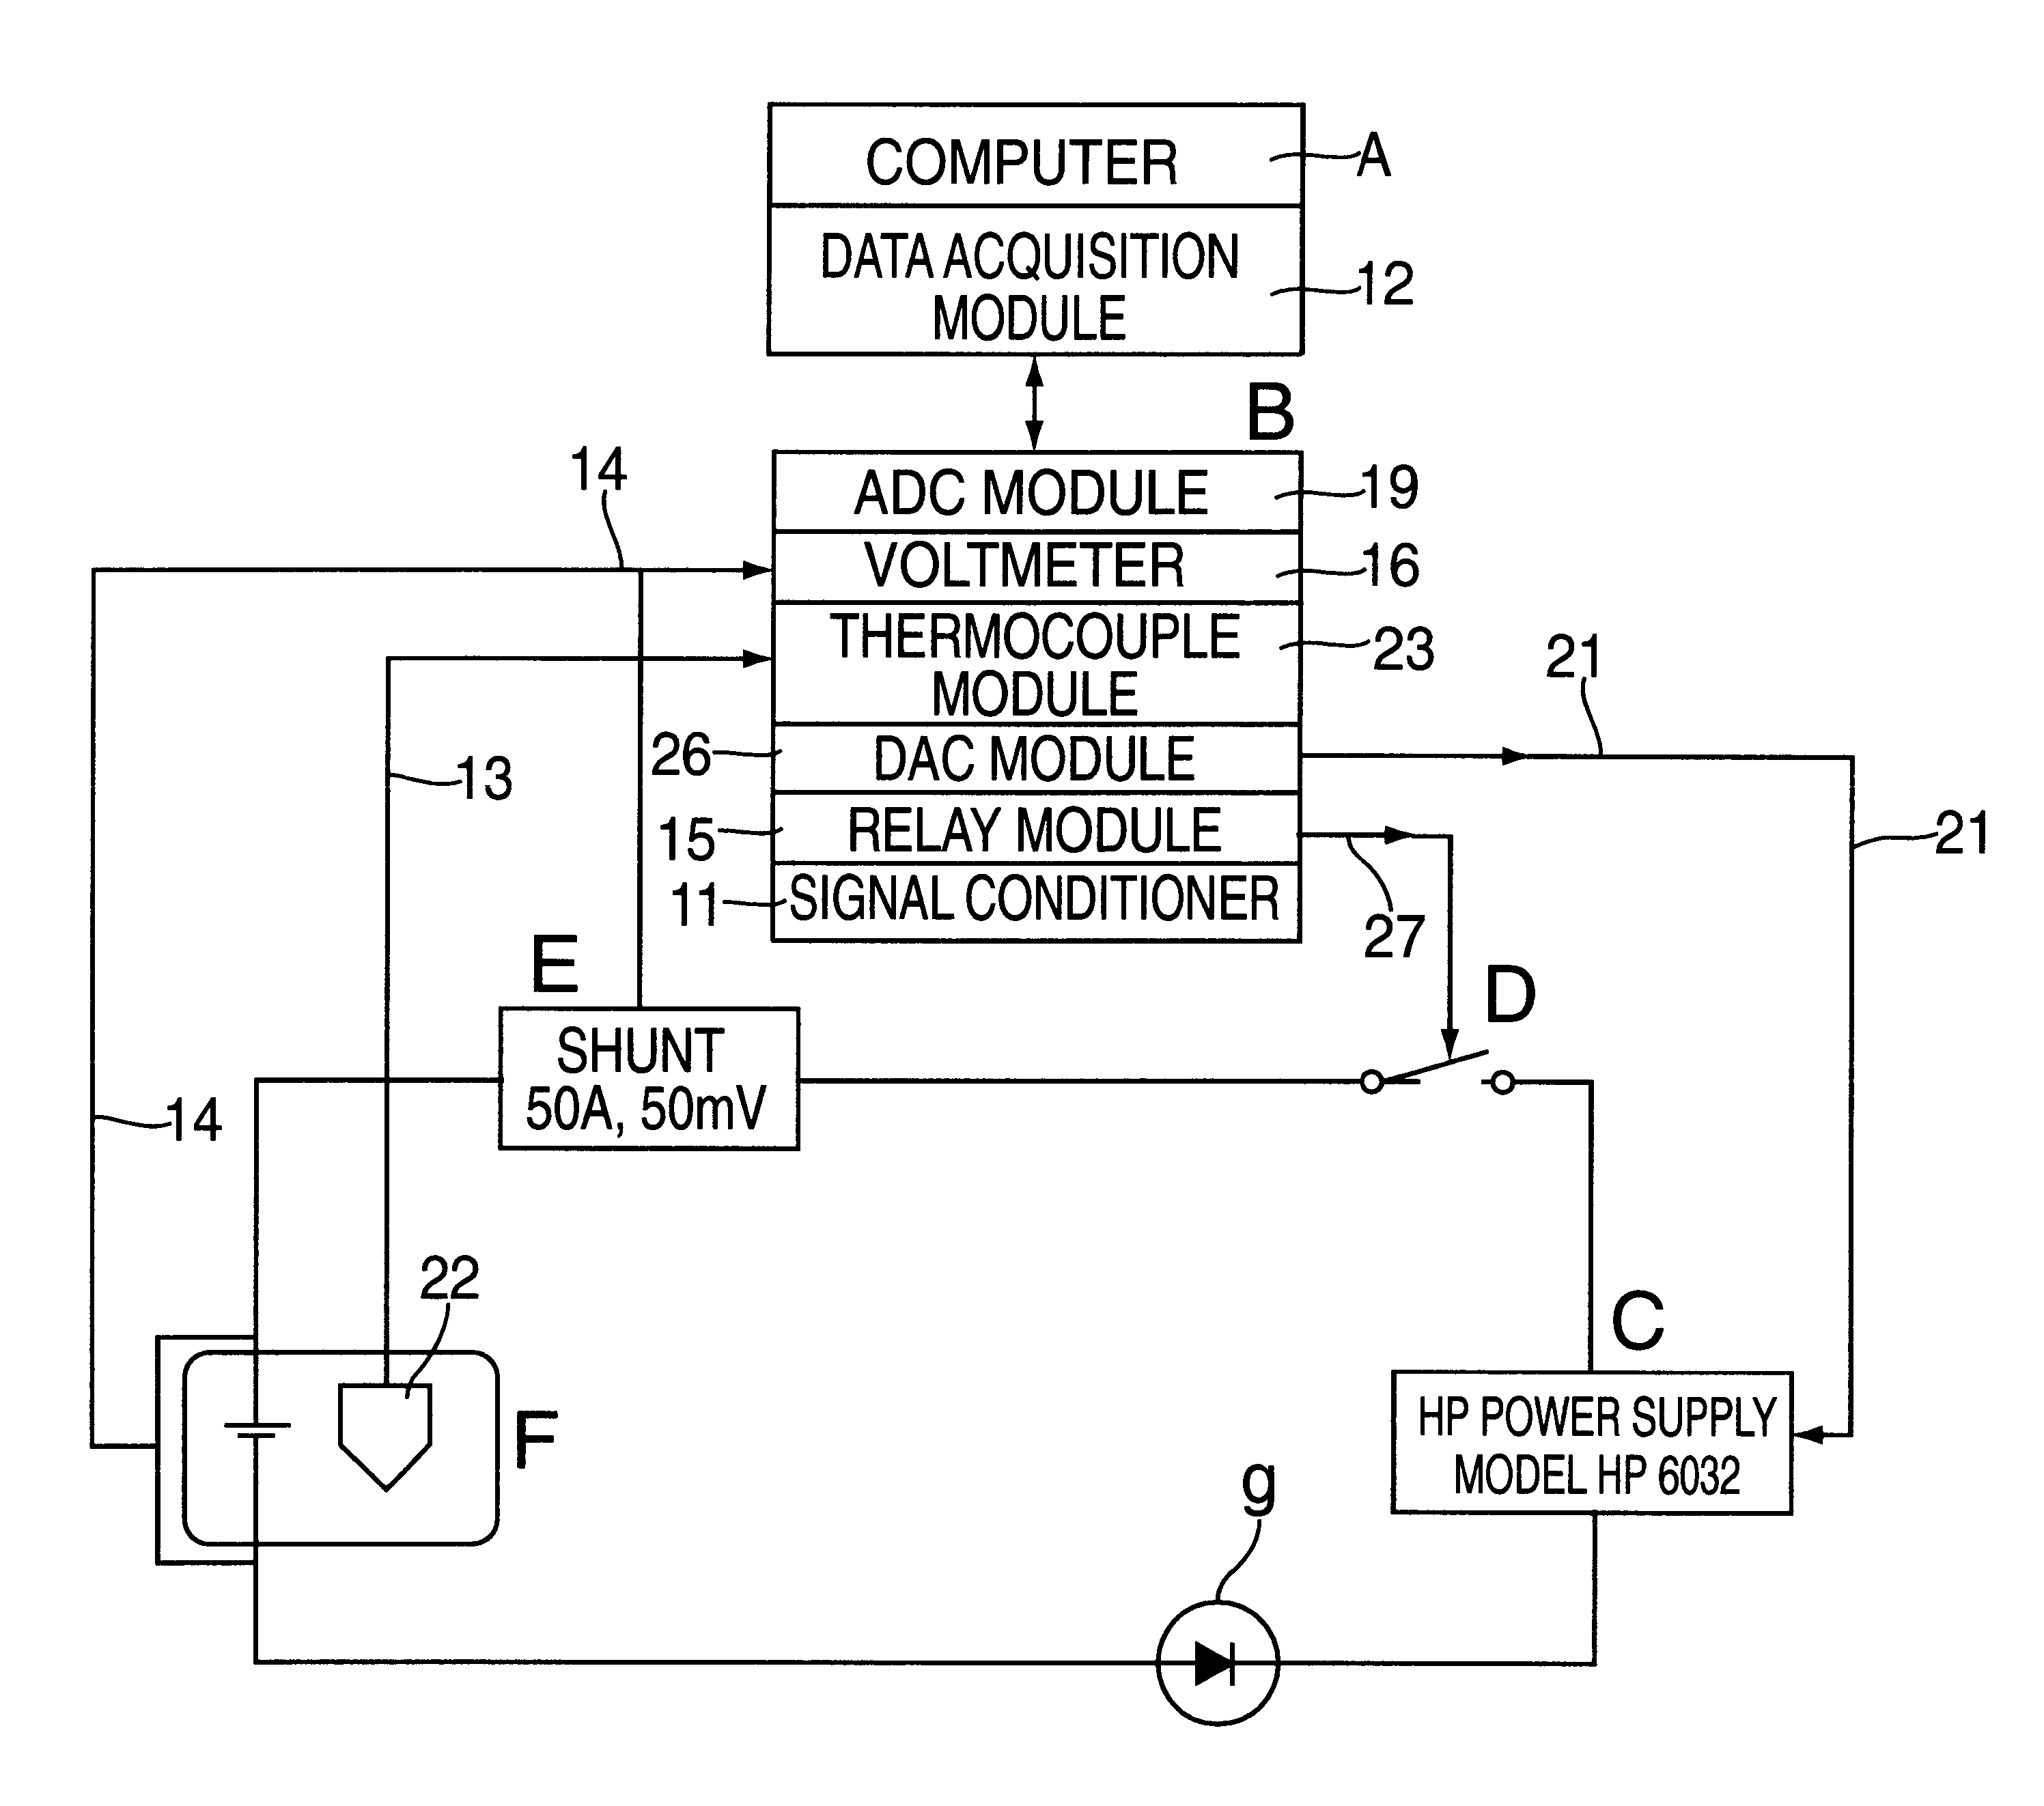
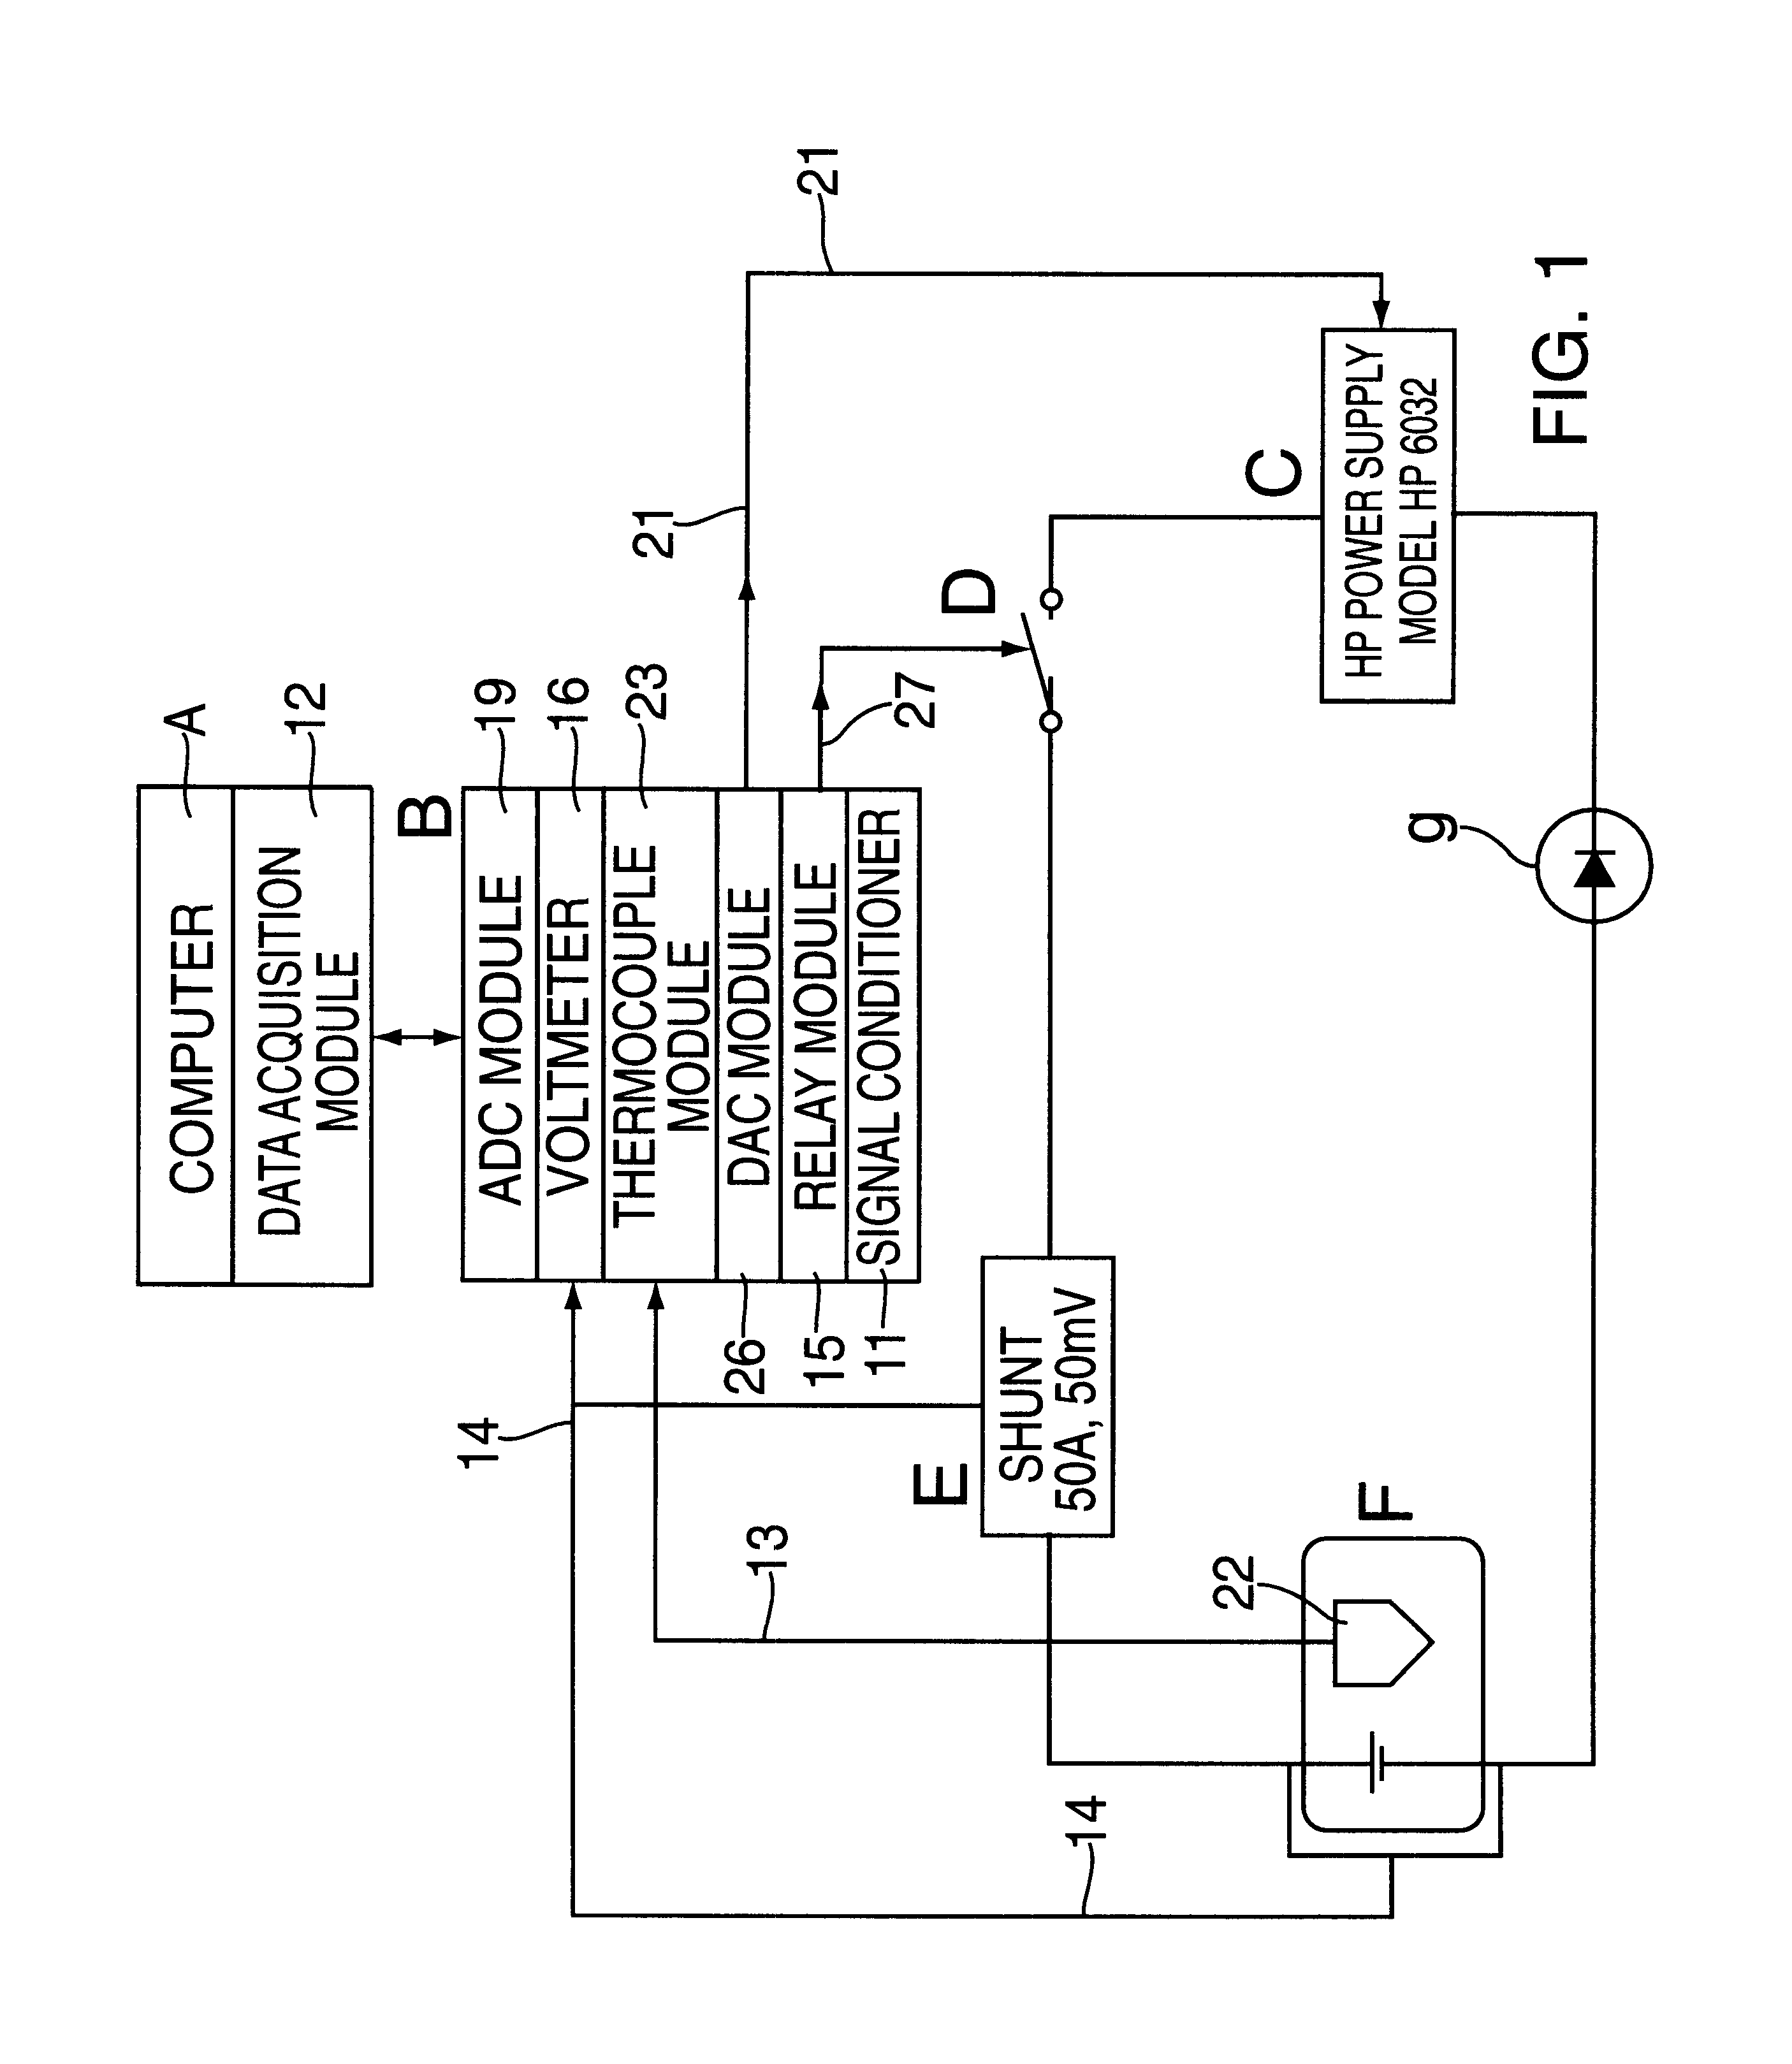
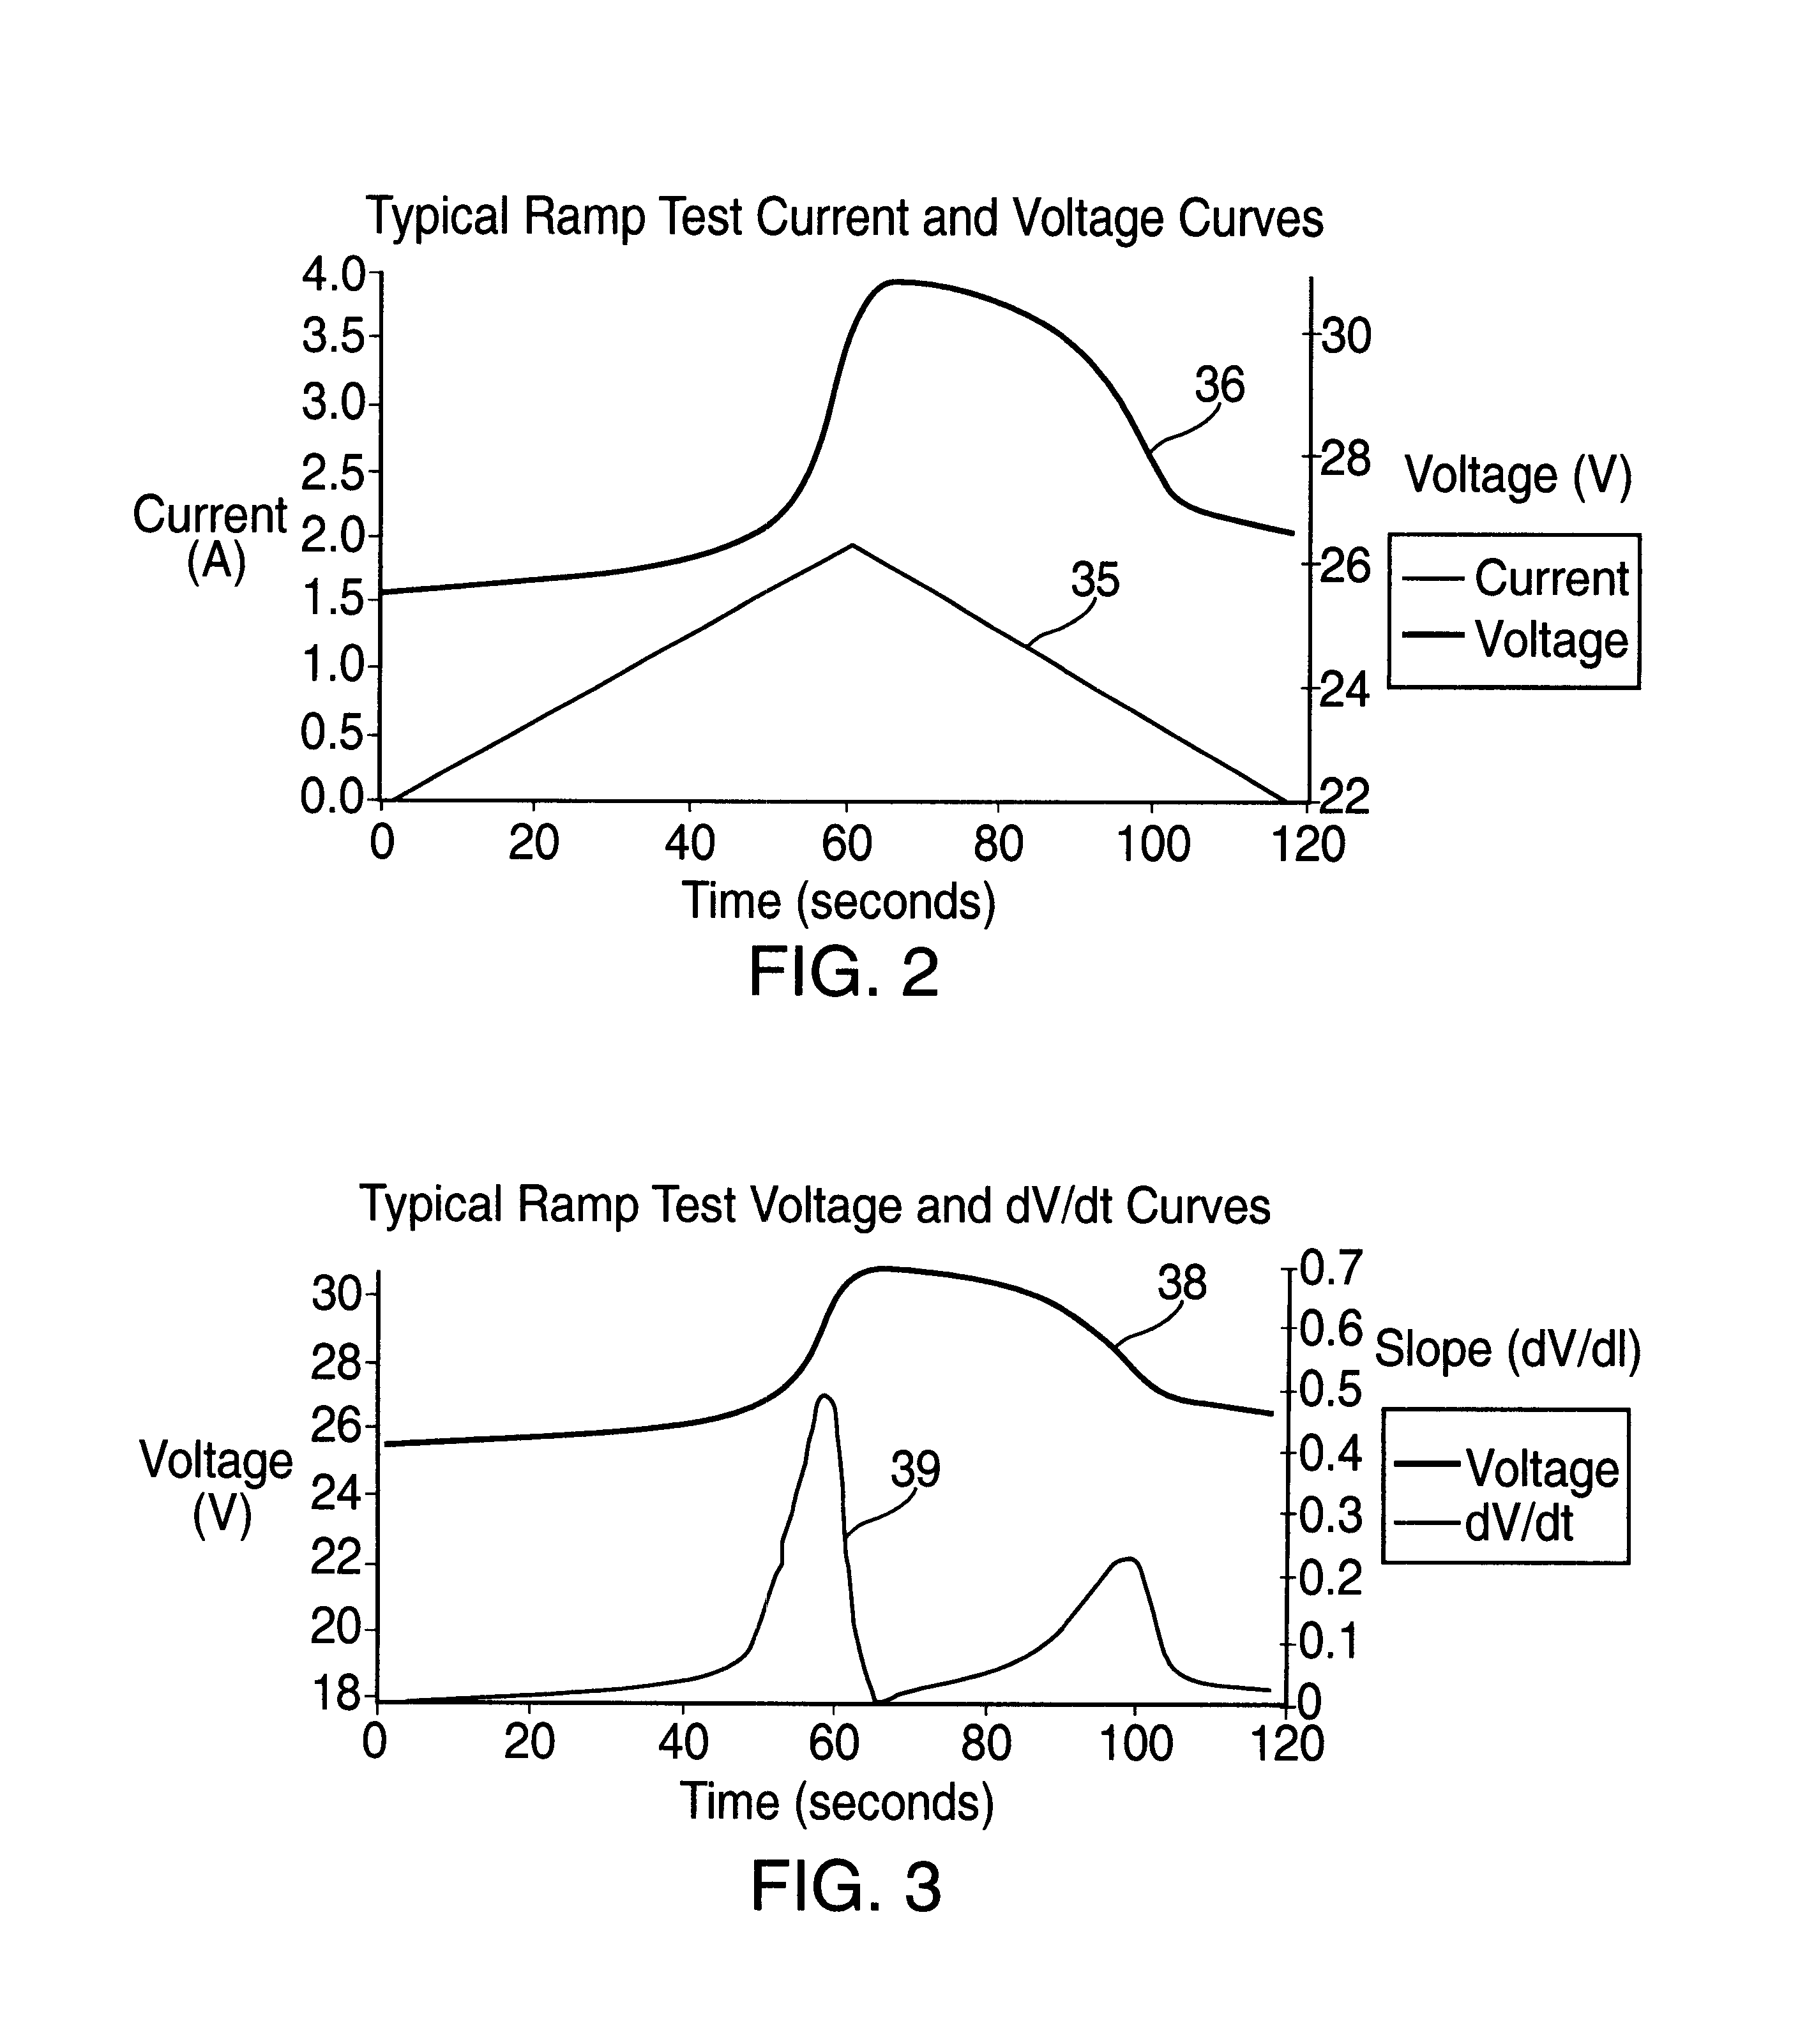
The following is an example of the use of the invention for a 24 V, 18 Ah lead-acid rechargeable battery formed by 4 Panasonic LC-R129P1 cells connected in a series, parallel configuration. The battery was removed from a UPS system and connected to the battery test stand. The battery was subjected to a 1.5A charge pulse. Internal resistance was determined to equal 65.4 Milliohms. The battery was then subjected to the current ramp test. The open circuit voltage of the battery was measured at 25.21 V. Two gas points were detected, one on the rising half of the ramp and one on the decreasing half of the ramp. The Gas Up point occurred at 1.9 A, 21.01 V. The Gas Down point occurred at 0.99A, 27.63 V. The battery case temperature was measured at 24.38.degree. C.

Using these values in the available energy determination formula (2) given above, the available energy is predicted to be:

Available energy=25.21*1.872+24.38*-0.184+65.4*-0.062+1.9*1.415+29.01*-0.485+0.99*1.632+27.63*0.5498-36.13

Th...


PUM

PropertyMeasurementUnit
temperatureaaaaaaaaaa
available energyaaaaaaaaaa
open circuit voltageaaaaaaaaaa

Abstract

A method of predicting by non-invasive testing the available energy of a battery at any state of charge by acquiring data of the parameters of internal resistance (IR), open circuit voltage (OCV) and temperature (T), the points of voltage and current of the slope on a positive current ramp of Vup and Iup at the transition from charge to overcharge and on a negative current ramp of Vdn and Idn at the transition from overcharge to charge for a plurality of batteries. Next an algorithm in the form of a linear equation is developed using this data. The available energy of a battery under test is predicted by acquiring from it the numerical data values of these parameters and applying them to the algorithm.

Description

The invention relates to a method and apparatus for predicting the available energy of a battery and the available run time for such a battery at any state of charge by use of a non-invasive test procedure.It is often desired to determine the actual capacity of a battery, usually measured in amp hours (Ah), and particularly a lead-acid storage type. Conventional methods for determining the capacity of a lead-acid storage battery involve fully charging the battery to 100% state of charge (SOC) and then fully discharging the battery at a constant current (amperes) value. The battery capacity is determined by multiplying the discharge current value (in amperes) times the discharge time (in hours) needed to fully discharge the battery.Following the discharge to determine its capacity, the battery must be fully charged again to be ready for use. As seen, this method involves a significant amount of charging and discharging and is time consuming since it takes a relatively long time for e...

Claims


Application Information

Patent Timeline
Patent Type & Authority Patents(United States)
IPC IPC(8): G01R31/36H01M10/48
CPCG01R31/362G01R31/3675G01R31/3668G01R31/374G01R31/379G01R31/3835G01R31/36
Inventor HOENIG, STEVENSINGH, HARMOHANPALANISAMY, THIRUMALAI G.EAGAN, MARGARET
Owner SAMSUNG ELECTRONICS CO LTD
Why Eureka
Try Eureka