Method for measuring the attenuation in digital transmission lines

a technology of digital transmission lines and attenuation, which is applied in the direction of transmission, modulated carrier systems, transmission, etc., can solve the problems of high demands on the dynamics of the measuring arrangement, high cost, and time-consuming

Inactive Publication Date: 2004-02-03
WANDEL & GOLTERMANN MANAGEMENT HLDG
View PDF14 Cites 16 Cited by
  • Summary
  • Abstract
  • Description
  • Claims
  • Application Information

AI Technical Summary

Problems solved by technology

All these methods suffer from a common problem in that the subscriber access lines in part were constructed many years ago, being originally intended only for transmission of the telephone voice channel.
If this data is not known, then measuring becomes necessary, where among other characteristics the attenuation must also be measured; a very costly procedure.
In addition, a measuring technician needs to go to the customer end of the line which can be very time consuming.
For practical realization this does however place very high demands on the dynamics of the measuring arrangement.
Attenuation is predominantly caused by line losses.
To be sure, to a small extent reflections too, cause line losses which result in several pulses travelling to the line input.
In the case of low frequencies, the wave im...

Method used


Image

  • Method for measuring the attenuation in digital transmission lines
  • Method for measuring the attenuation in digital transmission lines
  • Method for measuring the attenuation in digital transmission lines

Examples


Embodiment Construction

)

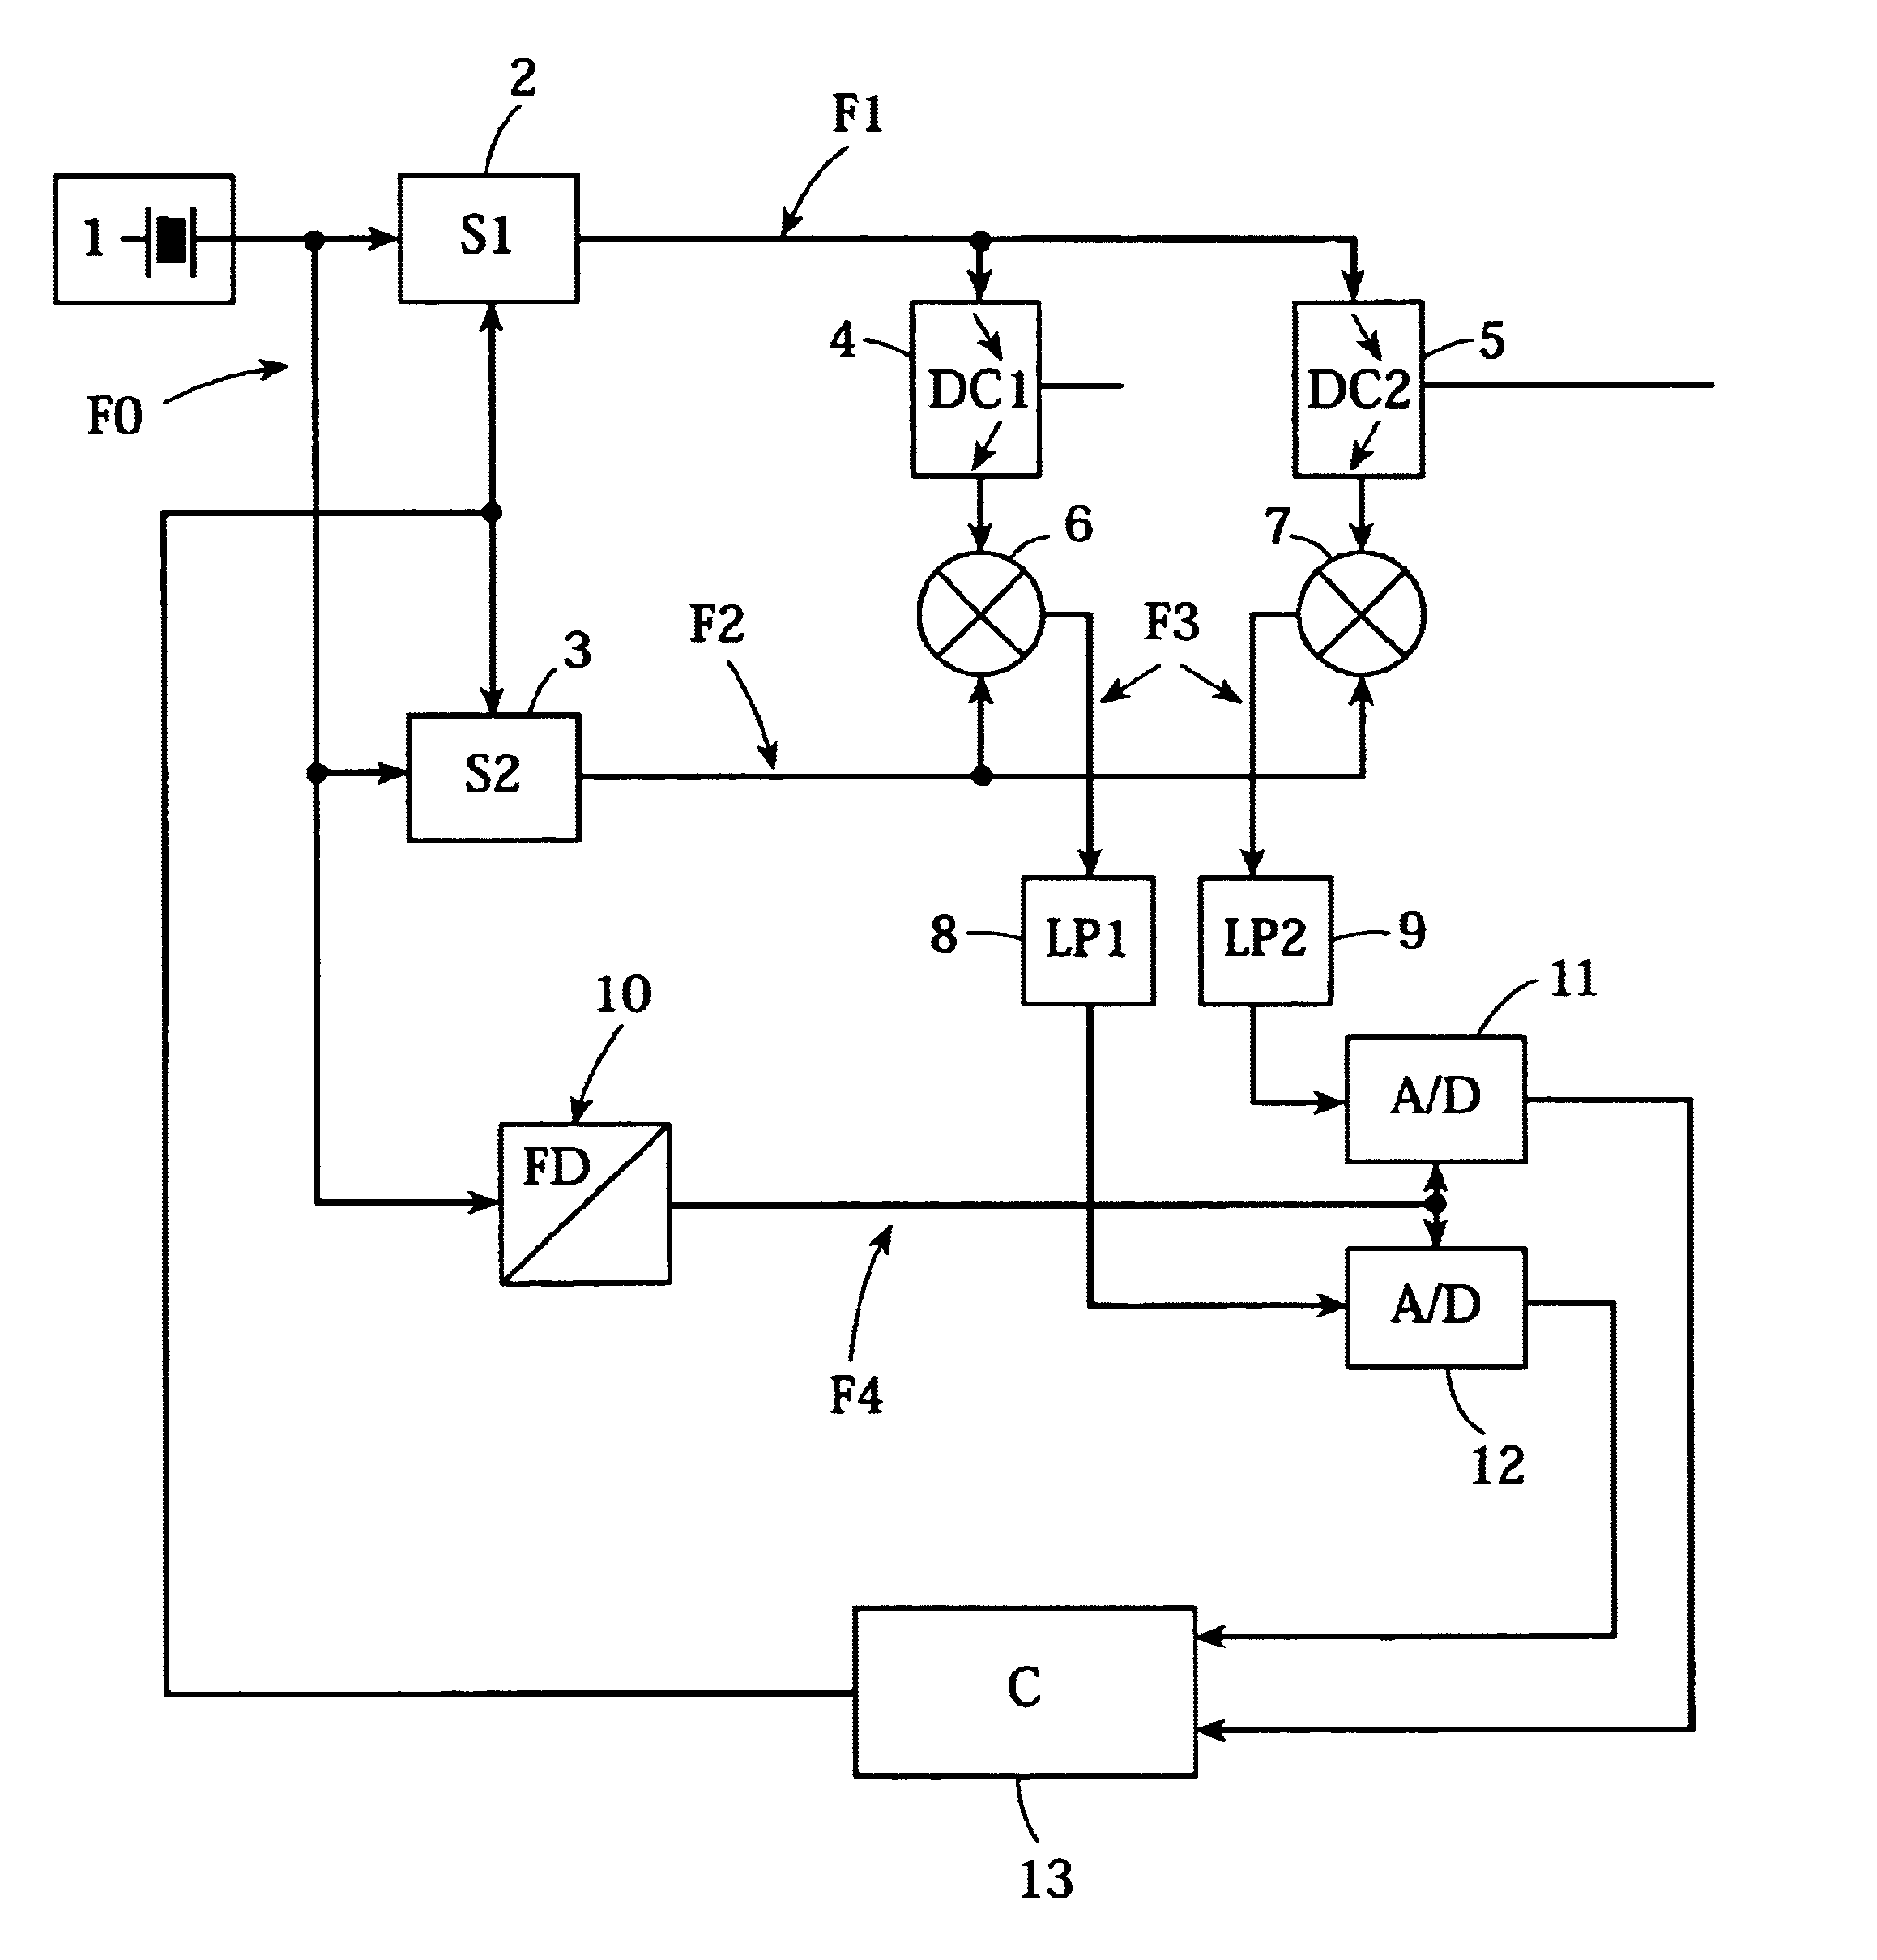
In FIG. 1 the reflection curve R is shown over time. In order to determine line attenuation, the reflection LE at the end of the line is transformed into the frequency range in the time interval T1 to T2 and the frequency spectrum is offset against the spectrum of the transmission pulse. In addition, this Fig. shows the reflection LA at the beginning of the line and the reflection LM in the middle of the line. Also shown in this Fig. is the attenuation curve D, depending on the frequency shown at the upper margin of the image, from the reflection at the end of the line, as a result of this offsetting calculation. The reflection curve R and the attenuation curve D share a common level-scale of 10 dB / gradation.

In order to carry out measurements in the frequency range, a measuring setup with high measuring dynamics and accuracy is required. This can be shown by the following example: If at a certain frequency we assume a line attenuation of 50 dB, then the reflected signal is attenuat...


PUM


Abstract

A method for measuring the attenuation in digital transmission lines between a switching center and a subscriber station, with a first pulse of a known frequency spectrum being sent from the switching center to the transmission line. From the multitude of the reflections received by the switching center in the time domain that pulse is selected which was caused by the total reflection at the end of the line of a certain subscriber station. The frequency spectrum of the selected pulse is determined and from the frequency spectra of the outgoing pulse and the selected received pulse, the attenuation of the transmission line is determined, depending on its frequency. To achieve the extremely high dynamics necessary for this and to obtain a pulse which is free of any overshoot, reflection measuring is carried out selectively in the frequency range and the pulse is calculated per Fourier transformation. In order to reduce pulse widening by dispersion, the pulse in the frequency range is shifted to higher frequencies. The method makes it possible to qualify subscriber stations for new services by measuring the attenuation from the switching center.

Description

1. Field of the InventionThe present invention relates to a method for measuring the attenuation in digital transmission lines between a switching center and a subscriber station.2. Description of the Related ArtIncreasingly, telecommunications networks are changed over to broader band digital transmission methods. This also applies to the subscriber access area; consequently the telecommunications carriers are already implementing the changeover from analogue voice transmission to ISDN (Integrated Services Digital Network). At the same time, still further methods are being tested under the collective term of xDSL for Digital Subscriber Line (ADSL=Asymmetrical Digital Subscriber Line, HDSL=High bit rate Digital Subscriber Line, VHDSL=Very High bit rate Digital Subscriber Line) with considerably higher bit rates. All these methods suffer from a common problem in that the subscriber access lines in part were constructed many years ago, being originally intended only for transmission o...

Claims


Application Information

Patent Timeline
IPC IPC(8): H04B3/46H04B3/48H04M3/30H04M3/28H04L27/00H04M3/26
CPCH04B3/466H04B3/48H04M3/30
Inventor BOHLEY, ROLF
Owner WANDEL & GOLTERMANN MANAGEMENT HLDG
Why Eureka
Try Eureka