
Formulation and manipulation of databases of analyte and associated values

a technology applied in the field of formulation and manipulation of databases of analyte and associated values, can solve the problems of inconvenient and time-consuming measurement of analyte levels in individuals, inability to provide a complete picture of the fluctuations of glucose levels, and rarely performing more frequent testing of blood glucose levels

Inactive Publication Date: 2005-09-06
ANIMAS TECH +1
View PDF51 Cites 289 Cited by
  • Summary
  • Abstract
  • Description
  • Claims
  • Application Information

AI Technical Summary

Benefits of technology

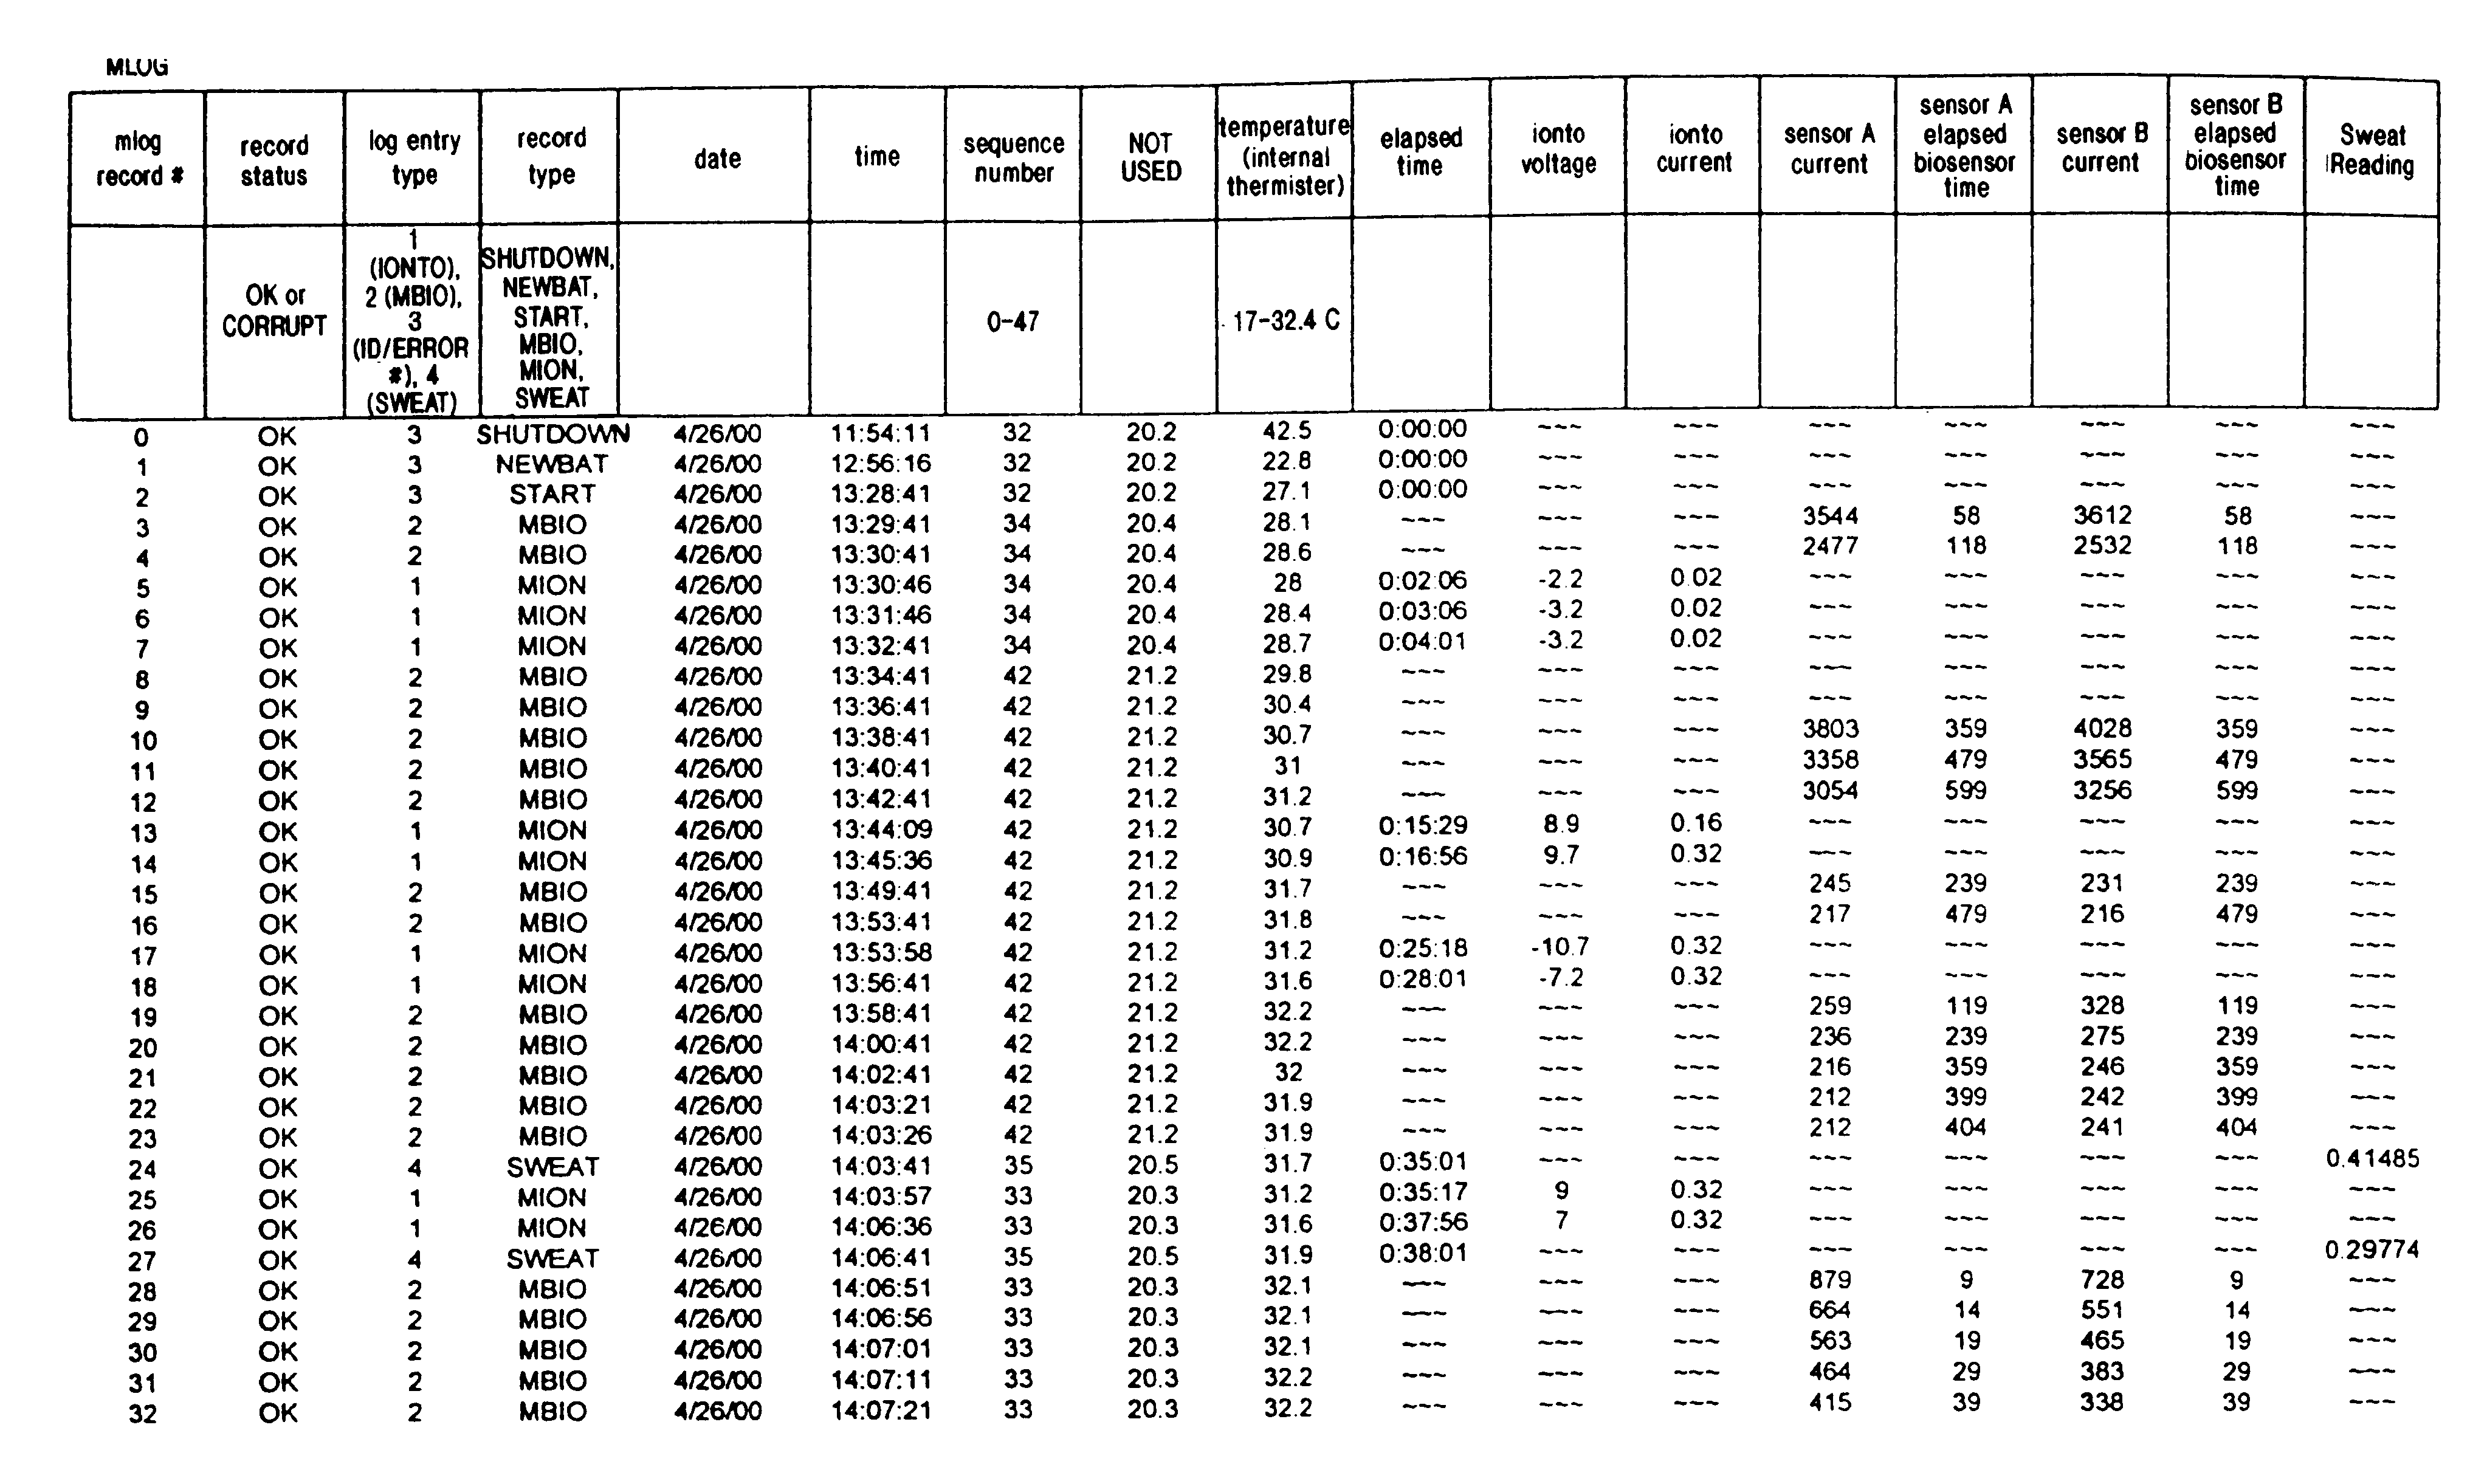
"The present invention relates to a method for formulating a database of analyte data points, derived data, and data attributes. The method involves collecting data points from an analyte monitoring device and associating them with relevant data attributes. The data points can be collected from a single individual or multiple individuals. The invention also includes manipulating the database using data attributes to examine factors that affect baseline analyte levels and changes in the analyte levels. The invention further includes using a glucose monitoring system, such as the Gluco Watch biographer system, which provides frequent and non-invasive glucose readings. The invention allows for the formulation of large databases of analyte data points and the analysis of factors that affect baseline analyte levels and changes in the analyte levels."

Problems solved by technology

Previously, measurement of analyte levels in an individual was inconvenient and time consuming.
As a result, testing of blood glucose levels was seldom performed more frequently than 2 times per day.
Such testing does not provide a complete picture of the fluctuations of glucose levels.
Hence, formulation of a database comprising (1) data points (e.g., measured analyte levels) and (2) information associated with each data point (e.g., the date and time of the measurement; activities affecting analyte levels such as food or water intake or physical exertion; and drug administration), was previously difficult.
Further, even if obtainable, the accuracy and precision of such databases was suspect.

Method used


Image

  • Formulation and manipulation of databases of analyte and associated values
  • Formulation and manipulation of databases of analyte and associated values
  • Formulation and manipulation of databases of analyte and associated values

Examples


example 1

Temperature and Perspiration as Indicators of Hypoglycemia

[0171]Several researchers have investigated the correlation between skin temperature and perspiration and the presence of hypoglycemia. Bolinger, et al. (Bolinger, R. E., et al., Diabetes, 13, 600-605 (1964)) reported that a decrease in skin resistance, indicating the onset of perspiration, coincided with the onset of hypoglycemic symptoms. Levandoski, et al. (Levandoski, L. A., et al., in Artificial Systems for Insulin Delivery, P. Brunetti, et al., Eds. Raven Press: New York (1983), p. 353-356) evaluated a then-commercially available device, the Teledyne Sleep Sentry® device which uses both skin conductivity and temperature to detect nocturnal hypoglycemia. In a study of insulin-induced hypoglycemia in 27 diabetic patients, the device correctly detected the hypoglycemia 80% of the time. In widespread use, however, the Sleep Sentry device demonstrated a high rate of false positive alarms, and was not a commercial success, an...


PUM


Abstract

The present invention relates to methods of formulating analyte data databases, the databases themselves, and methods of manipulating the same. In one aspect the present invention includes the formulation of analyte data points, derived data, and data attributes databases comprising data points collected using an analyte monitoring device capable of frequent monitoring of analyte concentrations or amounts. Such data points may comprise acquired data (e.g., values corresponding to analyte concentrations or amounts as measured by said analyte monitoring device). These data points are then associated with one or more relevant data attributes. The resulting databases may be manipulated to determine relationships among the components of the database.

Description

CROSS-REFERENCE TO RELATED APPLICATIONS[0001]This application a continuation of U.S. patent application Ser. No. 09 / 927583, filed May 10, 2001, now U.S. Pat. No. 6,633,772, which claims priority from U.S. Provisional Patent Application Serial No. 60 / 226,205, filed 18 Aug. 2000, from which priority is claimed under 35 USC §119(e)(1), and which application is incorporated herein by reference in its entirety.TECHNICAL FIELD[0002]The present invention relates to the formulation of analyte data points, derived data, and data attributes into one or more databases, the databases themselves, and the manipulation of those databases to produce useful information regarding factors correlated with analyte data.BACKGROUND OF THE INVENTION[0003]Previously, measurement of analyte levels in an individual was inconvenient and time consuming. For example, monitoring blood glucose levels in a diabetic formerly required a diabetic subject to obtain a blood sample, test that sample using e.g., a HemoCue...

Claims


Application Information

Patent Timeline
Patent Type & Authority Patents(United States)
IPC IPC(8): G06F19/00
CPCG06F19/322G06F19/3406G06F19/366G06F19/3456Y10S707/99945Y10S707/99948G16H40/63G16H10/60G16H10/40G16H70/00G16H40/67
Inventor FORD, RUSSELLLESHO, MATTHEW J.POTTS, RUSSELL O.TIERNEY, MICHAEL J.WEI, CHARLES W.
Owner ANIMAS TECH
Learn More