Textual and graphical demarcation of location from an environmental database, and interpretation of measurements including descriptive metrics and qualitative values

a location database and environmental database technology, applied in the field of measurement science and field measurements, can solve the problems of difficult physical detection, complicated means of transmitting data from some point a to some point b, and difficulty in locating the physical location and actual installed components of such distributed networks

Inactive Publication Date: 2006-03-28
EXTREME NETWORKS INC
View PDF124 Cites 165 Cited by
  • Summary
  • Abstract
  • Description
  • Claims
  • Application Information

AI Technical Summary

Benefits of technology

[0070]The invention provides for a system and method whereby measurement readings may be associated with one or more textual strings or graphical icons that have a specific meaning that allows one to understand or recall with ease the measurement type, measurement location, or measurement meaning by textual or graphical recognition based on one's desired cue or by an agreed-upon or learned symbology that may have nothing to do with the technical details of the measurement, itself. Furthermore, the invention allows, prior to an actual field measurement survey, the loading or preprogramming of textual strings or graphical icons to have particular measurement meanings, measurement instructions, or to denote particular locations or positions, without having to require the user of the invention to understand the technical details or specific attributes of the measurement data, itself. In addition, the invention allows a user to rapidly associate a particular collection of measurements to a particular region on a site-specific environmental model, without the need for the user of the invention to have specific knowledge of the coordinates or exact position location during the measurement survey, itself.
[0071]The benefit of the invention is that the user (or someone else) is able to define icons or textual demarcations that allow specific instructions, measurement locations or positions, or measurement meanings to be clear from the user's understood context of the displayed icon, without requiring a site-specific model of the physical environment or requiring technical details or knowledge pertaining to the measurement to be displayed or available during each measurement. Thus, someone with little or no computer background could use the invention to rapidly access, measure, store, and archive field survey results for a myriad of applications, such as conducting field surveys for a communication system whereby the icons or textual strings provide visual cues or prompts that instruct the user to properly locate the equipment for the measurements of interest, and such displayed icons also could indicate to the user whether or not the measurements are acceptable or not, without requiring the user to understand the technical details of the measurement, itself.

Problems solved by technology

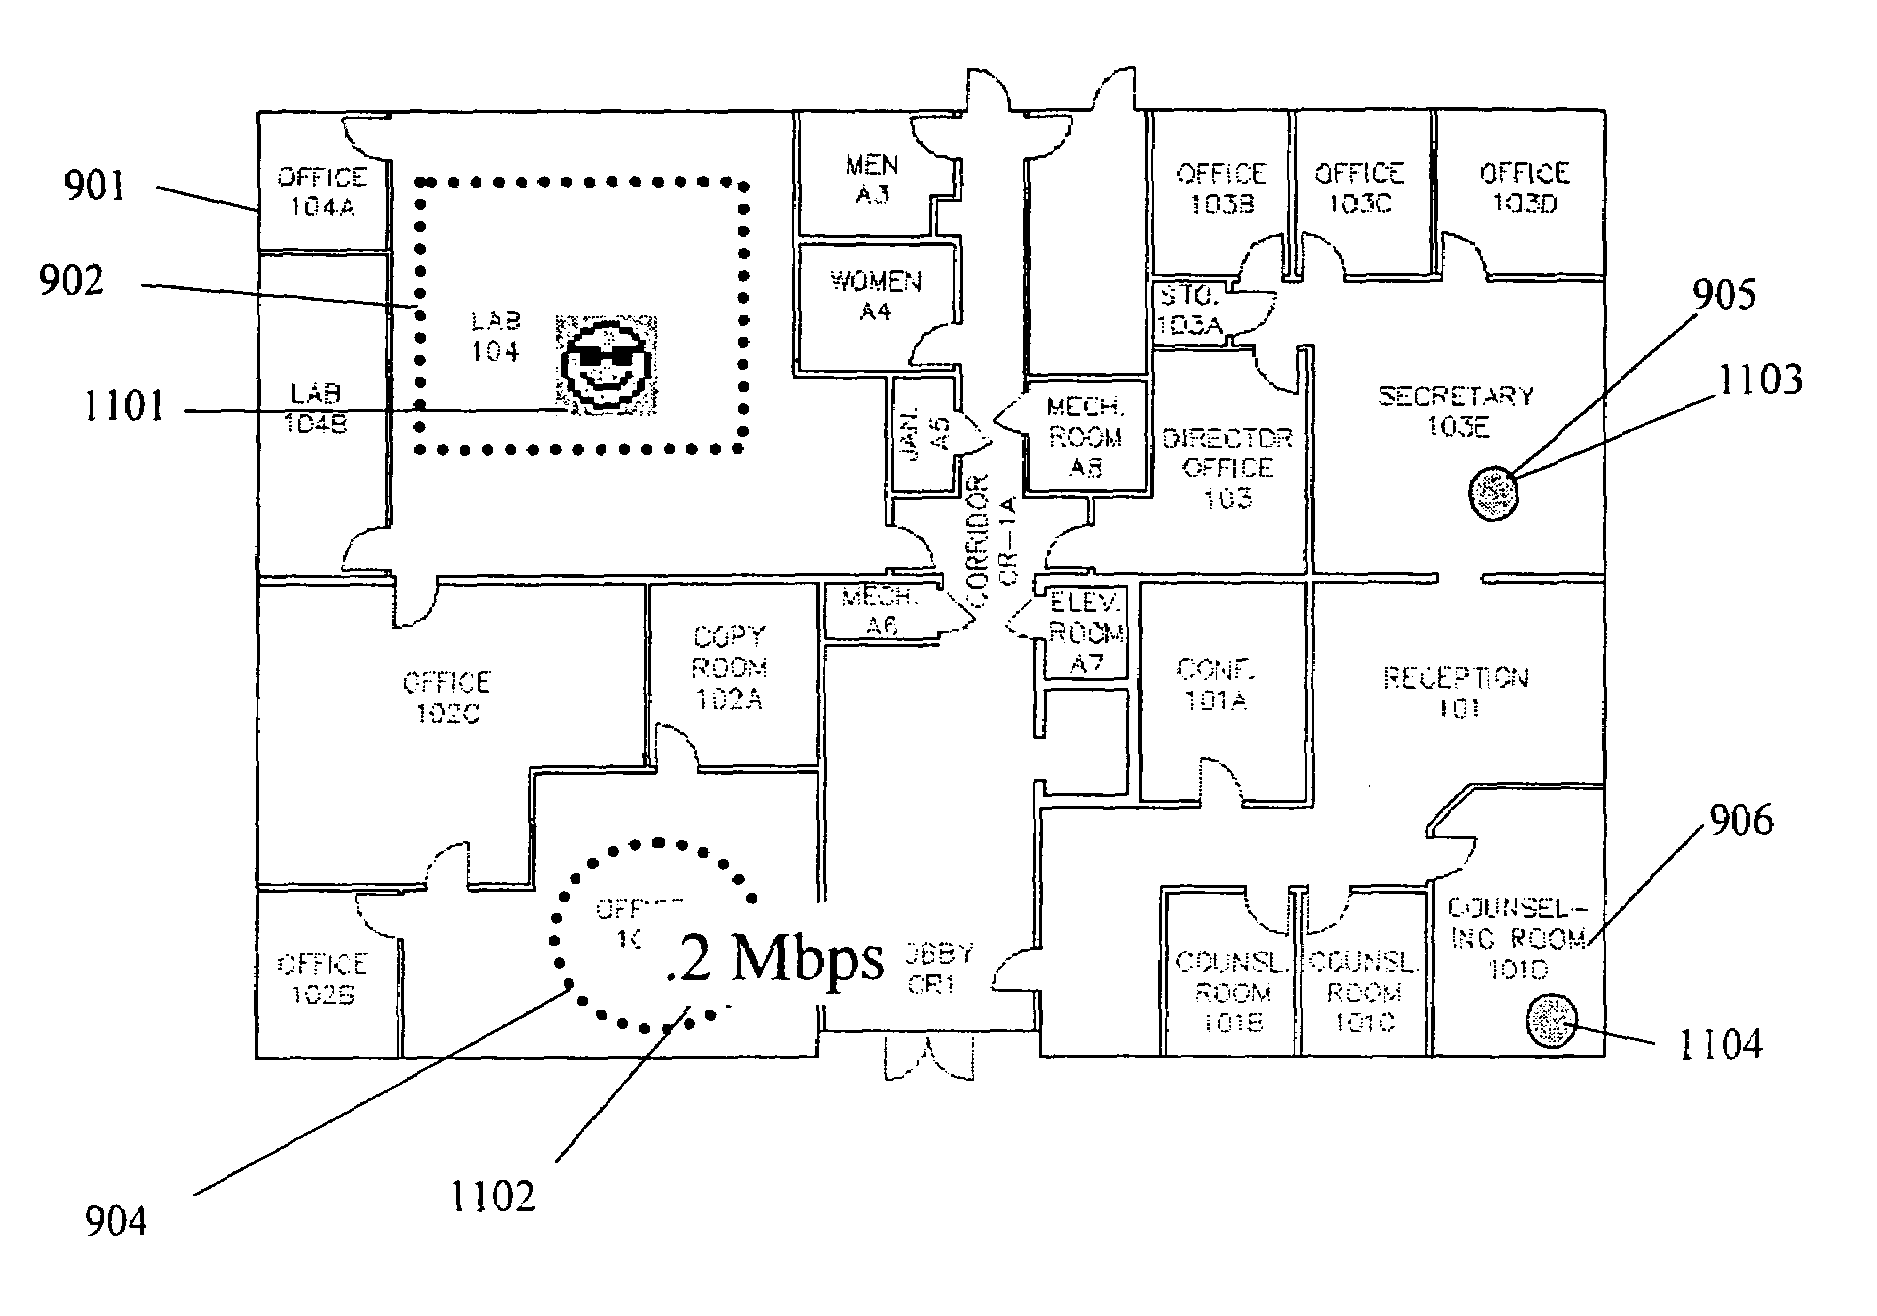
When deploying a distributed network of components within buildings, or between buildings, or within urban or suburban cores, it is often difficult to locate the physical location and actual installed components that comprise such distributed networks after the building or core is completely built, and field measurements must be conducted to determine suitability, quality, or proper performance of the “hidden” network.
In the case of distributed communications networks within buildings or campuses, active components, such as base station access points (for wireless local area networks), base stations (for cellular or PCS systems), routers and switches (for wired or 
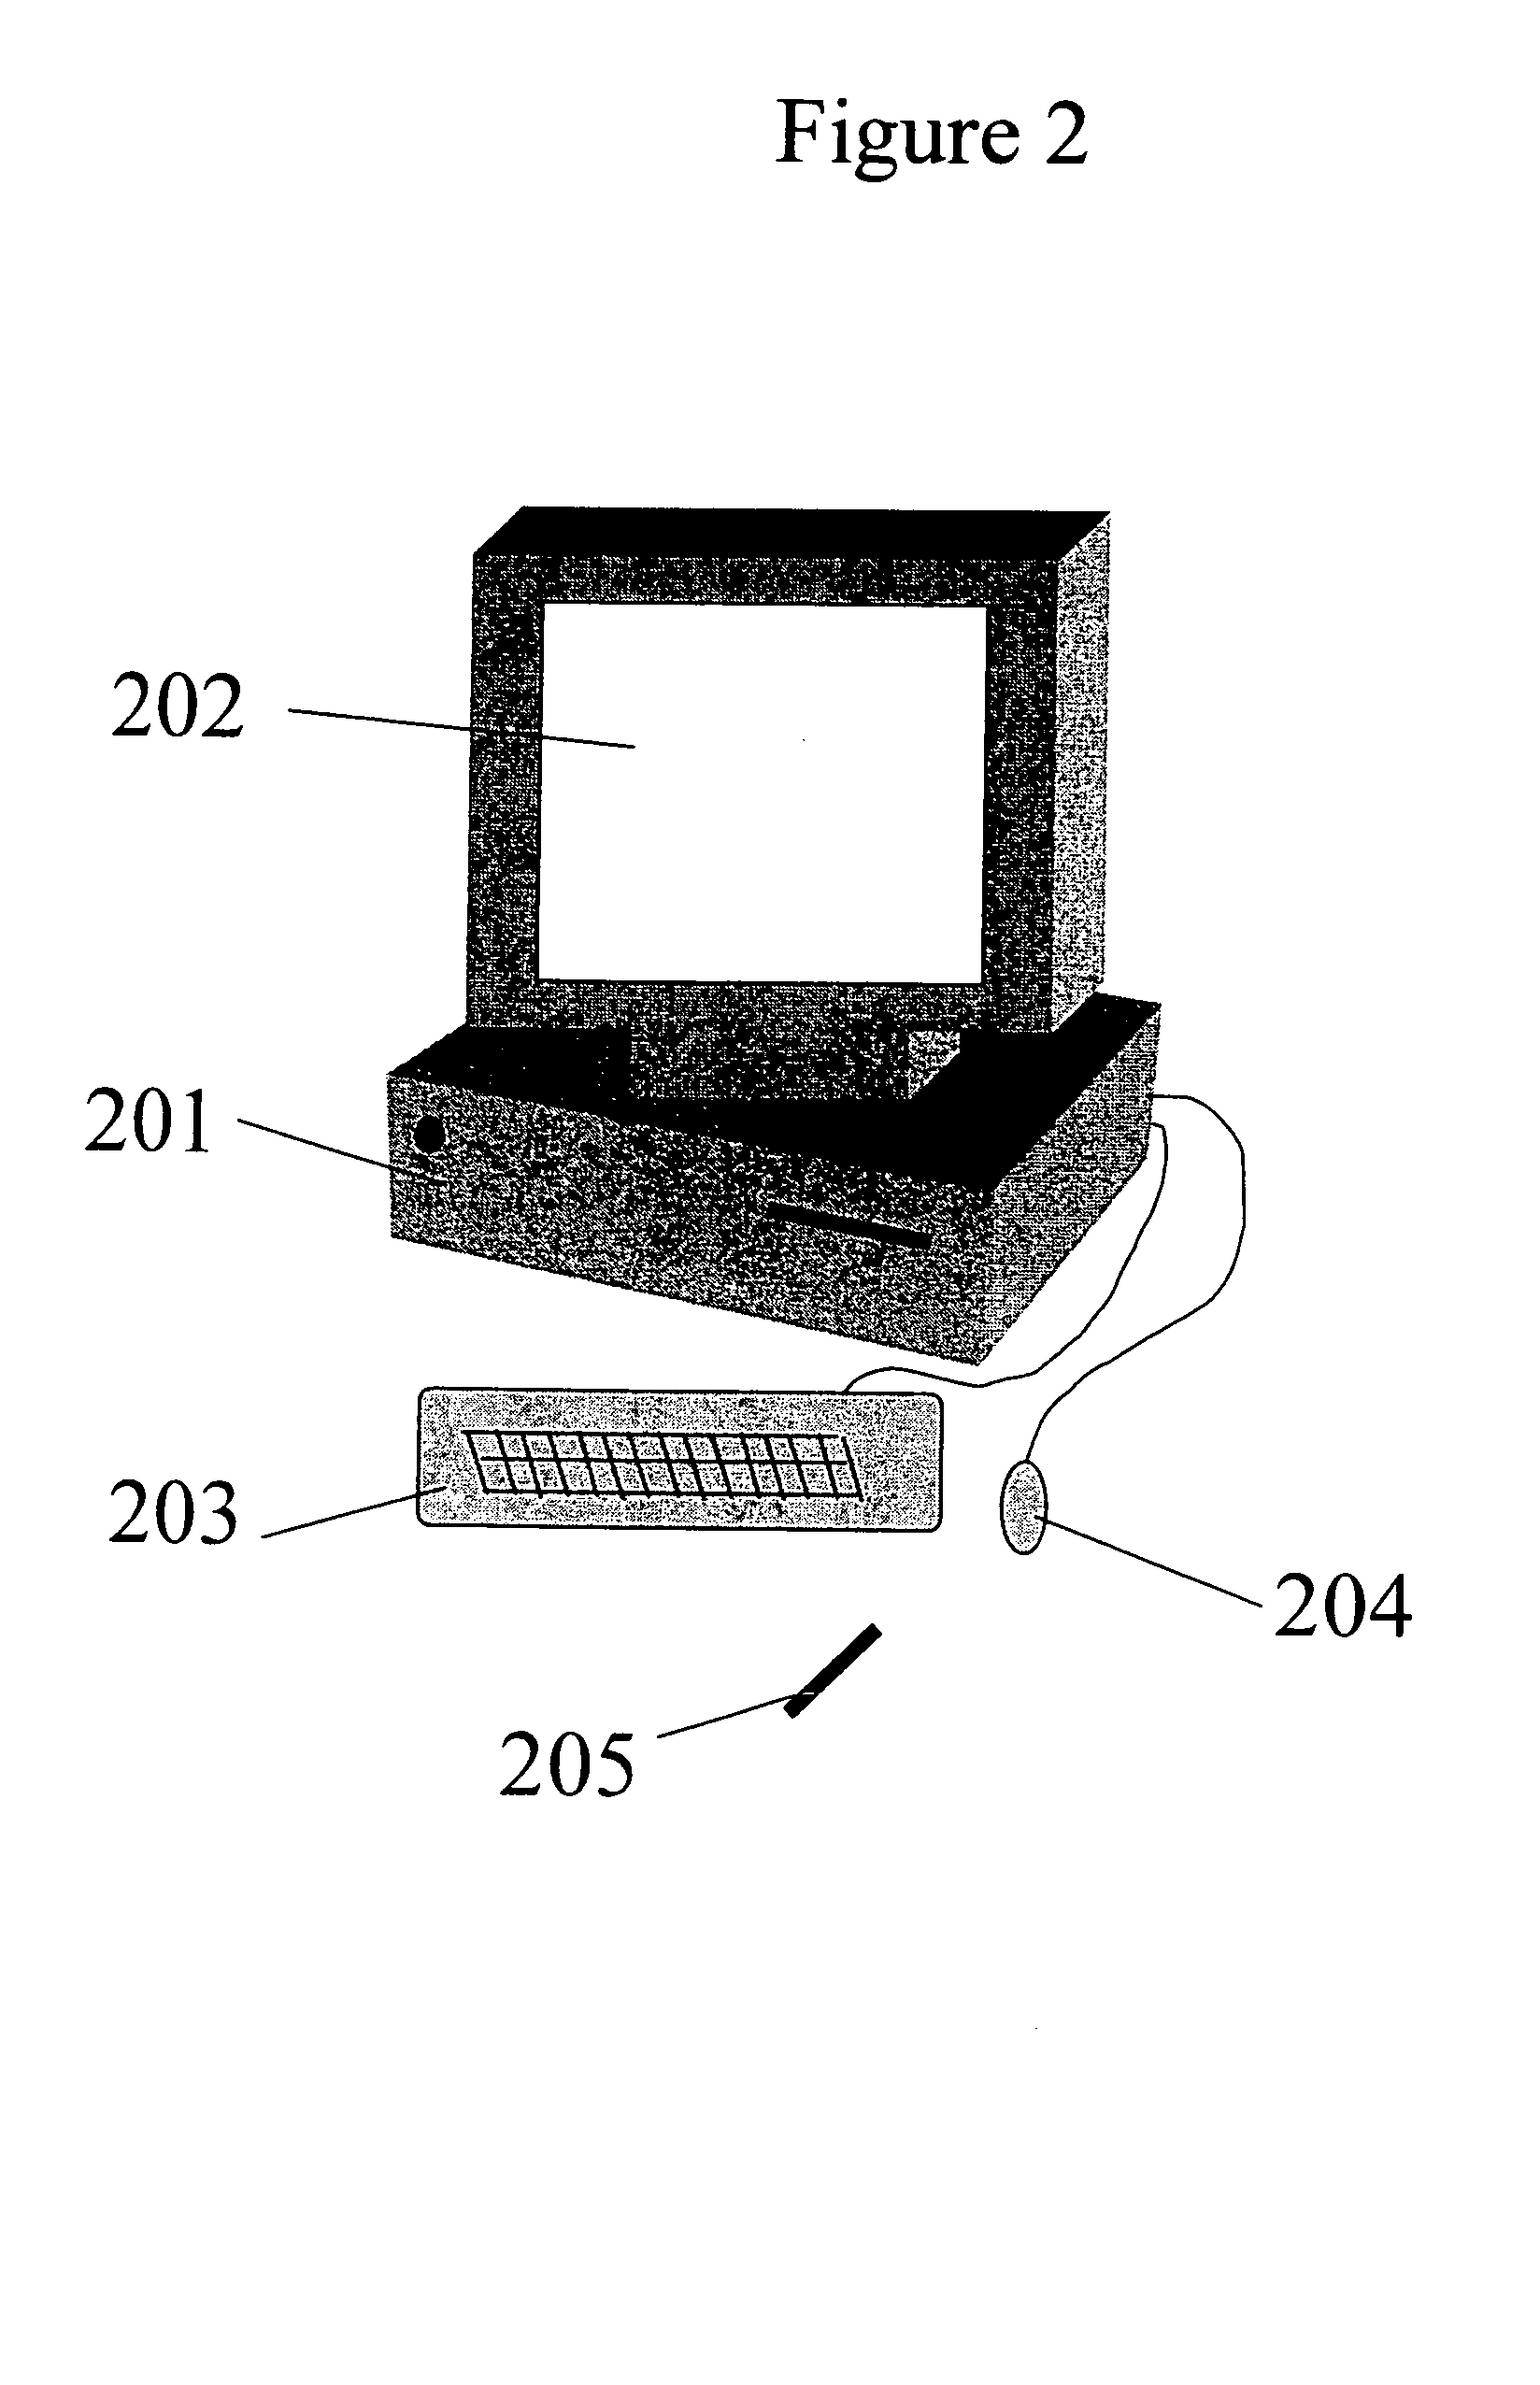
wireless networks), cables and conduit that connect such active items, and individual user terminals (such as mainframe or portable computers, handheld devices, Bluetooth devices, or other components (fixed or portable), that may be wired or wirelessly connected to a network) are used to send information from one place to another, and these are often difficult to physically detect.
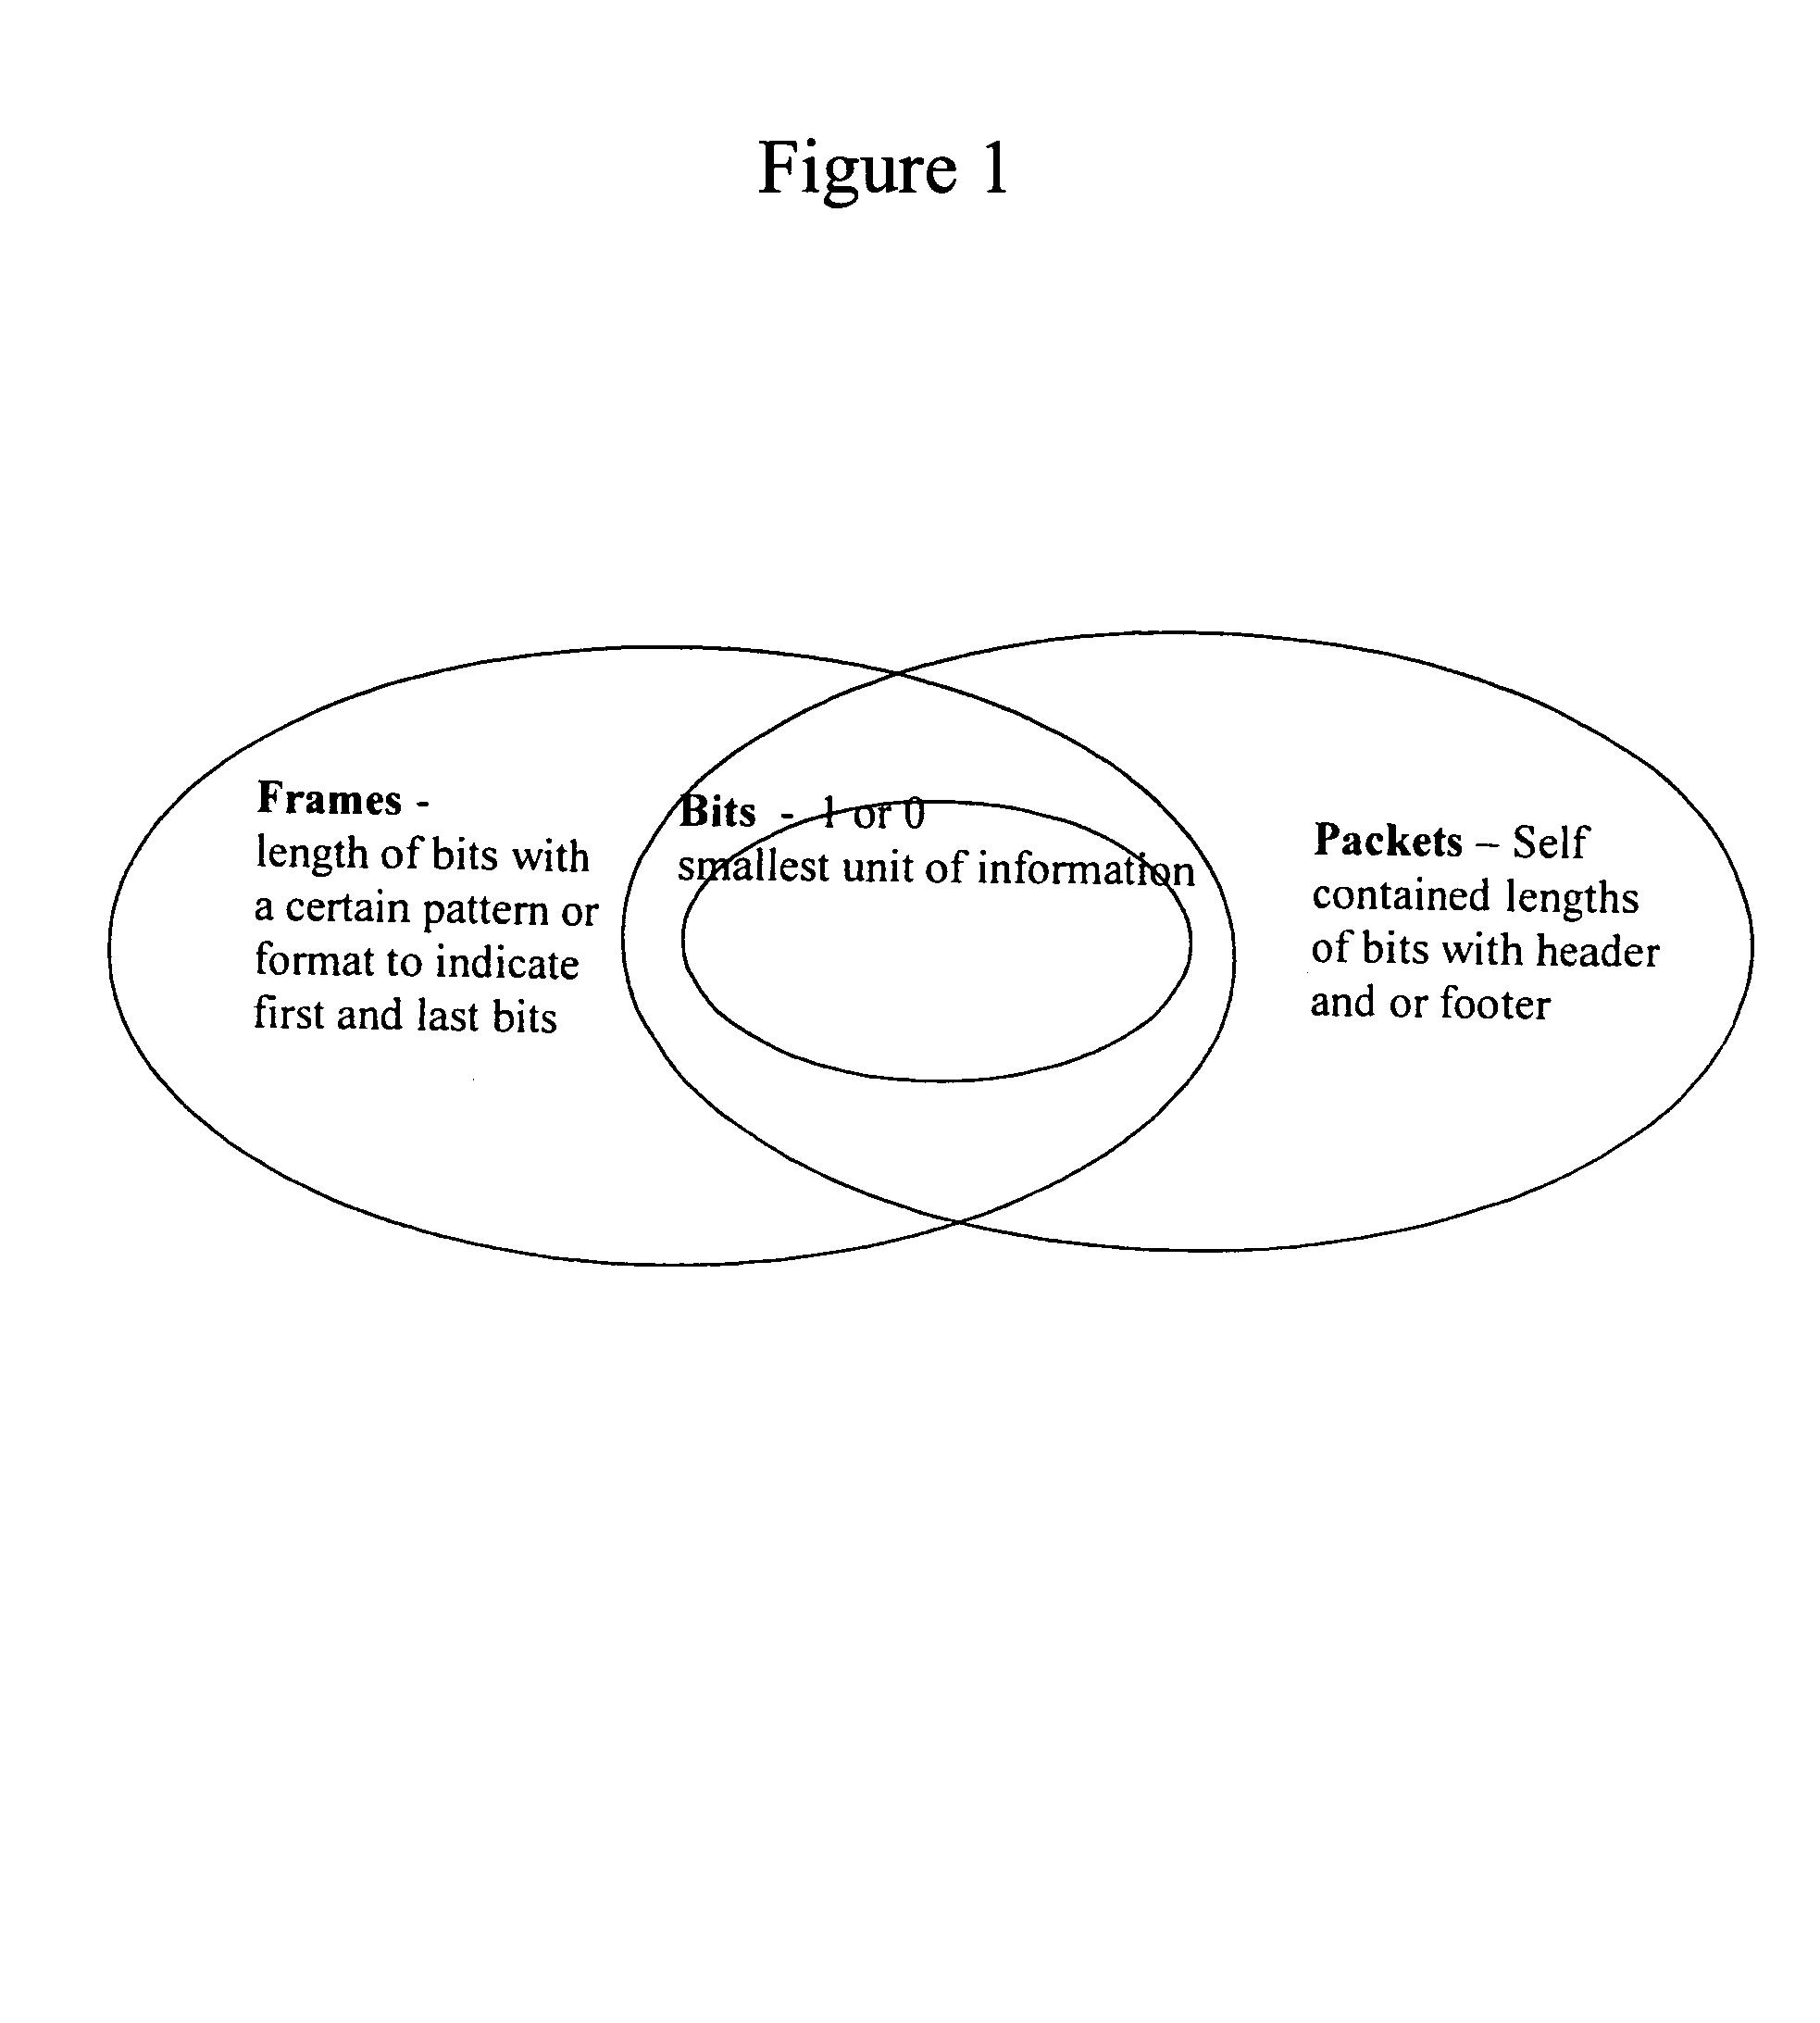
While conceptually simple, the means of transmitting the data from some point A to some point B can be complicated and may widely vary in implementation.
The exact performance of a given data communication network is extremely difficult to predict or even measure because of this complexity.
Depending on particular number of users, network delays outside of the campus, or movement or settings of equipment within a facility or a large area network, it is well known that there are a myriad of issues that may impact the performance of a communications network and the channels that carry the information between users of such a network.
A frame error rate is the percentage of frames that reach the receiver incorrectly or do not reach the receiver as compared to the number of packets sent.
Propagation delay is the time required for a packet to traverse a physical distance from the transmitter to the receiver.
Pathchar is only limited by the network hardware in the links it measures.
This means that hidden links that do not transmit acknowledgements such as Ethernet bridges cannot be measured individually by pathchar.
Furthermore, Smokoff et al do not provide any spatial information regarding the measurement or the measurement location.
Snider et al do not teach the concept of preprogramming, customizing, or recasting the text strings prior, during, or after measurements, nor do they teach the idea of graphical icons or textual strings being used to provide interpretation of measured information by an untrained or unskilled user.
In fact, Snider et al do not contemplate the use of graphical icons or text strings for the display or storeage of particular measured results.
Thus, Snider et al do not contemplate the use of graphical icons or textual strings by those with little technical knowledge, computer knowledge, or analytical ability.
Further, Snider does not contemplate spatially distributed measurements, or measurement cues, that allow a user to conduct a rapid survey of a spatially distributed network or group of objects by non-trained individuals.
Furthermore, Greenbaum et al do not contemplate the use of any spatial information regarding the measurement or the measurement location in their patent, nor do they contemplate the use of the diagram to drive the user to select a particular measurement type or location, or to be used by those with little technical knowledge, computer knowledge, or analytical ability.
In addition, Alexander does not consider the icon as providing any spatial information to the user as a cue for measurement position or location, nor does Alexander teach that the icon contains spatial information in the display of the measurement results.
Furthermore, Alexander does not teach the idea of allowing the graphical icons or textual strings to be arbitrarily preprogrammed or customized by the user prior to, during, or after measurement use, such that user is able to use icons that have no logical relation to the particular measurement being conducted.
The inventions, products, and patents cited above are useful for the design or measurement or analysis of the performance of communication networks and for other important measurement functions, such as in the medical field or in plant monitoring, but it is clear to one skilled in the art that it would be difficult for an untrained, unskilled worker to readily use the above listed products, inventions, or patents to rapidly conduct a field survey.
That is, while the above-mentioned products or devices may measure one or more of the aforementioned performance metrics and display those in some fashion for analysis, none of the aforementioned inventions, products, or patents provide the means to measure or store measured network performance such that each measurement reading or measurement instruction is associated with some form of textual or graphical identifier that can be used concurrently or at a later time for easy inspection or analysis of the data by a less-technical or untrained individual.

Method used


Image

  • Textual and graphical demarcation of location from an environmental database, and interpretation of measurements including descriptive metrics and qualitative values
  • Textual and graphical demarcation of location from an environmental database, and interpretation of measurements including descriptive metrics and qualitative values
  • Textual and graphical demarcation of location from an environmental database, and interpretation of measurements including descriptive metrics and qualitative values

Examples


Embodiment Construction

[0092]The present invention contemplates a system and method that provides the ability to measure, for example, the performance of communication networks, and the ability to associate each measurement reading with one or more textual strings and / or graphical icons. The present invention uses the textual strings and / or graphical icons to provide a user of the invention additional insight into the general location, network status, object status, or environment status at the instance the measurement reading was recorded. Such information may also be used at a later time, when the user later visualizes or compares the field measurements with past or future measurements. Given an image (e.g., raster image such as a bitmap, JPEG, TIFF, GIF, TGA, PCX, etc.), map, CAD file, or 2D or 3D model of a physical environment or any other information that constitutes a computer representation of a physical environment (all of which will hereafter be referred to as an “environmental model”), the pres...


PUM


Abstract

A computerized system allows for collecting data for a spatially distributed group of objects or networks by either skilled or unskilled personnel and for analyzing the collected data in an environmental database.

Description

CROSS-REFERENCE TO RELATED APPLICATIONS[0001]This application is related to U.S. Pat. No. 6,317,599 entitled “Method and System for Automated Optimization of Antenna Positioning in 3-D,” awarded to T. S. Rappaport et al, and pending applications Ser. No. 09 / 688,145 entitled “System and Method for Design, Tracking, Measurement, Prediction and Optimization of Data Communication Networks,” filed by T. S. Rappaport et al, and Ser. No. 09 / 221,985 entitled “System for Creating a Computer Model and Measurement Database of a Wireless Communication Network,” filed by T. S. Rappaport et al, the subject matter of which is incorporated herein by reference.BACKGROUND OF THE INVENTION[0002]1. Field of the Invention[0003]The invention relates to the field of measurement science and field measurements, and is generally related to the measurement, visualization, and storage of measurable characteristics of any spatially distributed group of objects or networks. Specifically, this invention relates t...

Claims


Application Information

Patent Timeline
Patent Type & Authority Patents(United States)
IPC IPC(8): G09G5/00G06F3/048H02G1/00H04L12/24
CPCH04L41/12H04L41/22H04L41/5009H04L43/0852H04L43/0823H04L41/5003G06F3/00
Inventor RAPPAPORT, THEODORESKIDMORE, ROGERHENTY, BENJAMIN
Owner EXTREME NETWORKS INC
Why Eureka
Try Eureka