Patient condition display

a patient condition and display technology, applied in the field of patient condition display, can solve the problems of difficult to see at a glance whether the patient's condition is normal, difficult to provide a satisfactory solution, etc., and achieve the effects of reducing blood pressure, reducing heart rate, and early detection of deterioration in the patient's condition

Inactive Publication Date: 2006-04-18
OXFORD BIOSIGNALS
View PDF14 Cites 220 Cited by
  • Summary
  • Abstract
  • Description
  • Claims
  • Application Information

AI Technical Summary

Benefits of technology

[0005]In addition the clinical significance of changes of different degree in the different parameters may differ. For instance, a small percentage change in temperature may be much more significant than a small percentage change in blood pressure, or a change in respiration rate may be more significant than a similar change in heart rate. This relative significance may vary depending on the patient's medical problem. Further, the fact that a change in condition may be reflected in one or more parameters and in different ways for different patients and different medical conditions, means that it is very difficult to provide a satisfactory solution by, for instance, simply setting thresholds on each of the displayed parameters. A significant change in condition may be reflected by combinations of parameters, for instance decrease in heart rate combined with a decrease in blood pressure may be serious even though the values per se are not abnormal. It should be noted, though, that the early detection of deterioration in a patient's condition can significantly improve the clinical outcome, and reduce the need for later intensive care, which is thus beneficial both for the patient and for the clinician.
[0006]The present invention provides for the display of parameters representing a patient's condition in a simplified way, and which allows the changes in a patient's condition to be seen easily. For instance, the departure of a patient's condition from normality, defined either for that patient or for a group of patients, may be displayed, or equally the progress of a patient from an abnormal condition to a normal condition or vice versa.

Problems solved by technology

However, even with such a wealth of data available to the clinician (or possibly because of it), it can be difficult to see at a glance whether the patient's condition is normal, changing for the better, or, more seriously, for the worse.
Further, the fact that a change in condition may be reflected in one or more parameters and in different ways for different patients and different medical conditions, means that it is very difficult to provide a satisfactory solution by, for instance, simply setting thresholds on each of the displayed parameters.
Obviously when a patient is first-monitored there is insufficient data to train the neural network with data from that particular patient, thus there may be no alternative but to use a neural network trained on a group of patients.

Method used


Image

  • Patient condition display
  • Patient condition display
  • Patient condition display

Examples


Embodiment Construction

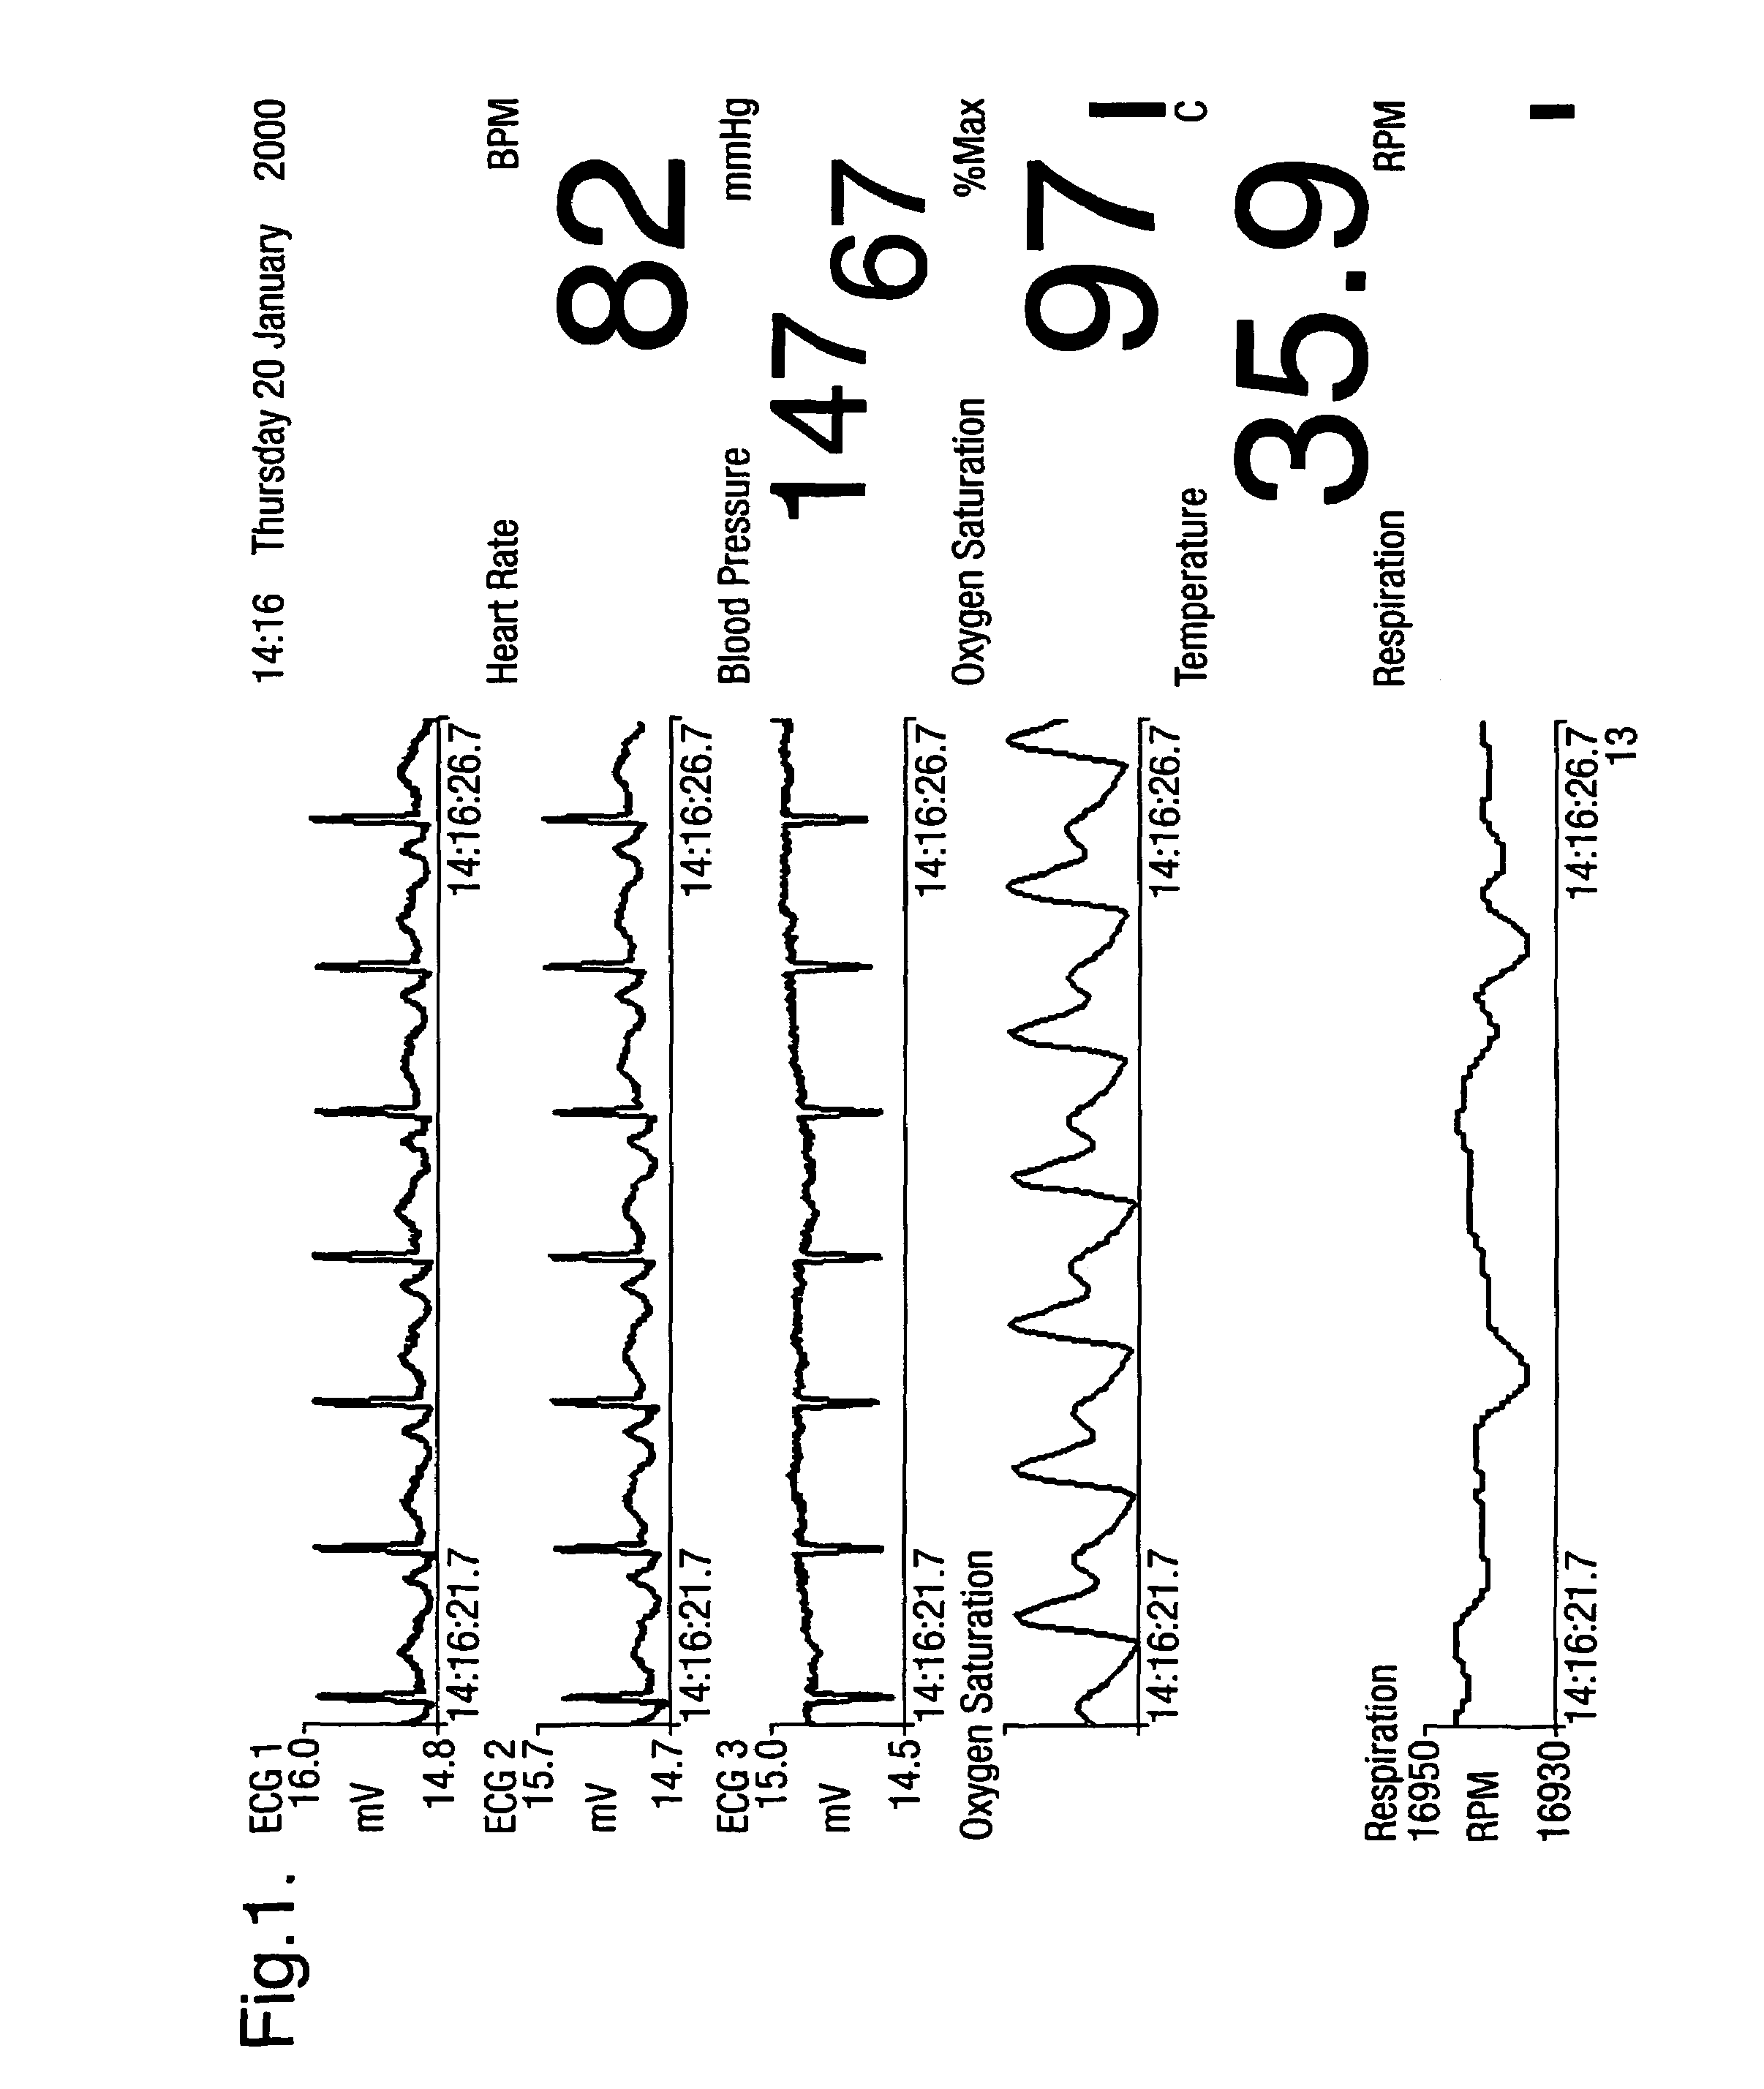
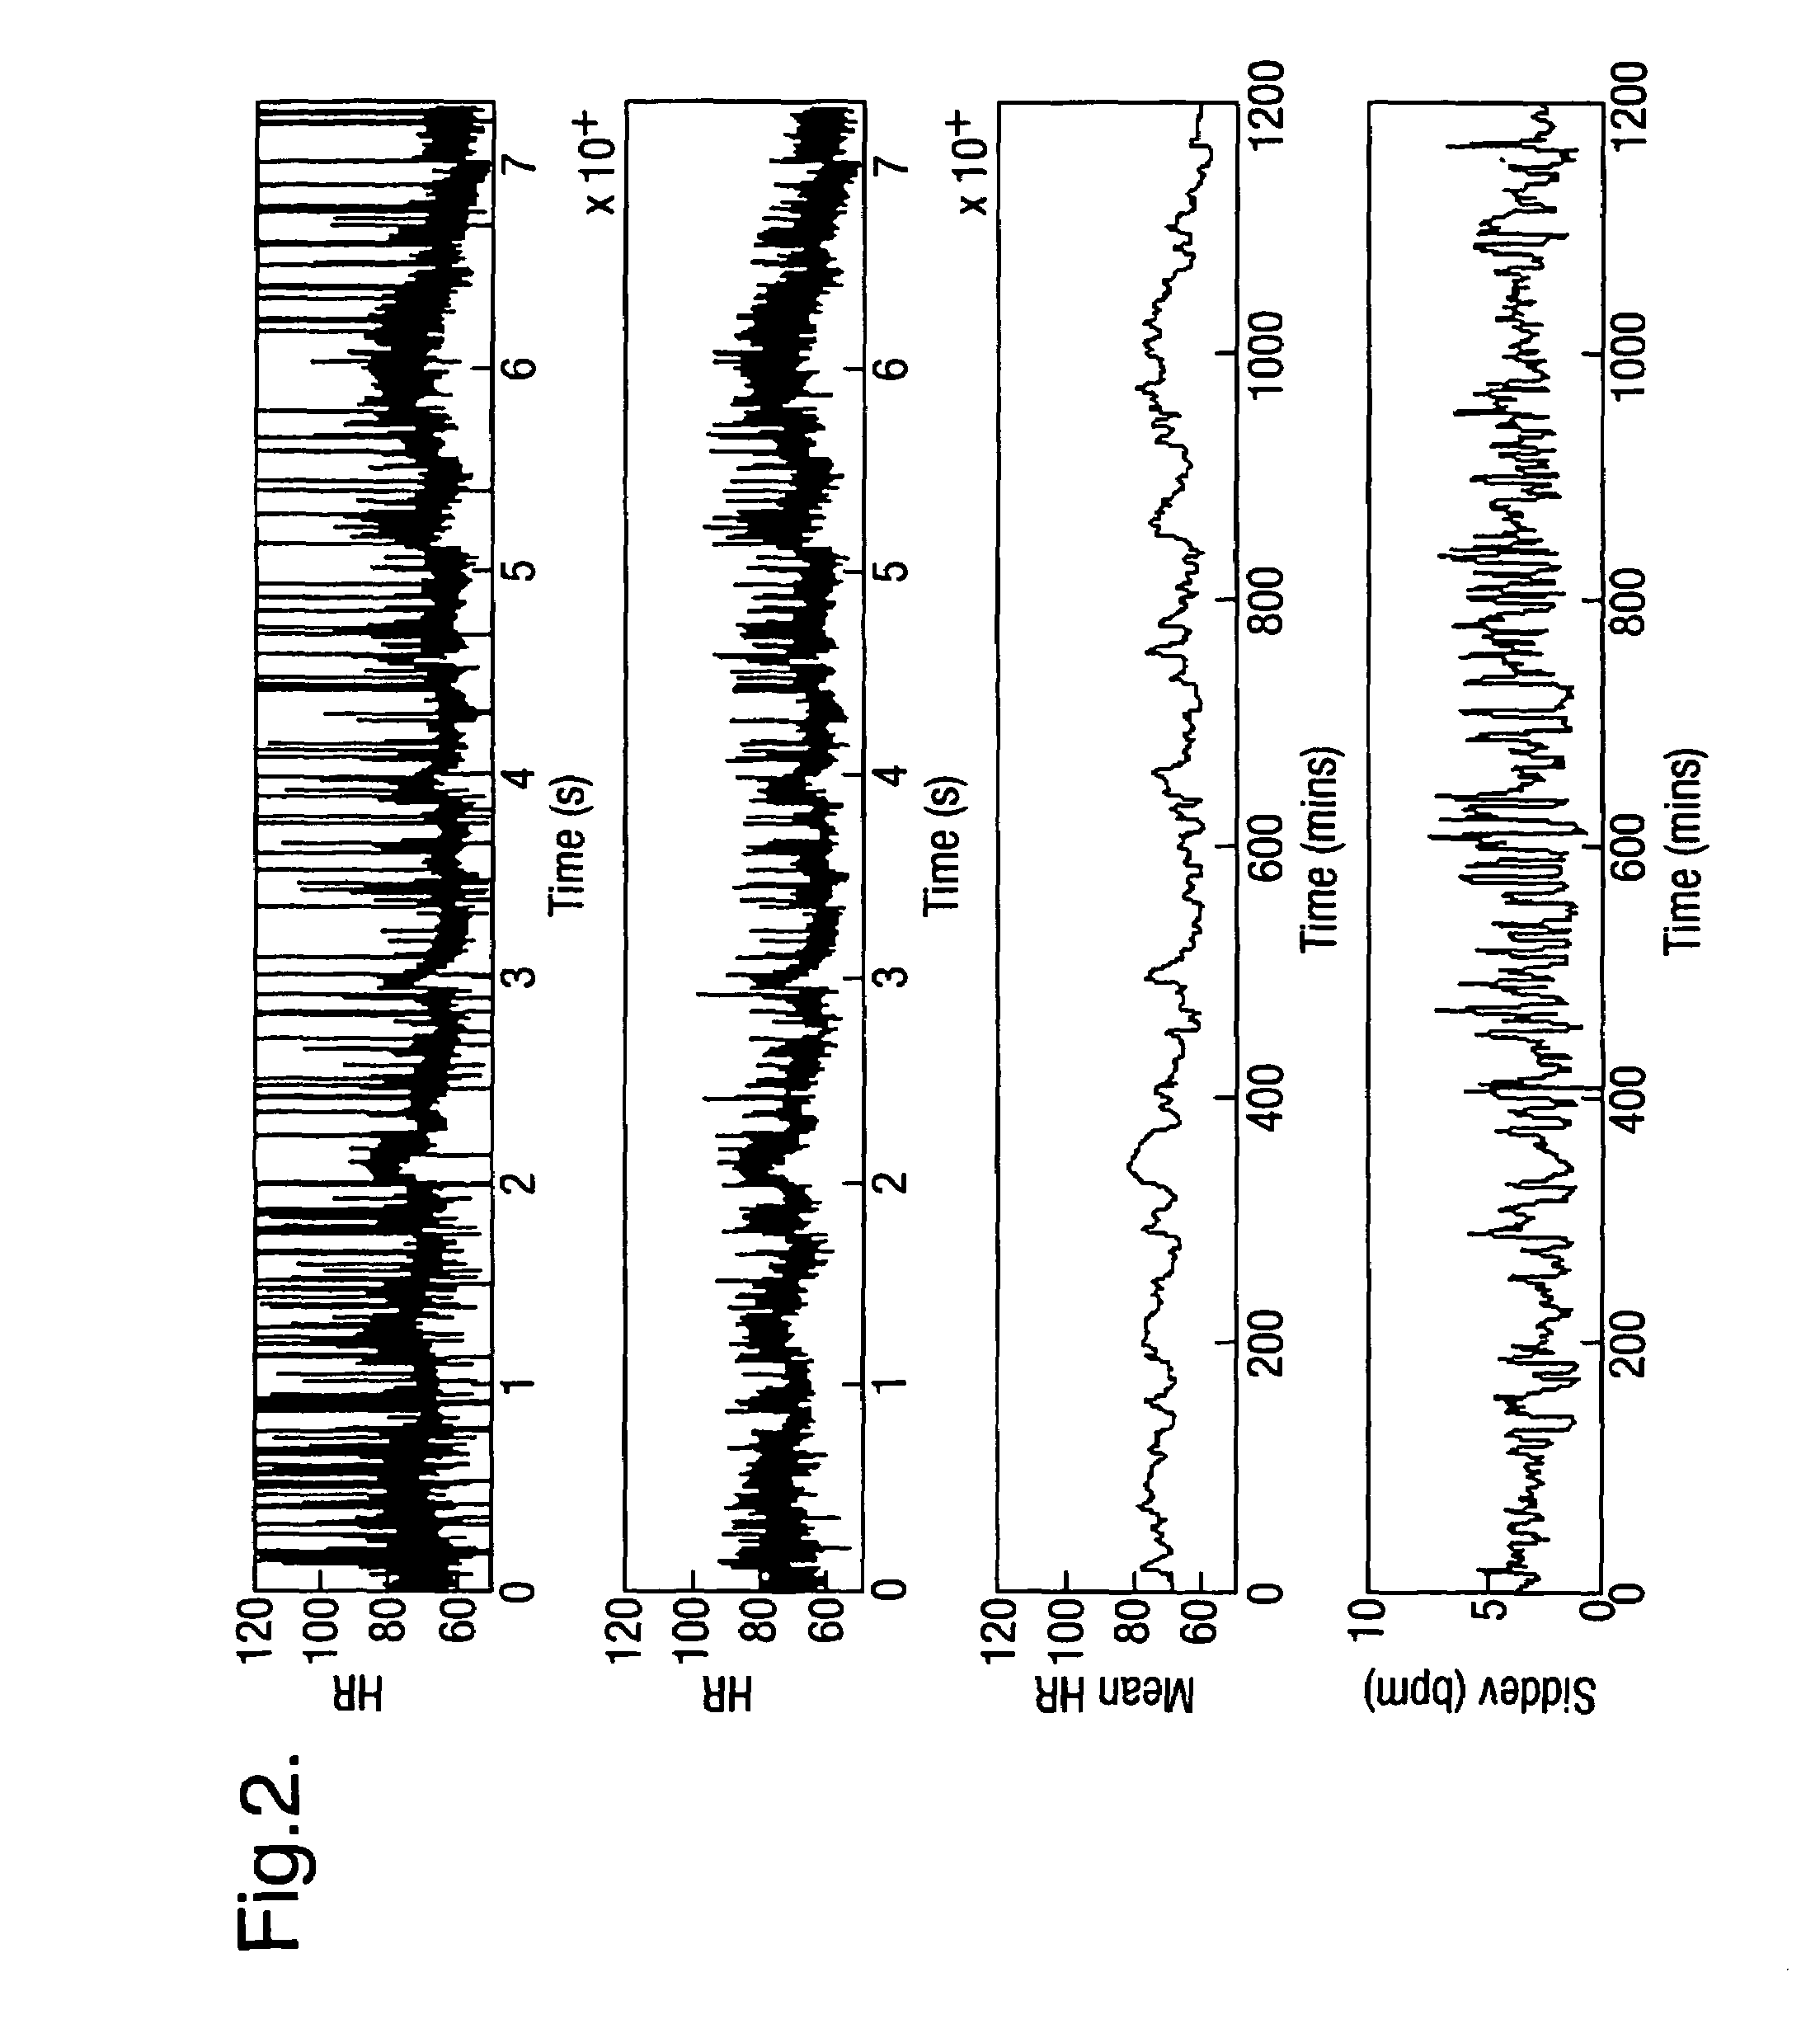
[0040]FIG. 1 illustrates the graphical display from an integrated patient condition monitor. As can then be seen, three channels of ECG, ECG 1, 2 and 3, are shown, together with the oxygen saturation waveform and the respiration waveform. In addition, the values for the non-invasive blood pressure, oxygen saturation waveform and temperature are also shown, together with a measurement of the heart rate, which may be derived from the ECG, the oxygen saturation waveform, or a combination of them. These measurements may be supplemented by other measurements relevant to particular groups of patients. It is known, for instance, that for some group of patients the heart rate variability is an important measurement of patient condition. FIG. 2 illustrates two traces for the heart rate: (i) the raw heart rate, including the sharp spikes associated with the occurrence of ectopic beats, (ii) the filtered heart rate (after the ectopic beats have been removed), a five minute mean heart rate, and...


PUM


Abstract

Data from a plurality of sensors representing a patient's condition, including measurement signals and also secondary parameters derived from the measurement signals, are displayed in a simple way by calculating a novelty index constituting a one-dimensional visualization space. The novelty index is based on the distance of the current data point in a multi-dimensional measurement space, whose coordinates are defined by the values of the measurement signals and secondary parameters, from a predefined normal point. This may be achieved by using a suitably trained artificial neural network to sum the distance between the current data point in the measurement space and a plurality of prototype points representing normality.

Description

[0001]This application is the US national phase of international application PCT / GB02 / 02550, filed in English on 29 May 2002, which designated the US. PCT / GB02 / 02550 claims priority to GB Application No. 0113212.5 31 May 2001. The entire contents of these applications are incorporated herein by reference.[0002]This invention relates to the display of a graphical representation of a patient's condition, and in particular to displaying the results of measurements from a variety of sources in a way which allows the patient's overall condition to be recognised easily.BACKGROUND AND SUMMARY[0003]The condition of patients, particularly, in high dependency care or intensive care, is monitored in a variety of ways. For instance, vital signs such as one or more channels of electrocardiogram (ECG), respiration (for instance measured by electrical impedance pneumography), oxygen saturation (for instance measured by pulse oximetry with a finger probe), blood pressure and skin temperature may al...

Claims


Application Information

Patent Timeline
Patent Type & Authority Patents(United States)
IPC IPC(8): G01R13/02A61B5/00A61B5/0205G01F19/00G16H30/40G16H50/20
CPCA61B5/0205A61B5/7267A61B5/7445G06F19/345G06F19/3406G06F19/3443G06F19/321A61B5/742G16H40/63G16H50/70G16H50/20G16H30/40
Inventor TARASSENKO, LIONELTOWNSEND, NEIL WILLIAM
Owner OXFORD BIOSIGNALS
Why Eureka
Try Eureka