
System and method for providing composite variance analysis for network operation

a network operation and variance analysis technology, applied in the field of information network performance, can solve the problems of difficult to fully diagnose performance, difficult to determine the performance of a network over time, and difficult to detect and predict the cycle of network operation, and achieve the effect of meaningful and straightforward interpretation

Inactive Publication Date: 2006-06-27
COLORADO WSC LLC
View PDF5 Cites 61 Cited by
  • Summary
  • Abstract
  • Description
  • Claims
  • Application Information

AI Technical Summary

Benefits of technology

[0032]What is needed is a system for measuring network performance metrics which allows a user to take into account network conditions, such a traffic load, when analyzing the measurement. Also, the system should allow a user to be able to make predictions about network performance at a given time. Additionally, such a system should be automated and should be able to analyze and present measurement results in a manner which is meaningful and straightforward to interpret.
[0033]A system and method in accordance with the pr

Problems solved by technology

However, while important diagnostic information can be collected about the current status of a particular web page or streaming media service by making individual or random measurements of one or more of the above noted network performance metrics, it can be difficult to use this testing method to fully diagnose performance.
For example, using such techniques it can be difficult to determine the performance of a network over time or during certain times of the day, days of the week, or parts of the year.
Thus, it can be difficult to detect, and predict, cycles in network operation, such as if a network operates more and less rapidly on a periodic basis.
Without such information, individual measurements may be misleading.
For example, an unsatisfactory results of such measurements may be caused by high or low network traffic load, rather than a specific problem with a network device.
Also, using the above described standard techniques, it can be difficult to provide any type of predictive event correlation.
That is, there is no way for a system that does no more than take measurements of network performance metrics to notify a user if a artwork is not operating correctly because there is no baseline or other reference available to the system to make such a determination.

Method used


Image

  • System and method for providing composite variance analysis for network operation
  • System and method for providing composite variance analysis for network operation
  • System and method for providing composite variance analysis for network operation

Examples


Embodiment Construction

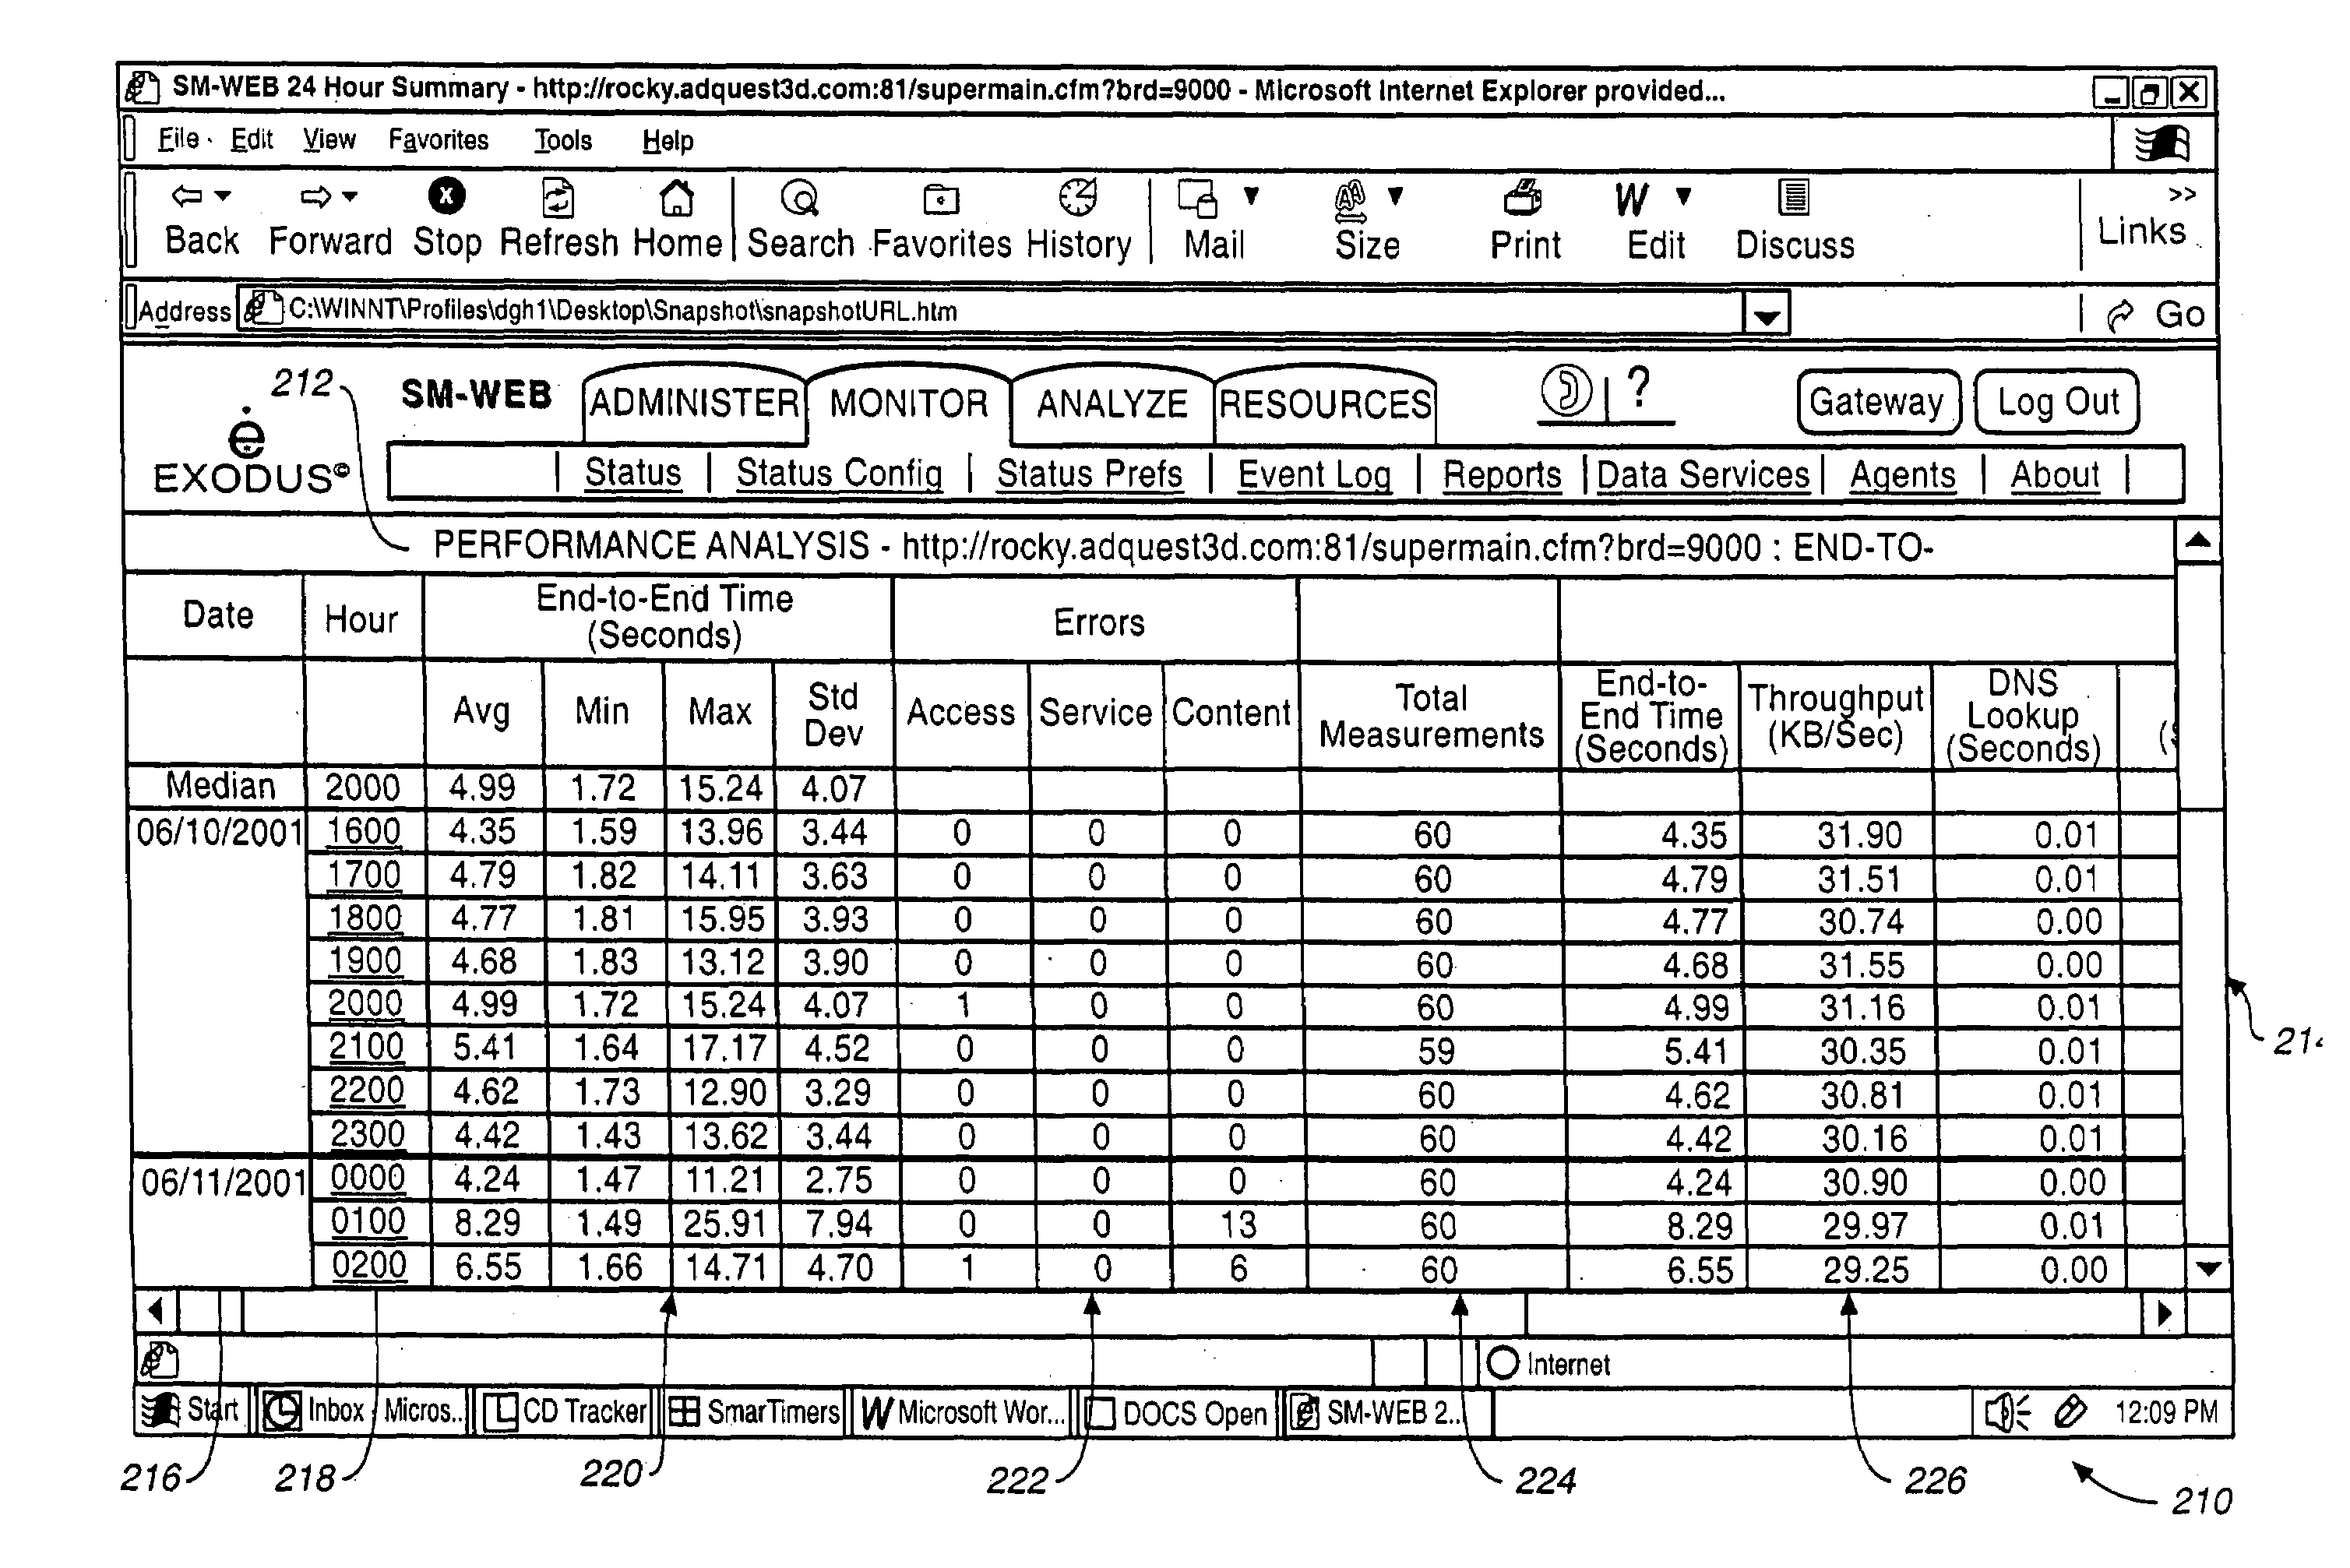
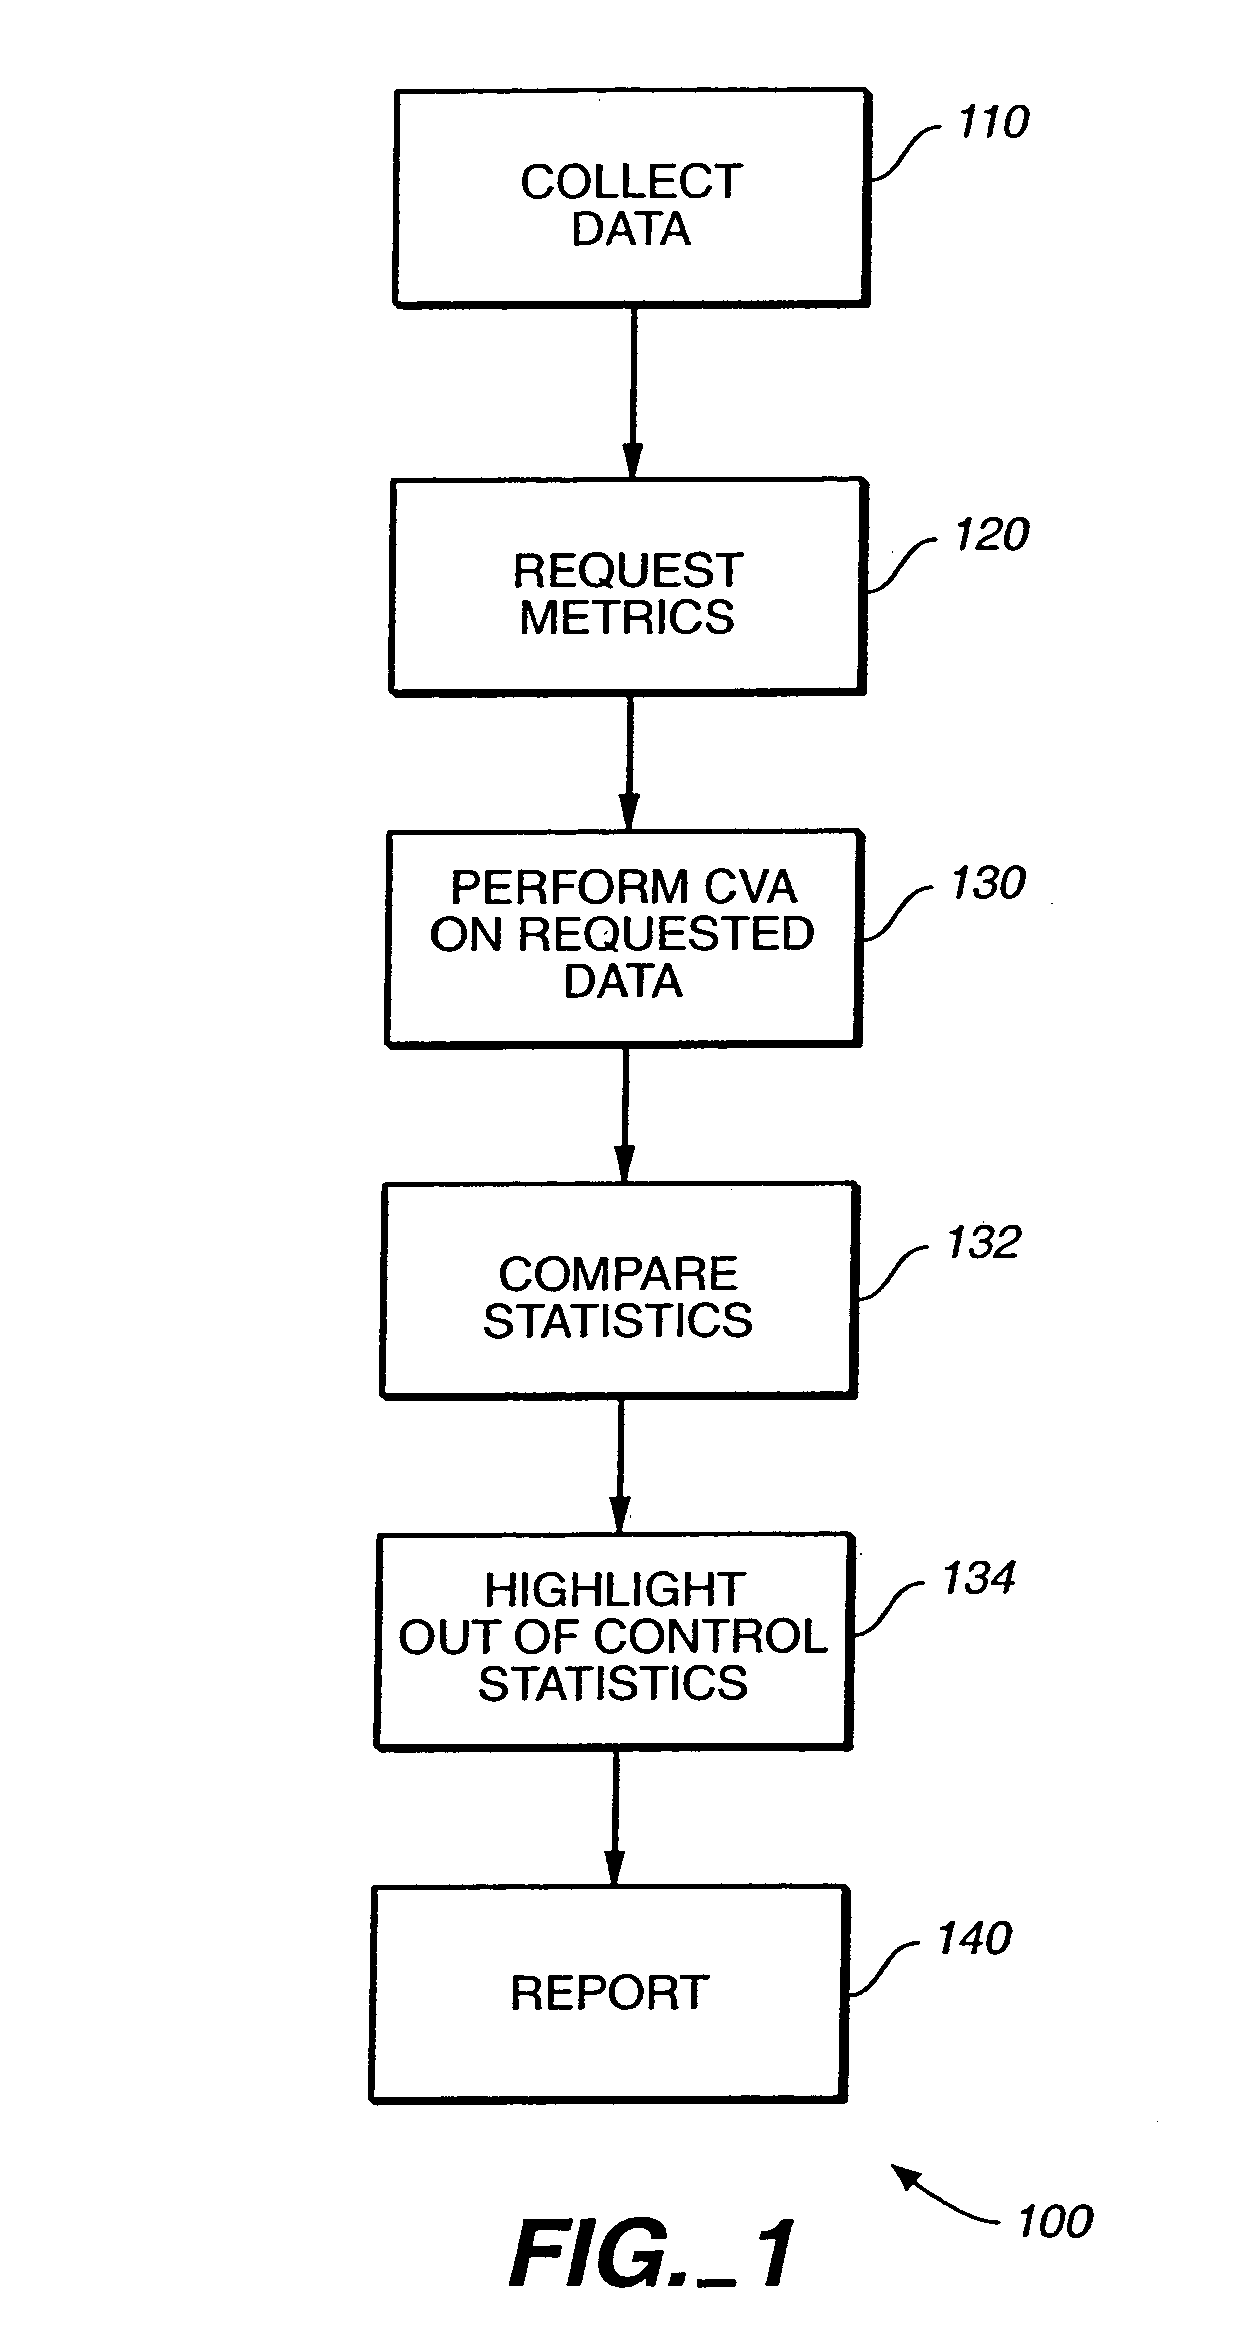
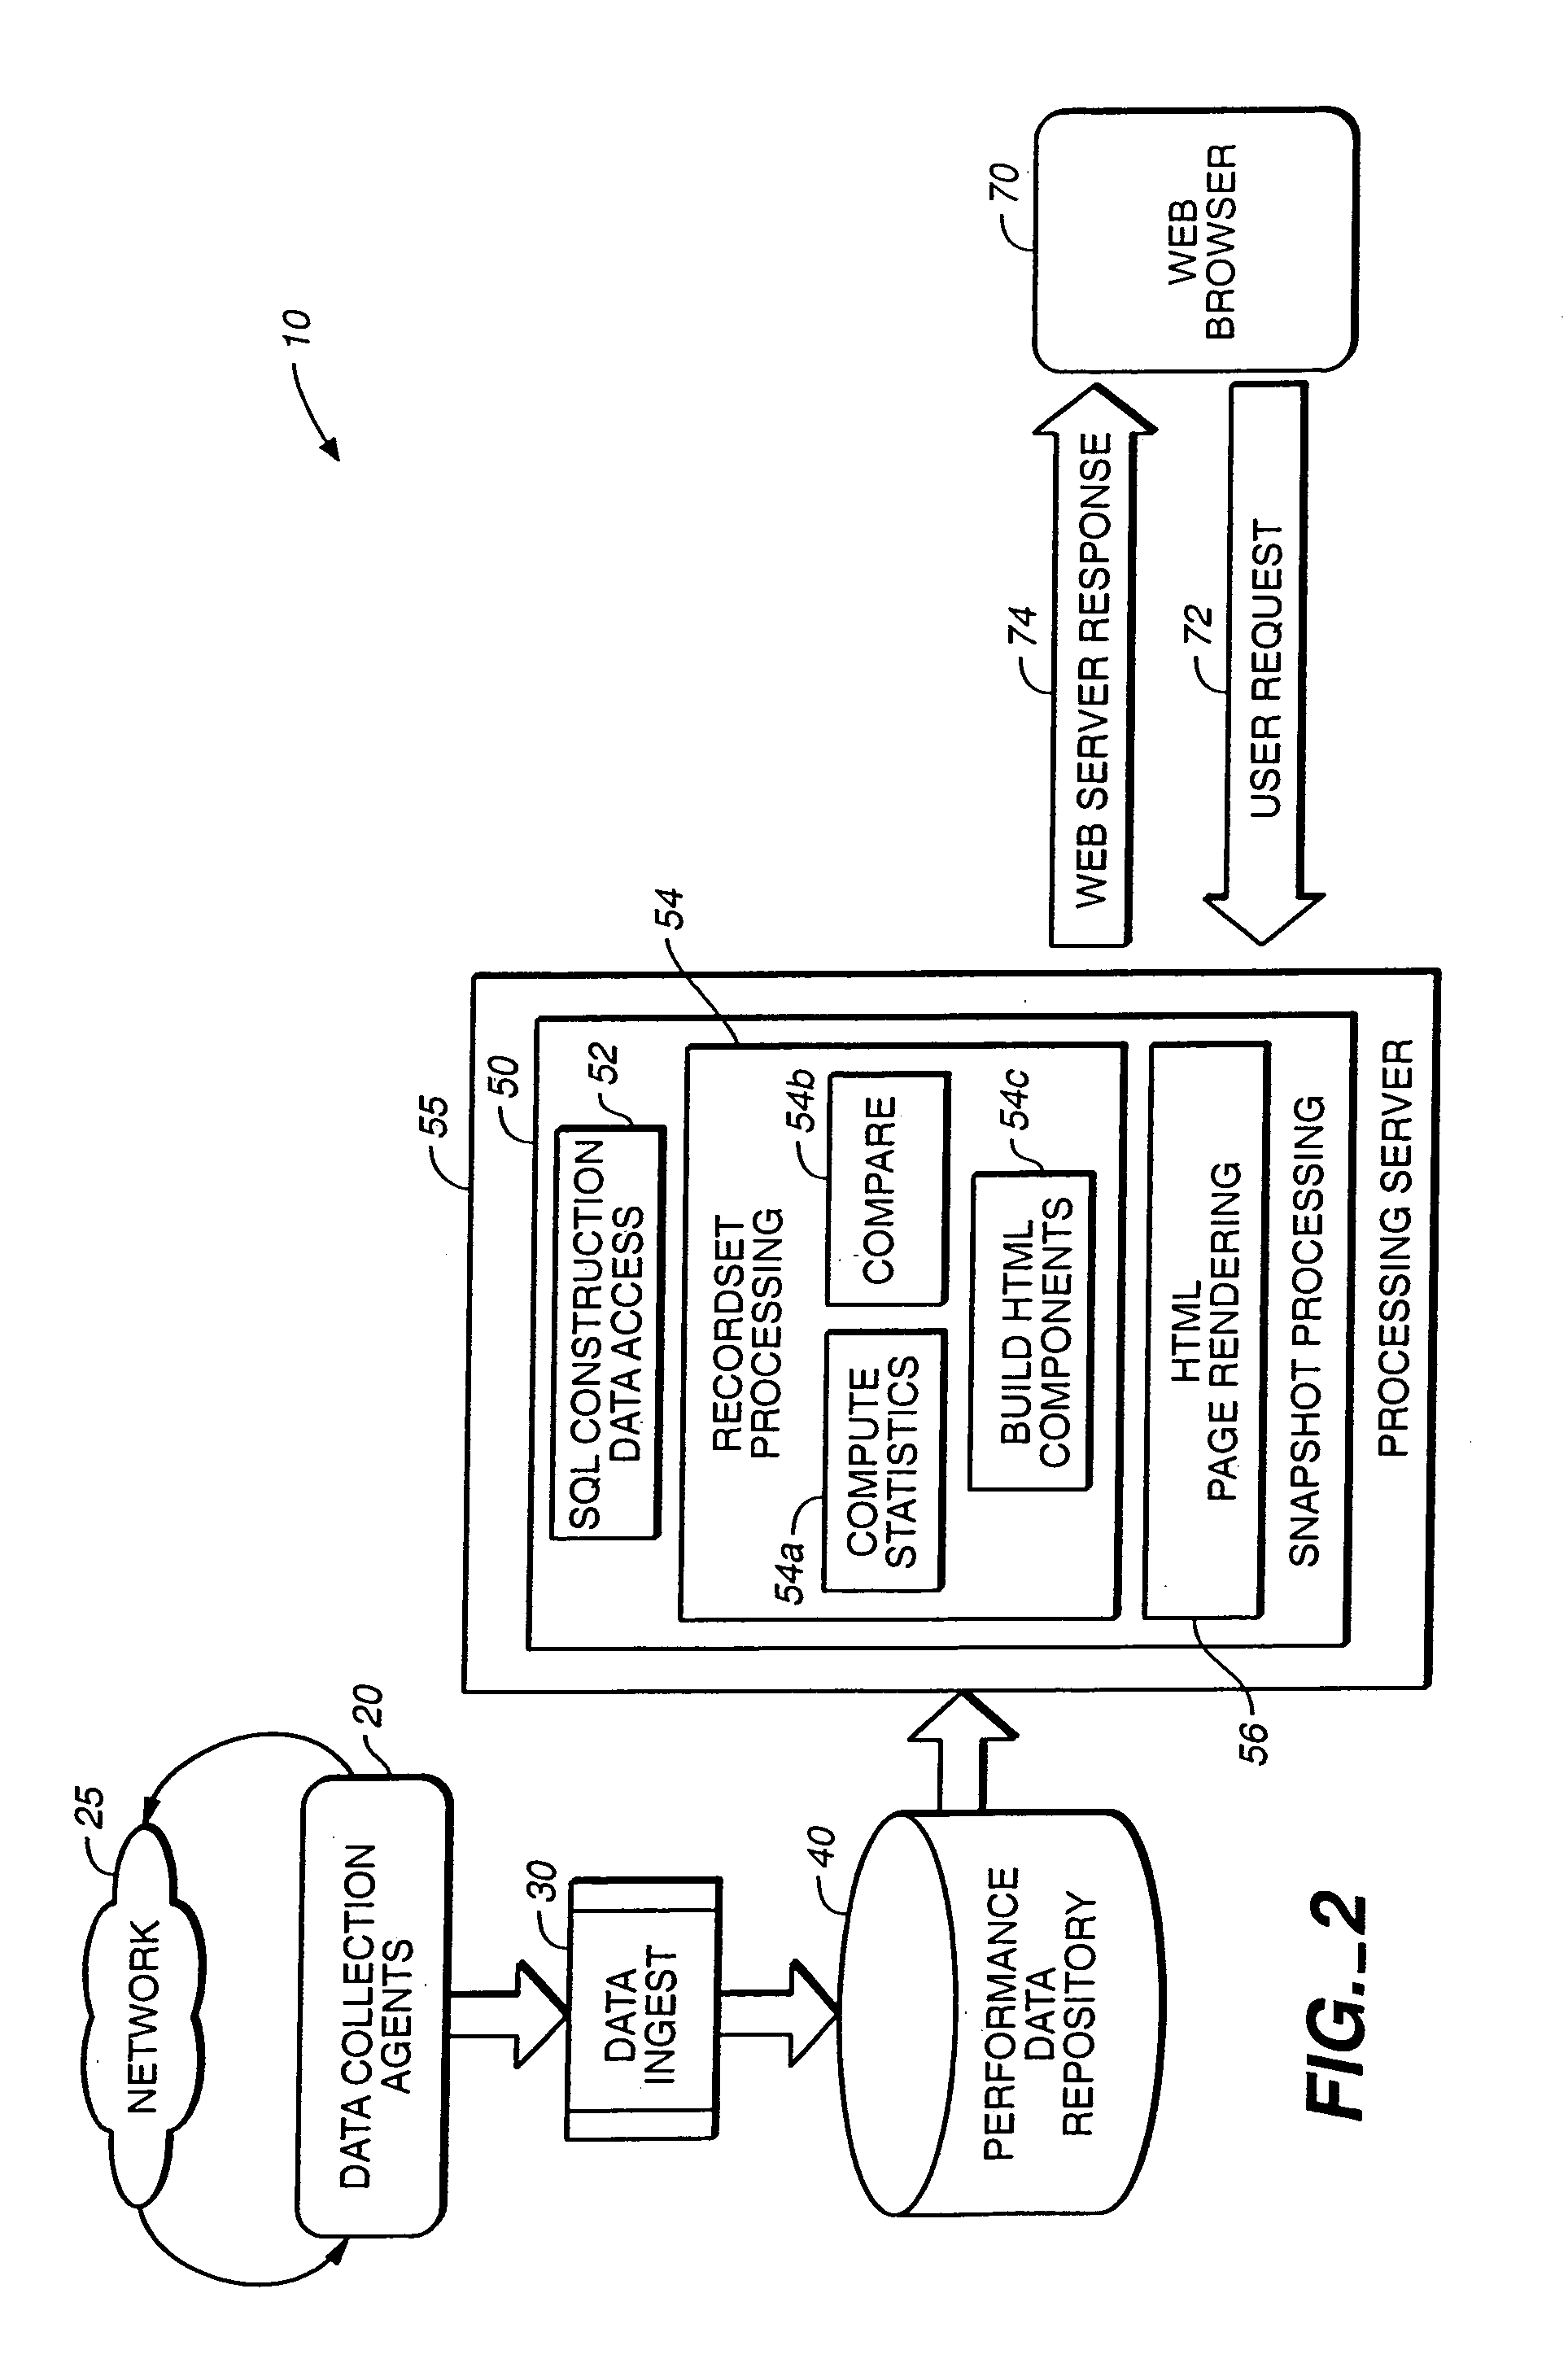
[0041]A system and method in accordance with the present invention collects measurements of network performance metrics and automatically calculates and provides composite variance analysis of such metrics. The system and method can then use history of performance data statistics to alert a user about performance of network services that are outside acceptable tolerance or control limits. That is, a system and method in accordance with the present invention collects raw data including a set of periodic measurements of at least a single network performance metric such as, without limitation, end-to-end time or throughput of at least a single network service. Composite variance analysis is then completed on this set of measurements. The results of this analysis are preferably values such as the average, mean, median, minimum, maximum and standard deviation (referred to collectively herein as variance statistics) of the group of periodic measurements of the single metric. The data coll...


PUM


Abstract

A system for analyzing the performance of a network includes a data collection agent that collects performance data including first and second sets of measurements of a single network parameter. First and second variance statistics are calculated. A user is alerted about potential network performance problems based on whether a predetermined relationship exists between the variance statistics. The user may be notified by sending an e-mail to the user; and / or sending a fax to the user; and / or initiating a phone call to the user. The user may be alerted by a message to a PDA or a cellular telephone.

Description

RELATED APPLICATIONS[0001]This application claims priority to and is a continuation of U.S. patent application Ser. No. 09 / 906,288, filed Jul. 16, 2001, now U.S. Pat. No. 6,708,137, issued Mar. 16, 2004, which is incorporated herein in its entirety.TECHNICAL FIELD[0002]The present invention relates to performance of information networks. In particular the present invention relates to statistical measurements of performance characteristics of an information network.BACKGROUND[0003]Internet web sites continue to become more sophisticated and offer a wider variety of media for a user to access. With this trend, users have become more demanding of quick, high quality Internet experiences. As such, to be able to keep up with user's demands, it has become increasingly important for the providers of Internet content to be able to monitor and troubleshoot Internet performance issues to both avoid degraded performance and provide improved performance.[0004]Given this, systems have been devel...

Claims


Application Information

Patent Timeline
IPC IPC(8): G06F11/34H04L12/24
CPCH04L41/142H04L43/12H04L41/22
Inventor CARLEY, STEPHEN
Owner COLORADO WSC LLC
Learn More