Low coherent interference fringe analysis method
a fringe analysis and low coherent interference technology, applied in the direction of optical apparatus testing, optical radiation measurement, instruments, etc., can solve the problem of lowering the measurement speed, and achieve the effect of high speed
- Summary
- Abstract
- Description
- Claims
- Application Information
AI Technical Summary
Benefits of technology
Problems solved by technology
Method used
Image
Examples
first embodiment
[0024
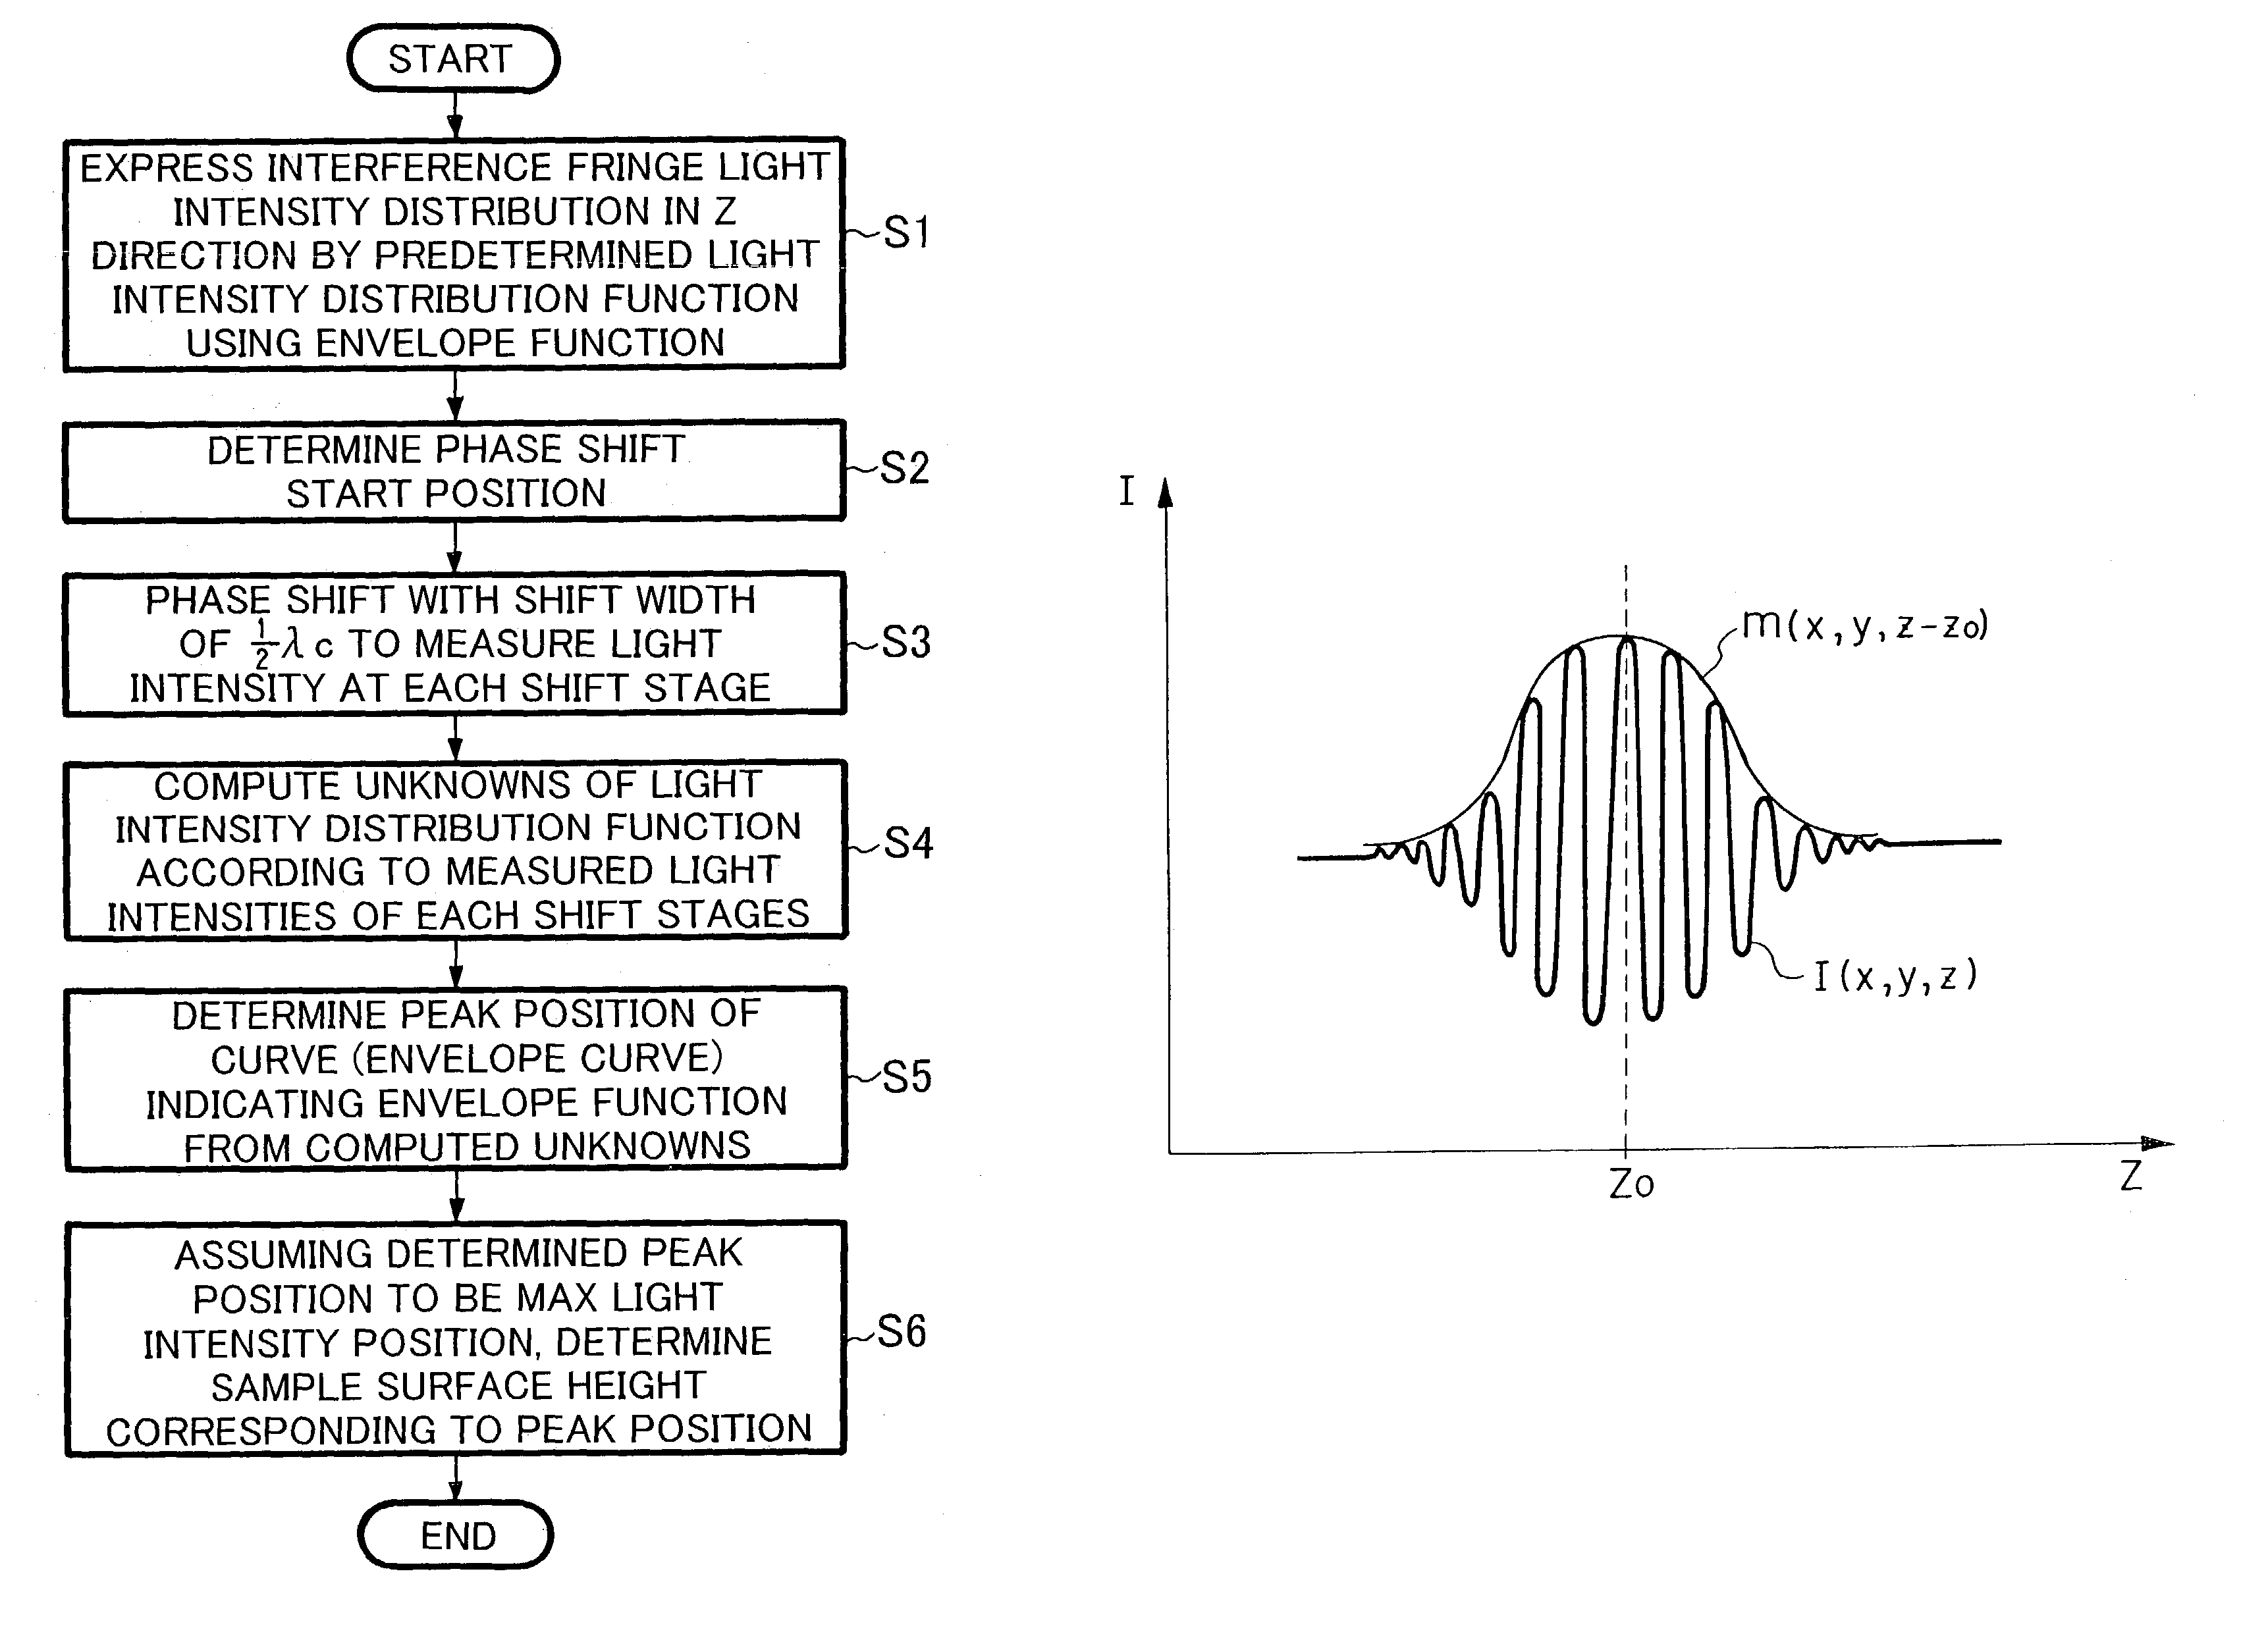
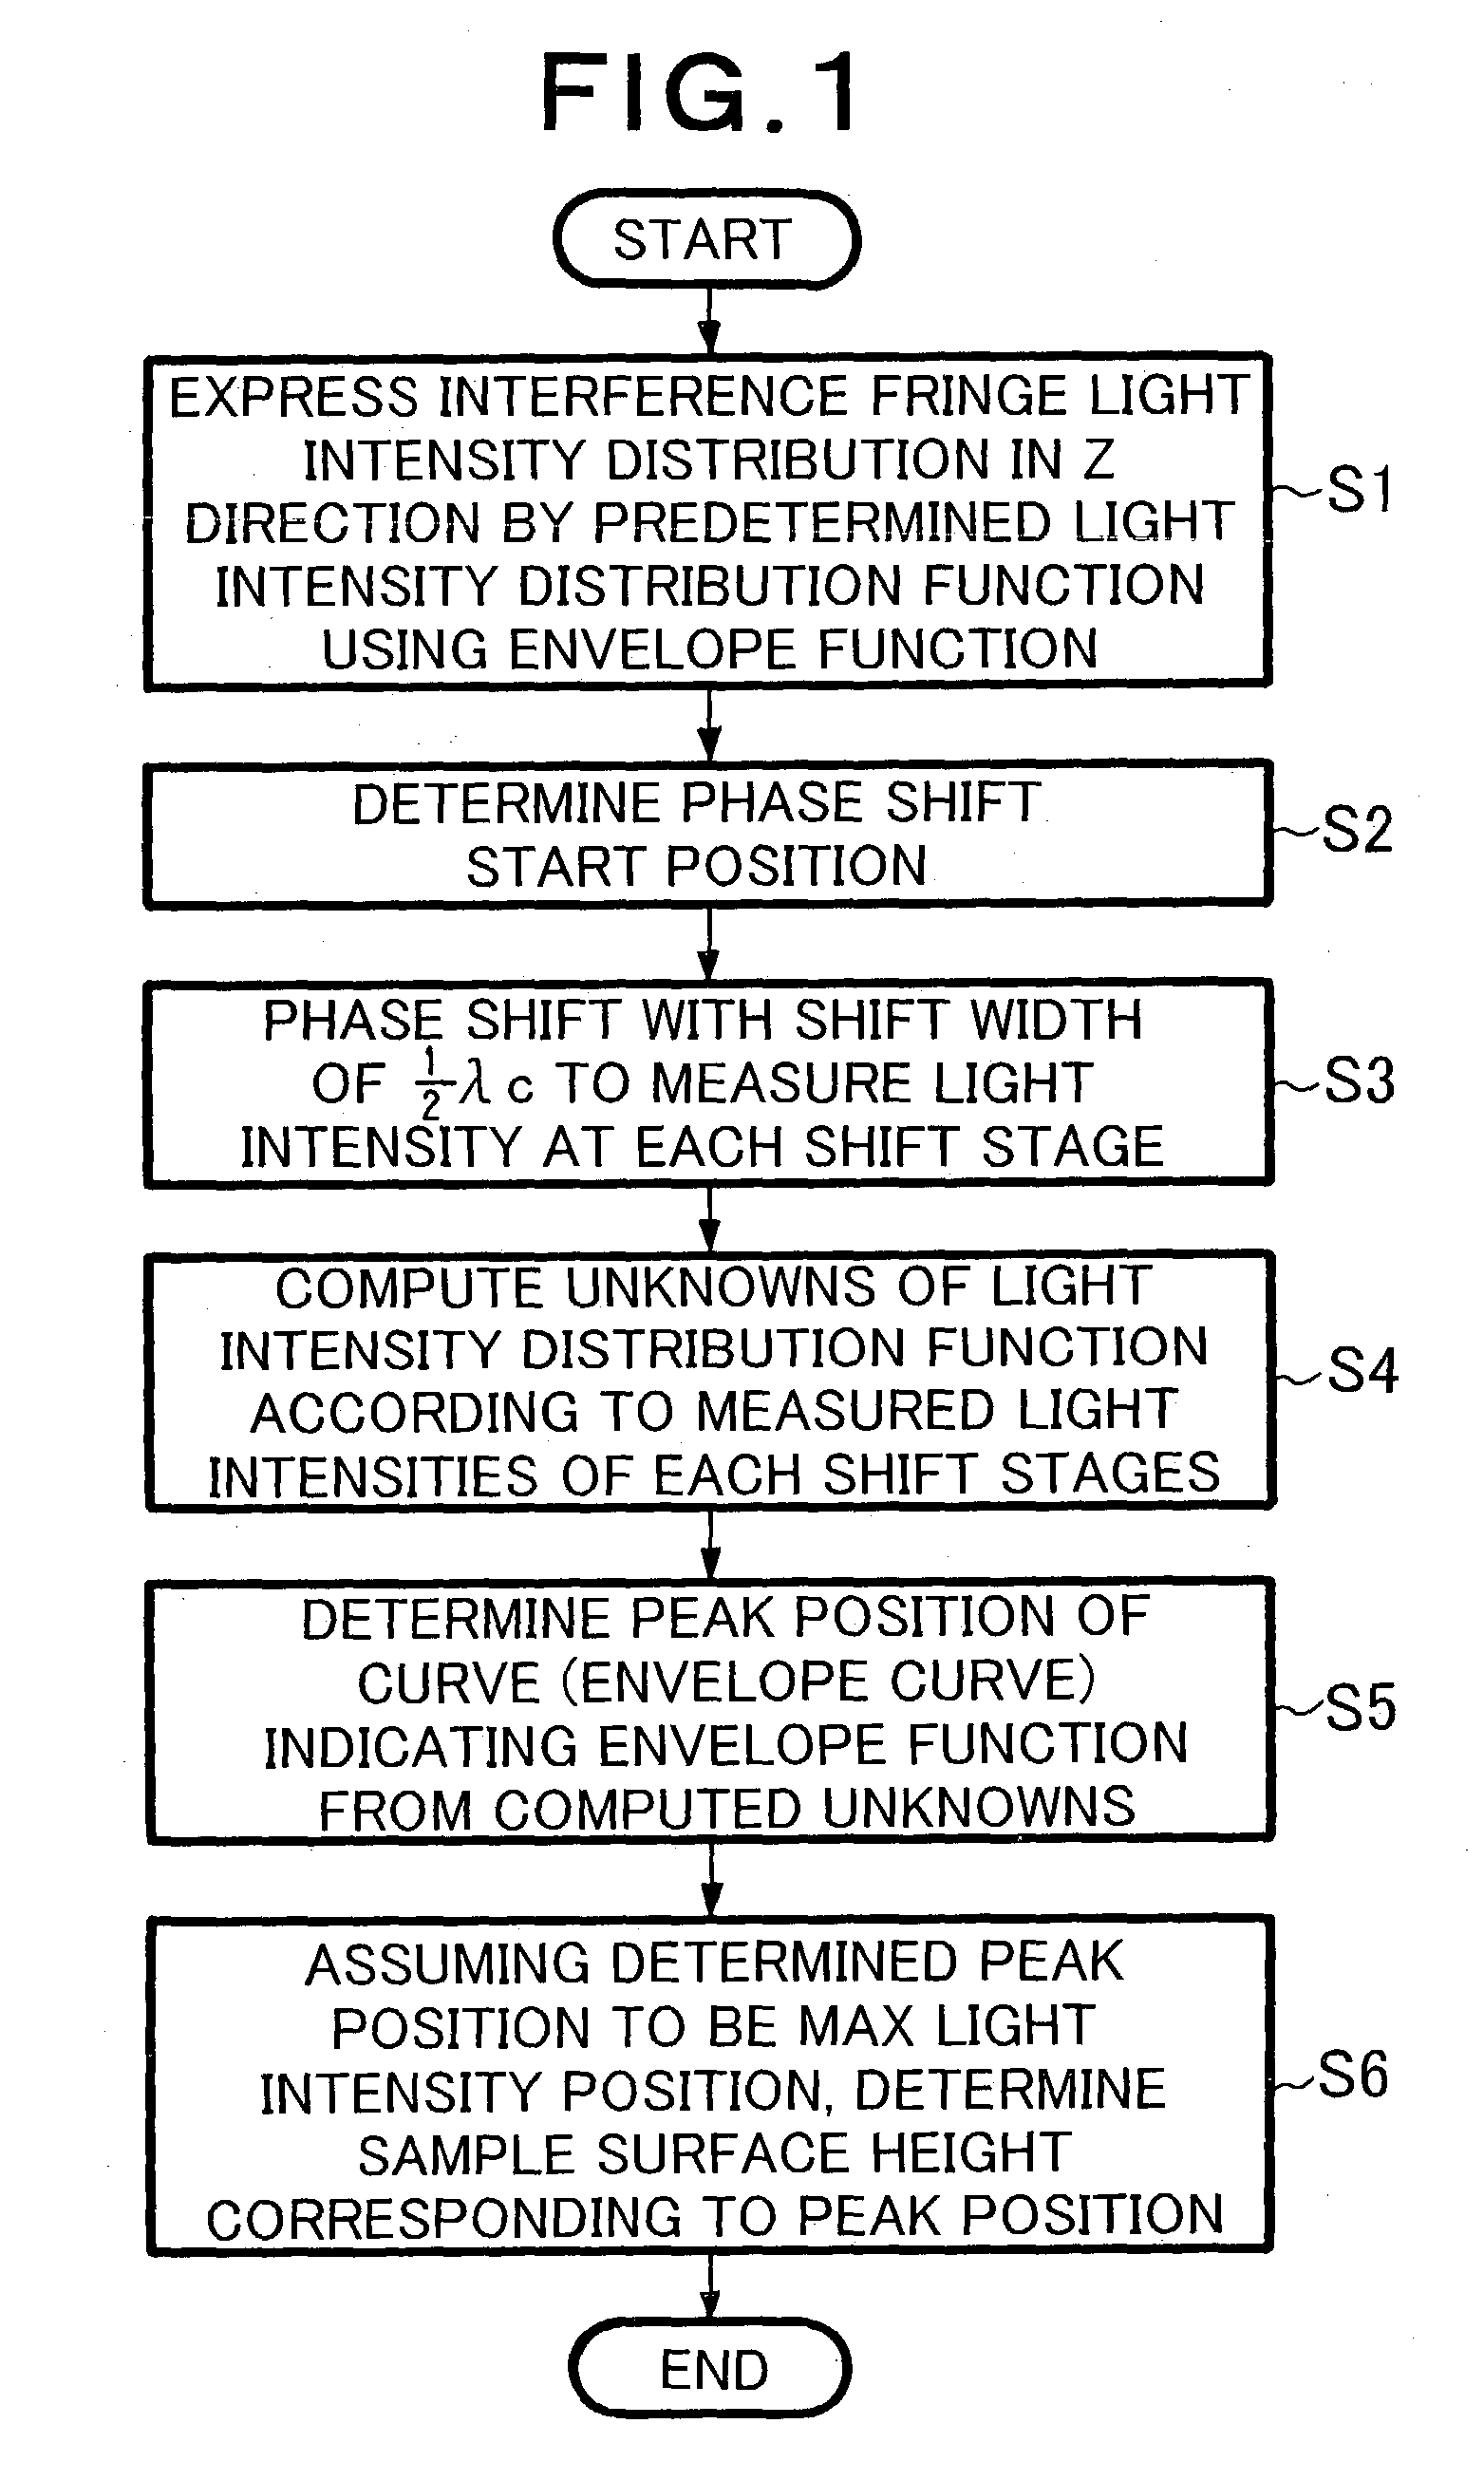
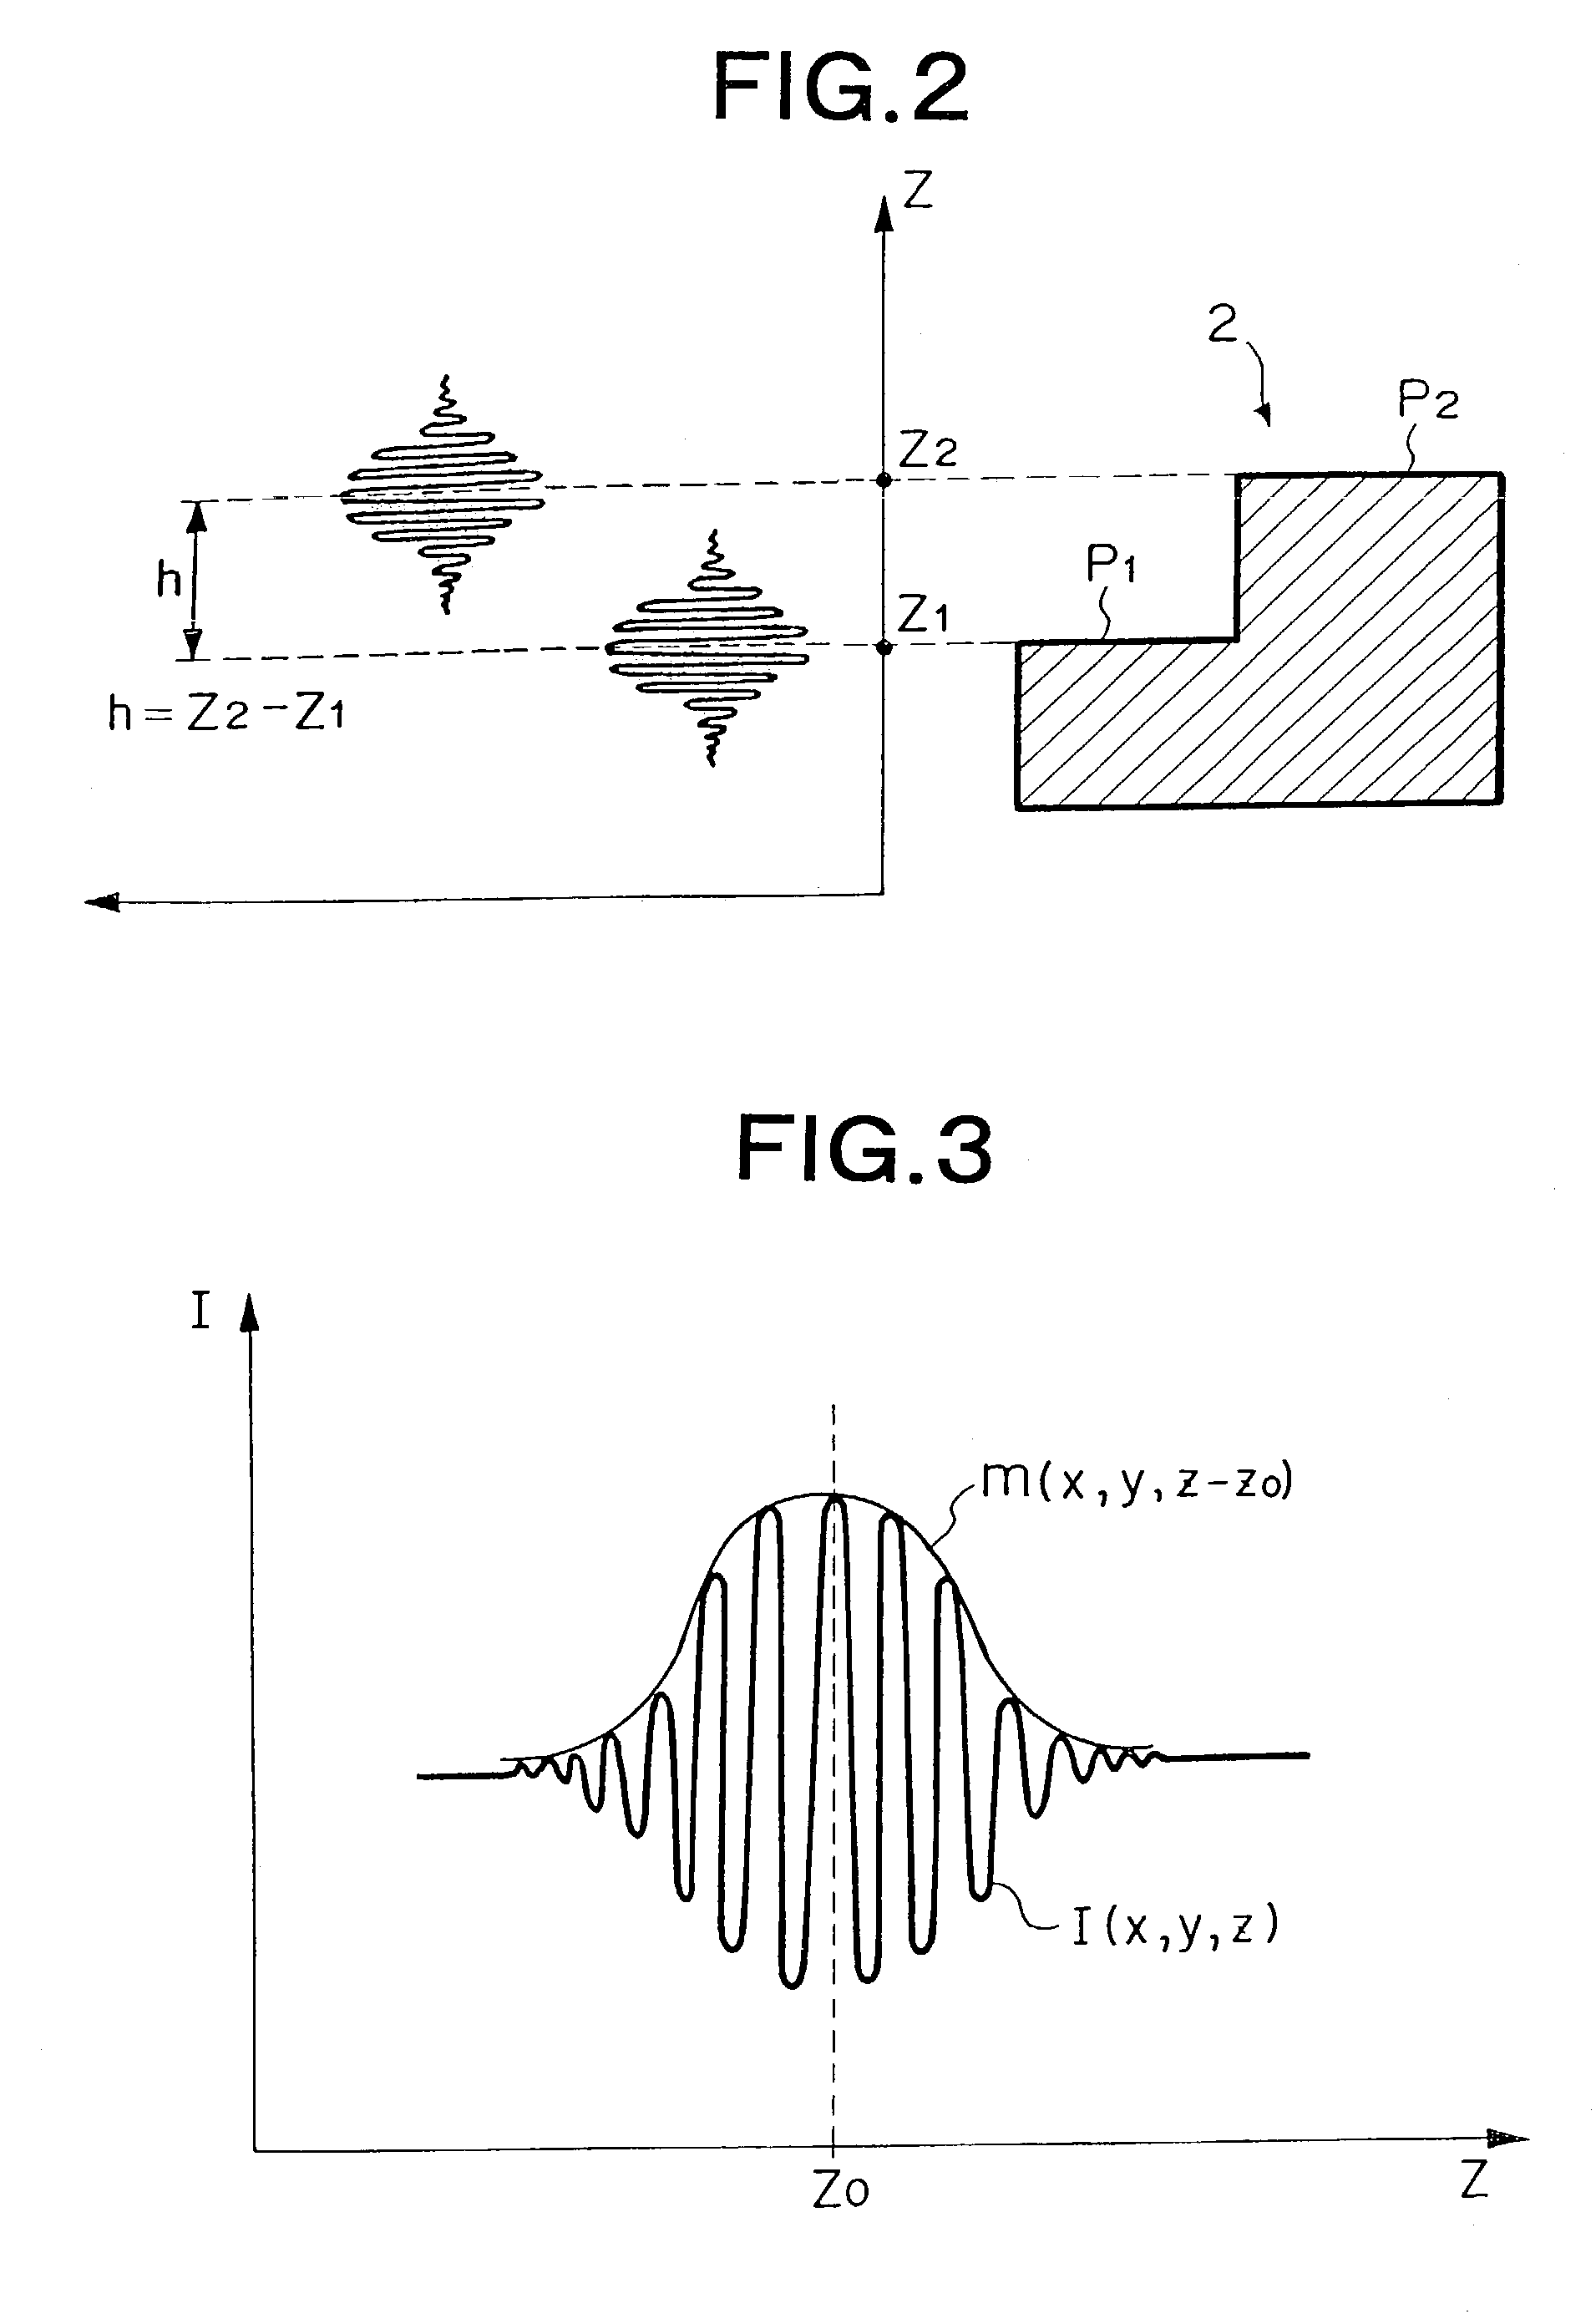
[0025]The low coherent interference fringe analysis method in accordance with a first embodiment of the present invention using the above-mentioned interferometer apparatus 1 will now be explained in detail with reference to FIGS. 1 to 3. FIG. 1 is a flowchart showing a procedure of the low coherent interference fringe analysis method in accordance with the first embodiment of the present invention, FIG. 2 is a schematic diagram showing its principle, and FIG. 3 is a schematic chart showing an envelope function. Explained in the following is a case where the method of the present invention is employed for measuring the gap between two smooth planes P1, P2 formed in a surface of the sample 2 at respective heights different from each other as shown in FIG. 2.
[0026]First, the principle of low coherent interference as a premise will be explained with reference to FIG. 2. The low coherent light from the light source of the interferometer apparatus 1 is divided into two, the referenc...
second embodiment
[0069
[0070]The method in accordance with a second embodiment of the present invention will now be explained. This method differs from that of the first embodiment in that the envelope function explained in the first embodiment is changed from the Gaussian distribution function to a quadratic function. Namely, in this embodiment, the light intensity distribution function is represented by the following equation (23):
[0071]I(x,y,z)=A+[B+C(z-z0)2]cos(2πzλc+θ)(23)
by using unknowns A, B, C, θ, and z0.
[0072]Here, C(z−z0)2 is the envelope function.
[0073]After the phase shift start position is determined, as in the first embodiment, 5-step phase shifting is carried out with a shift width which is k / 2 times the equivalent wavelength, where k is an integer, and the light intensity is measured at each shift stage. Here, the z value of the above-mentioned equation (23) is represented by the following equation (24):
[0074]z=0·λc,12·λc,22·λc,32·λc,42·λc(24)
[0075]Subsequently, thus measured...
third embodiment
[0080
[0081]The method in accordance with a third embodiment of the present invention will now be explained. This method differs from that of the first embodiment in that the envelope function is changed to a cosine function (sine function). Namely, in this embodiment, the light intensity distribution function is represented by the following equation (27):
[0082]I(x,y,z)=A+Bcos(C(z-z0)2)cos(2πzλc+θ)(27)
by using unknowns A, B, C, θ, and z0.
[0083]Here, Bcos(C(z−z0)2) is the envelope function.
[0084]After the phase shift start position is determined, as in the first embodiment, 5-step phase shifting is carried out with a shift width which is k / 2 times the equivalent wavelength, where k is an integer, and the light intensity is measured at each shift stage. Here, the z value of the above-mentioned equation (27) is represented by the following equation (28):
[0085]z=0·λc,12·λc,22·λc,32·λc,42·λc(28)
[0086]Subsequently, thus measured respective light intensities of the shift stages an...
PUM
 Abstract
Description
Claims
Application Information
 - R&D
- Intellectual Property
- Life Sciences
- Materials
- Tech Scout
- Unparalleled Data Quality
- Higher Quality Content
- 60% Fewer Hallucinations
Browse by: Latest US Patents, China's latest patents, Technical Efficacy Thesaurus, Application Domain, Technology Topic, Popular Technical Reports.
© 2025 PatSnap. All rights reserved.Legal|Privacy policy|Modern Slavery Act Transparency Statement|Sitemap|About US| Contact US: help@patsnap.com


