

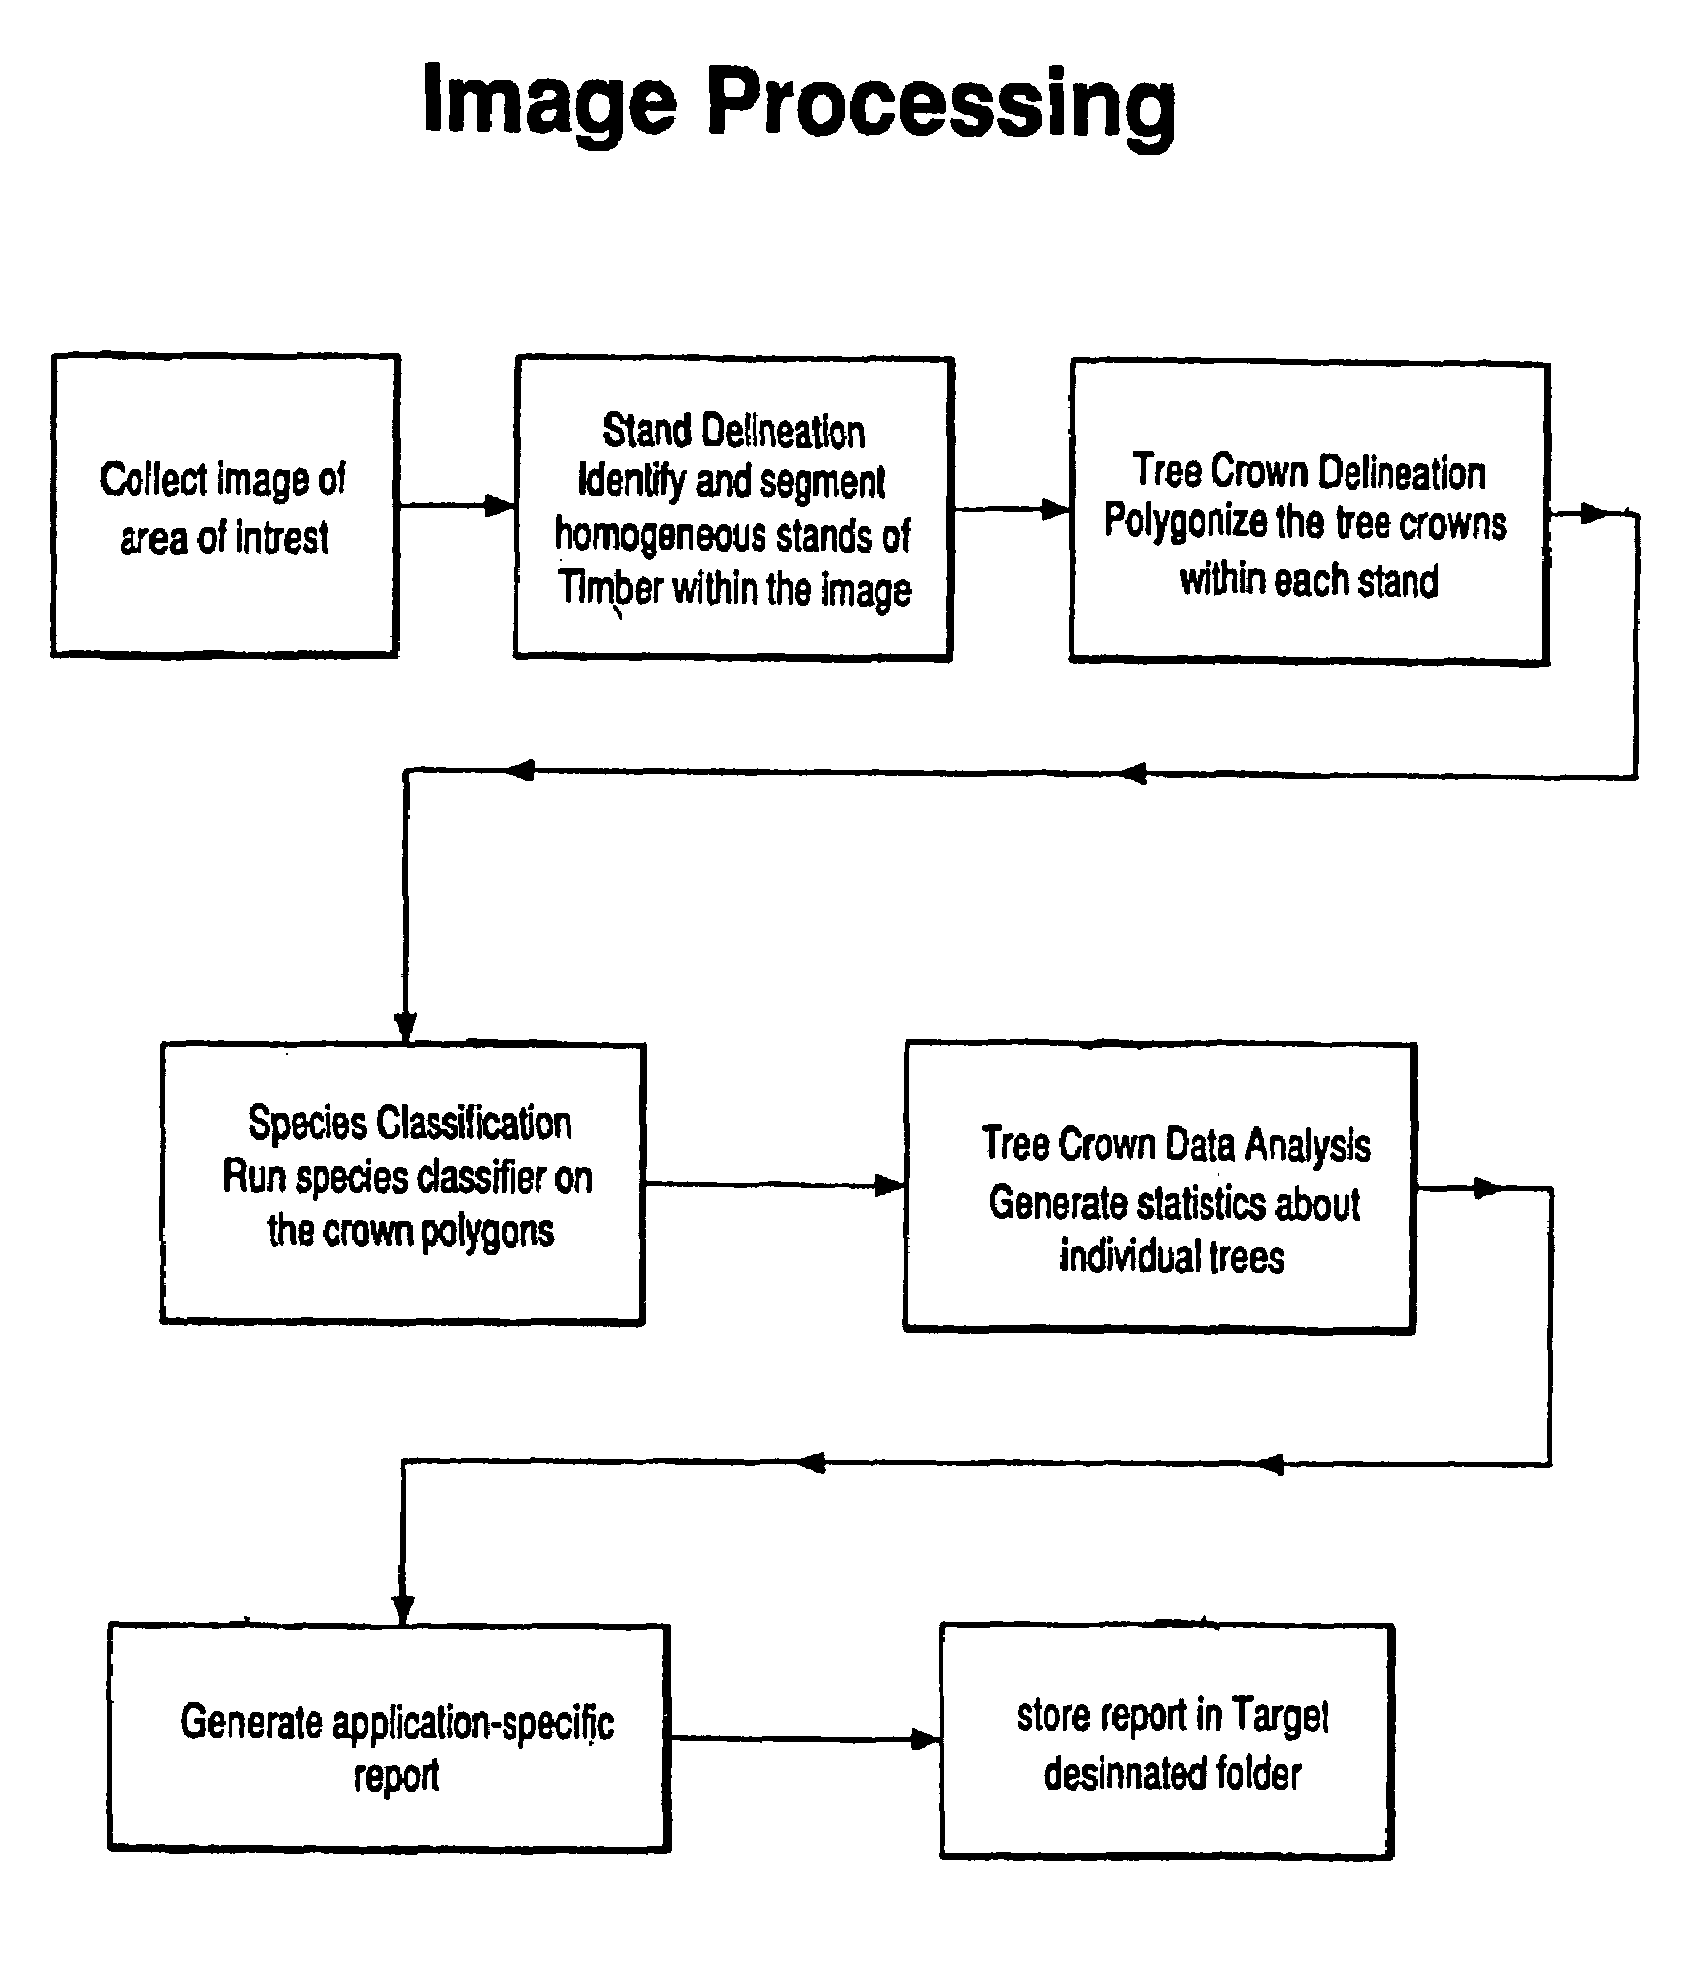
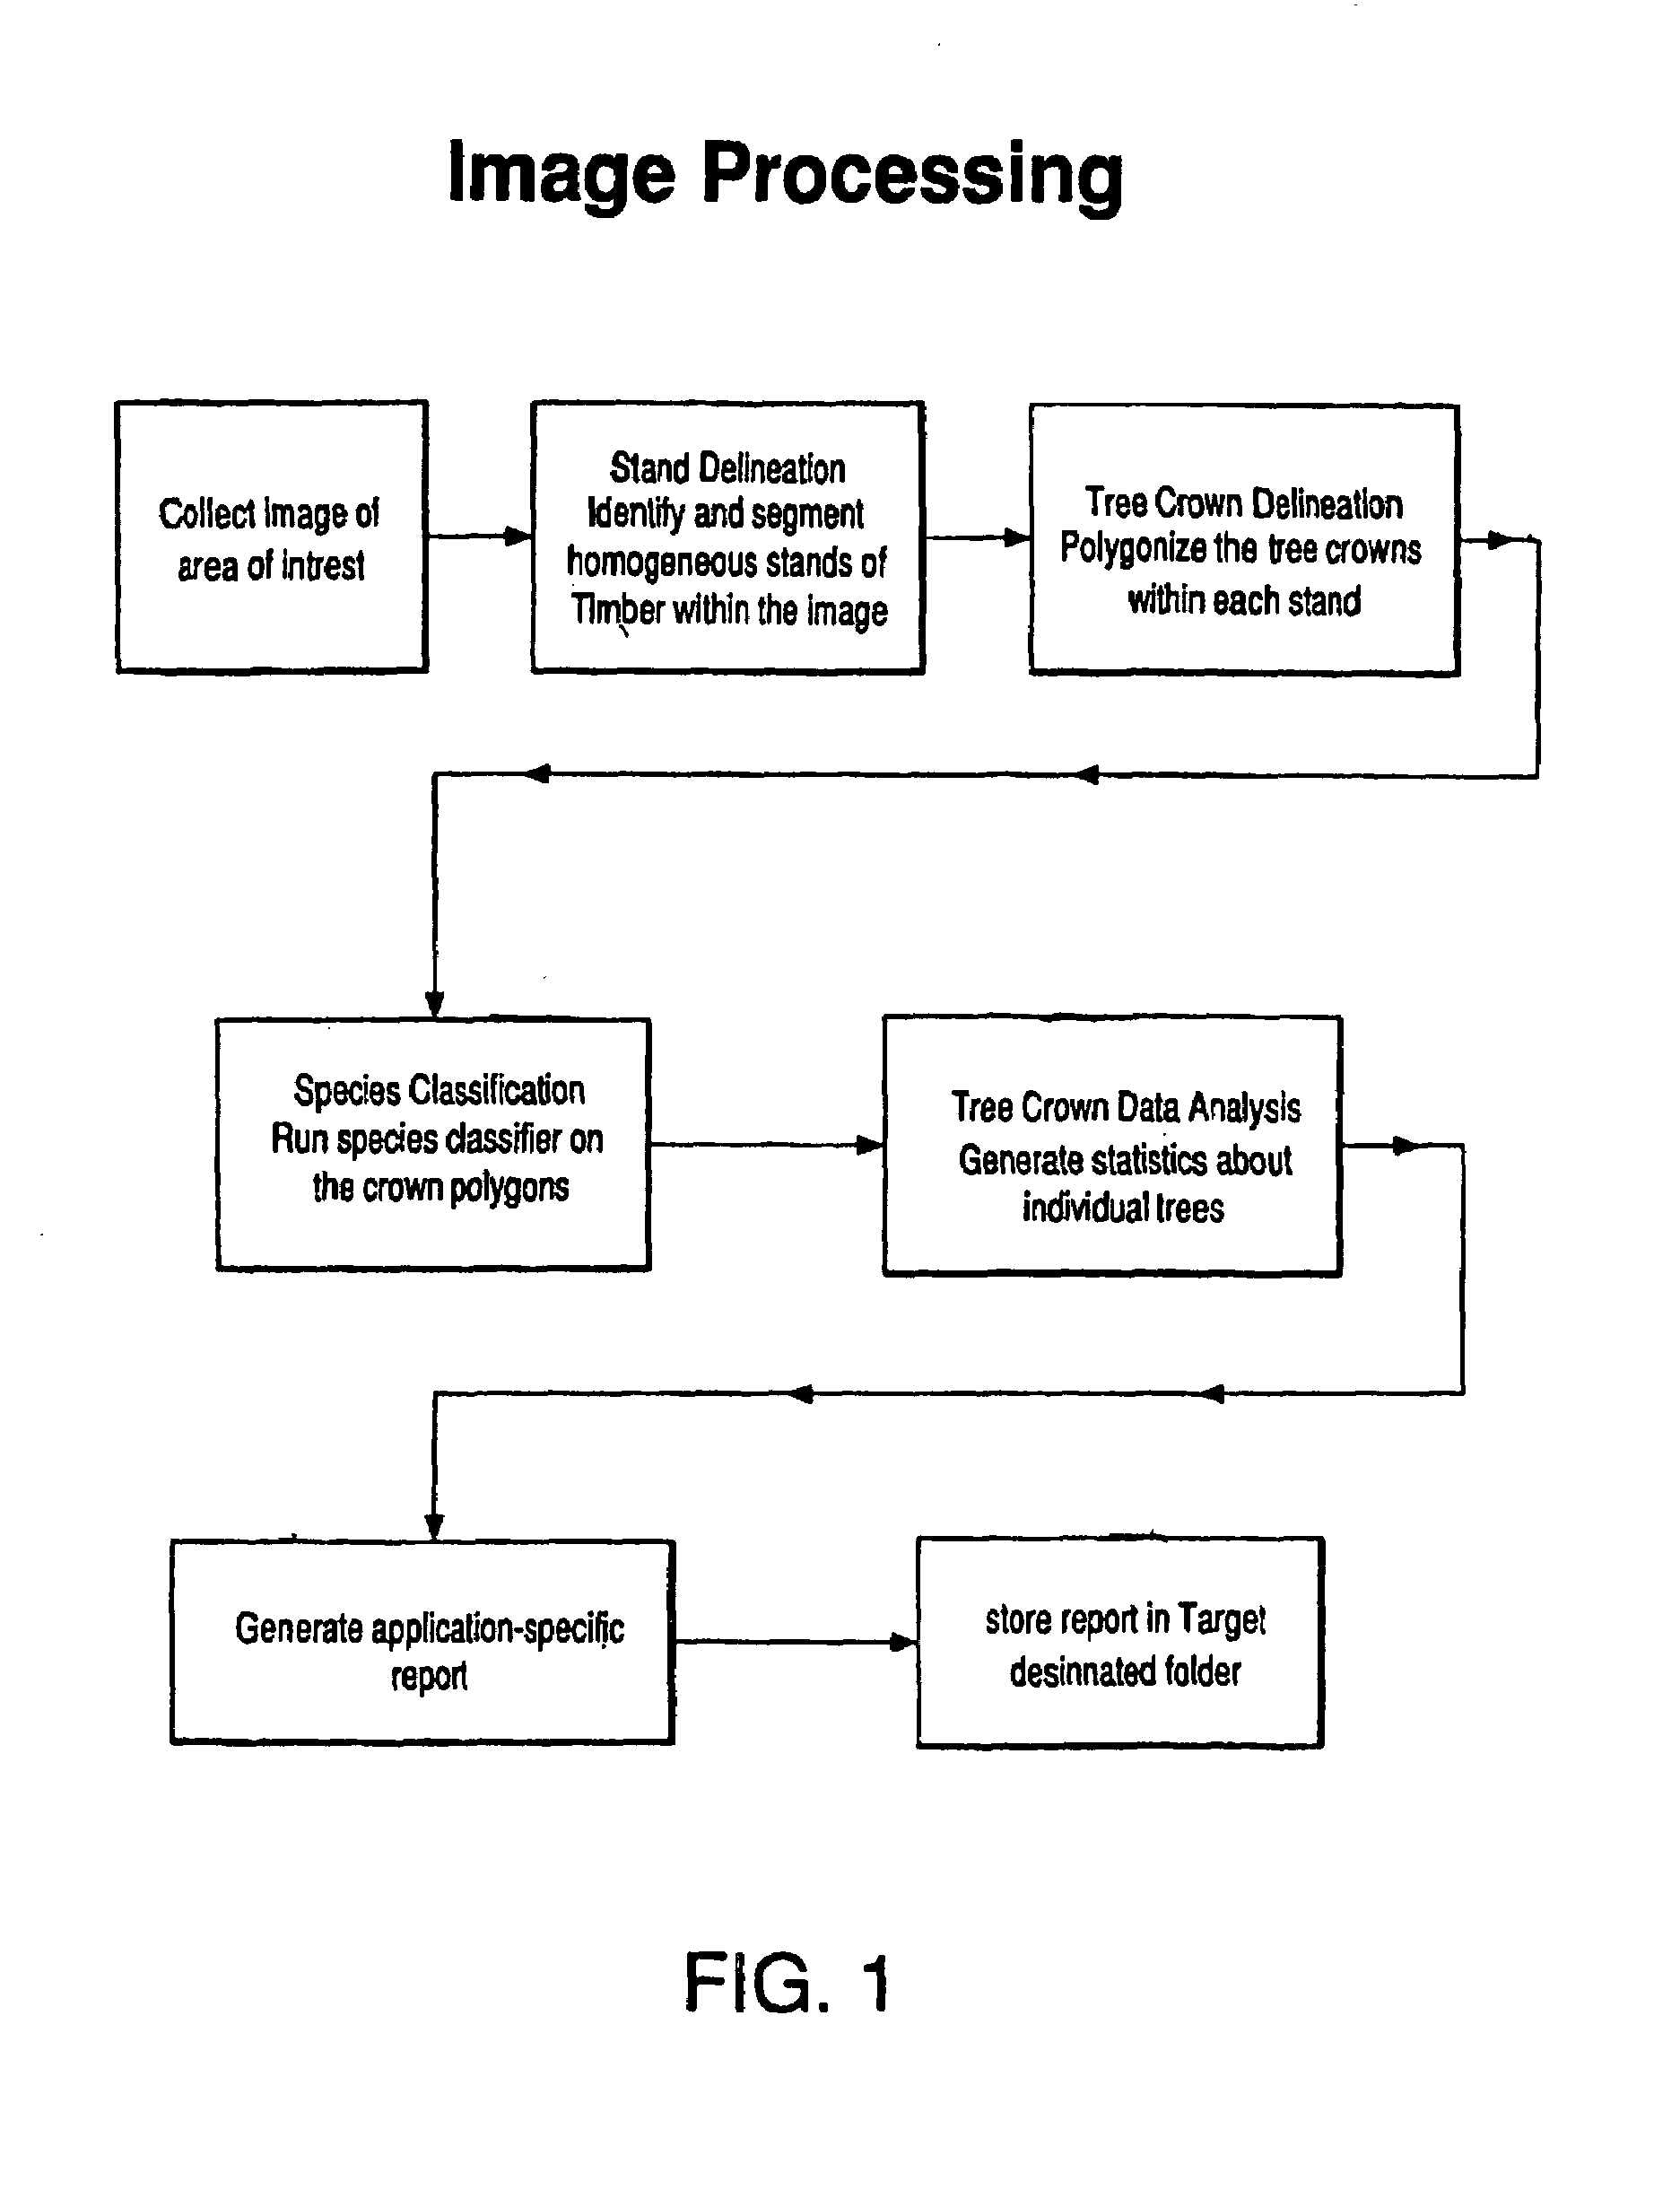
Method of feature identification and analysis
a feature identification and feature technology, applied in the field of natural resource management, can solve the problems of unsatisfactory current forest inventory system, low efficiency of feature identification, and low efficiency of feature identification, and achieve the effect of efficiently and accurately identifying and analyzing features and inventorying timberlands
- Summary
- Abstract
- Description
- Claims
- Application Information
AI Technical Summary
Benefits of technology
Problems solved by technology
Method used
Image

Examples
example 1
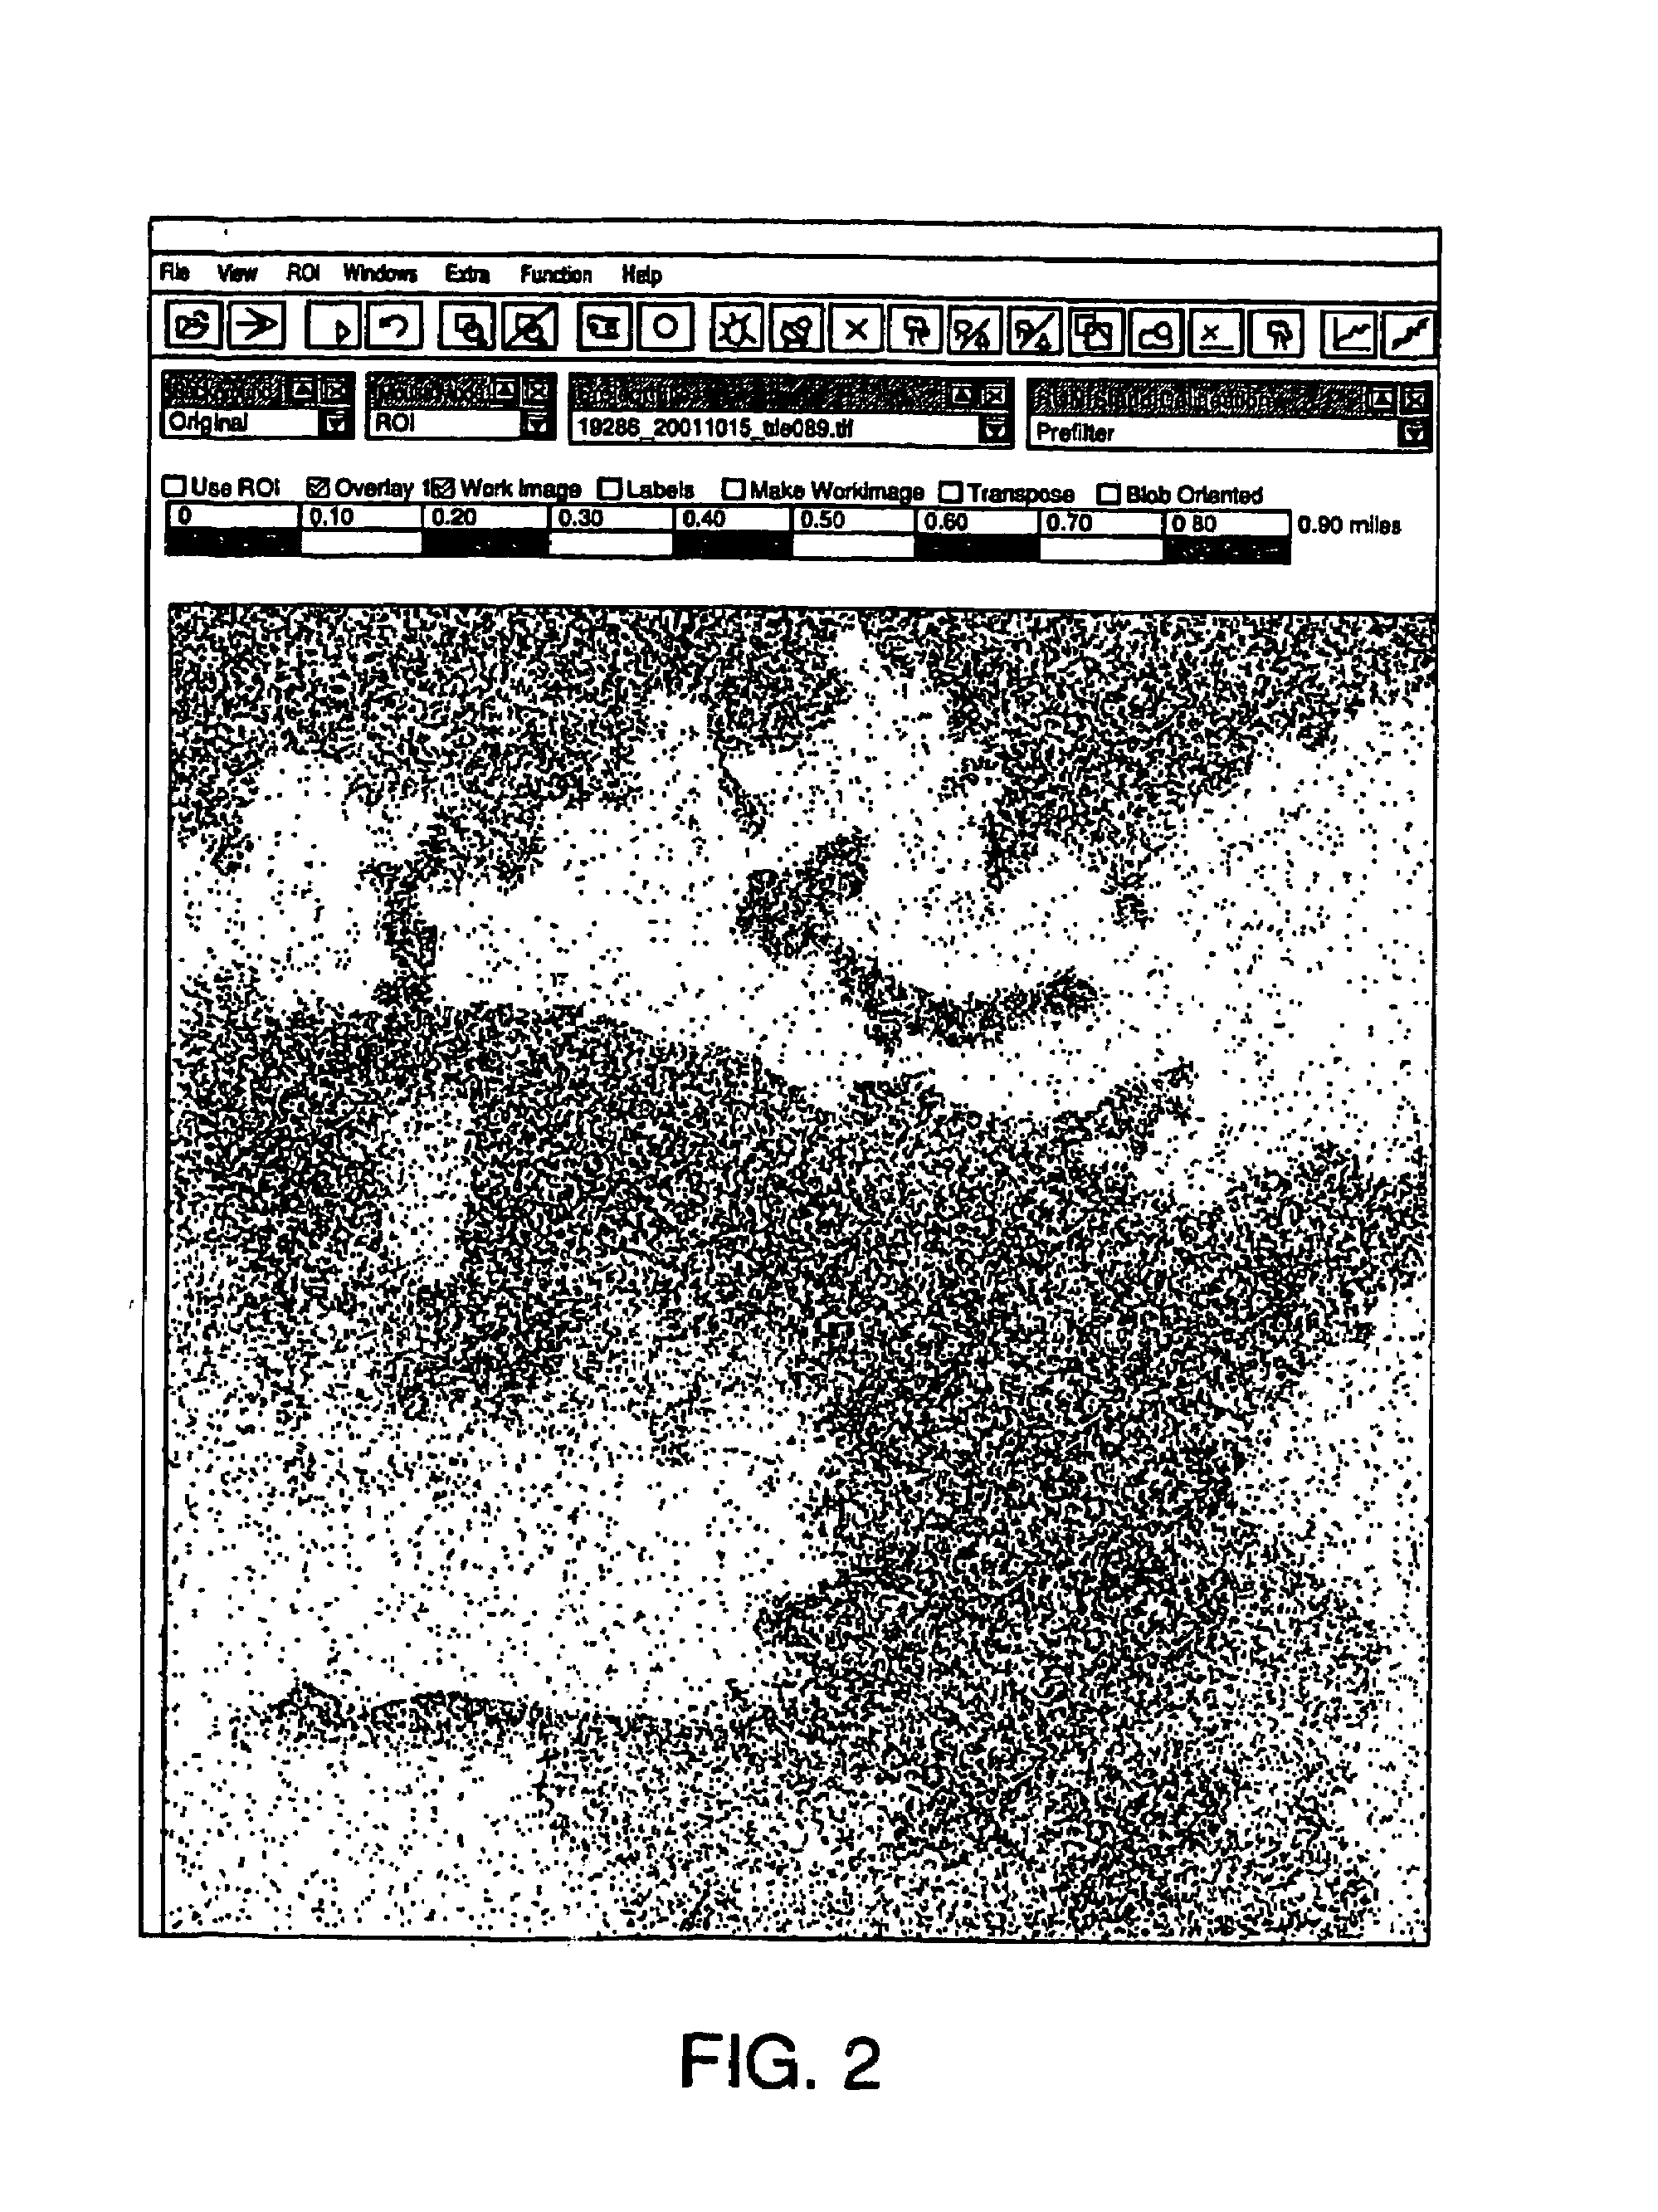
[0066]A 2 foot digital ortho-rectified, color-balanced image in TIFF format was taken of a 12 square mile forested area in Nicholas County, West Virginia. The image was taken in RGB true color, and was taken in the fall when leaves are in senescence. Stand segmentation was performed using seeded region growing. Tree crowns were captured using segmentation, and filtering parameters used to eliminate undesirable details were a prefilter value of 4, a seed threshold of 90, and a cut ratio of 90. Species were classified according to supervised classification based on the teaching method. Three trees were selected per species. Three species were selected and identified using nearest neighborhood classification: poplar, red maple and red oak.
[0067]For data analysis, a model was selected for each of the three species based on data from 200 field measurements of different sized trees in Pennsylvania. The resulting data was displayed and is illustrated in FIG. 16.
example 2
[0068]A stand area of 24 acres was selected south of Dugway Rd, in Madison County, New York, Tax Map Number 148.-1-7. Low level segmentation was performed to delineate tree crowns, and species classification and tree crown data analysis were performed to determine tree species and total tree stem volume in board-feet. A total of 93,402 board-feet was calculated based on only trees of DBH greater than 12 inches. Trees with DBH greater than 25 in. were not used in the data analysis.
[0069]Species classification resulted in 85% Hard Maple, 13% undefined, and 2% Cherry. The Norway Spruce Model was selected based on the species present in the image. The following table illustrates a breakdown of tree stem volume based on the total number of trees per DBH:
[0070]
DBH (in.)Tree CountTotal Volume / DBH (Bf)0012154295213167550414–152931837416–171972300118–191071933920–21631649622–2318586024–2551876
example 3
[0071]A stand area of 18 acres was selected in Madison County, NY, East of Cazenoia, Moraine Road, Tax Map Number 96-2-1. Low level segmentation was performed to delineate tree crowns, and species classification and tree crown data analysis were performed to determine tree species and total tree stem volume in board-feet. A total of 25,629 board-feet was calculated based on only trees of DBH greater than 14 inches.
[0072]Species classification resulted in 45% Hard Maple, 15% Cherry, 4% Red Maple, and 36% undefined. The Norway Spruce Model was selected based on the species present in the image. The following table illustrates a breakdown of tree stem volume based on the total number of trees per DBH:
[0073]
DBH (in.)Tree CountTotal Volume / DBH (Bf)14–1564983216–17871002718–1922403920–215137422–23135724–250026–270028–290030–310032–330034+00
[0074]Timber value was then calculated using the total tree stem volume per species in Doyle and stump prices per 1000 Doyle. The following table illus...
PUM
 Abstract
Description
Claims
Application Information