Method and system for dynamic visualization of multi-dimensional data

a multi-dimensional data and dynamic visualization technology, applied in the field of methods and systems for the display of multi-dimensional data, can solve the problems of large-scale complex data, inability to comprehend the data so acquired, and inability to predict the effect of errors

Inactive Publication Date: 2007-09-04
TERASTAT
View PDF12 Cites 38 Cited by
  • Summary
  • Abstract
  • Description
  • Claims
  • Application Information

AI Technical Summary

Benefits of technology

[0021]Embodiments of the present invention provide computer- and network-based methods and systems for dynamically determining and presenting appearance and spatial attribute values of subsets of multi-dimensional data over an index (a sequence) to assist in the recognition of patterns and trends within the data. Example embodiments provide a Dynamic Visualization System for the presentation of multi-dimensional data (a “DVS”), which enables users to identify patterns and trends in highly dimensional data by observing dynamically determined data values that are portrayed, for example, animated over some sequence such as a time-valued index. The dynamically determined data values are imputed in near real-time using functions that are based upon actual data attribute values.
[0022]The Dynamic Visualization System defines subsets of the multi-dimensional data to be displayed as data entities; maps data attributes to visualization dimensions that can be presented to the user; and automatically portrays representations (e.g., animations) of dynamically determined imputed values for each mapped data attribute. In addition, the DVS supports the specification of visual filters for triggering events when data subsets match desired criteria. Also, the DVS provides near real-time control of display parameters and object parameters to which the presentations respond so that changes to data subsets can be immediately and dynamically observed.

Problems solved by technology

One of the consequences of the increasing computerization and digitization of almost all human activities is the presence of vast quantities of complex data.
While capturing multiple aspects of activities and phenomena is becoming easier, comprehending the data so acquired is increasingly challenging.
In any large-scale data collection process, it is inevitable that errors will occur.
Entire records may be lost or duplicated.
While some types of errors may be identified by routine data operations, other types of errors will only be found during analysis, necessitating correction of the database (or equivalent data structure) and reanalysis.
Such a representation is physically impossible to realize when the number of dimensions becomes large; however it provides a mental framework for further operations on the database.
Even using the combination of complex database operations and graphical display techniques, it is difficult to gain an understanding of highly dimensional data because there are simply too many values to mentally track or plot.
However, the greater the dimensionality reduction obtained through aggregation and other transformations using these tools, the more information that is lost.
The ability to characterize a data set is thus limited by the amount of reduction required to visualize the data using existing tools.
The pace at which this process can proceed is limited by the availability of visualization tools that aid the data analyst in viewing the data.
Thus, current data visualization software continues to have several limitations.
One limitation is ease of using the software.
The ease of use of visualization software is in part limited by the need for the user to pre-process data to align all attributes on the same index.
In addition, currently available software is typically limited to interaction with static data sets.

Method used


Image

  • Method and system for dynamic visualization of multi-dimensional data
  • Method and system for dynamic visualization of multi-dimensional data
  • Method and system for dynamic visualization of multi-dimensional data

Examples


Embodiment Construction

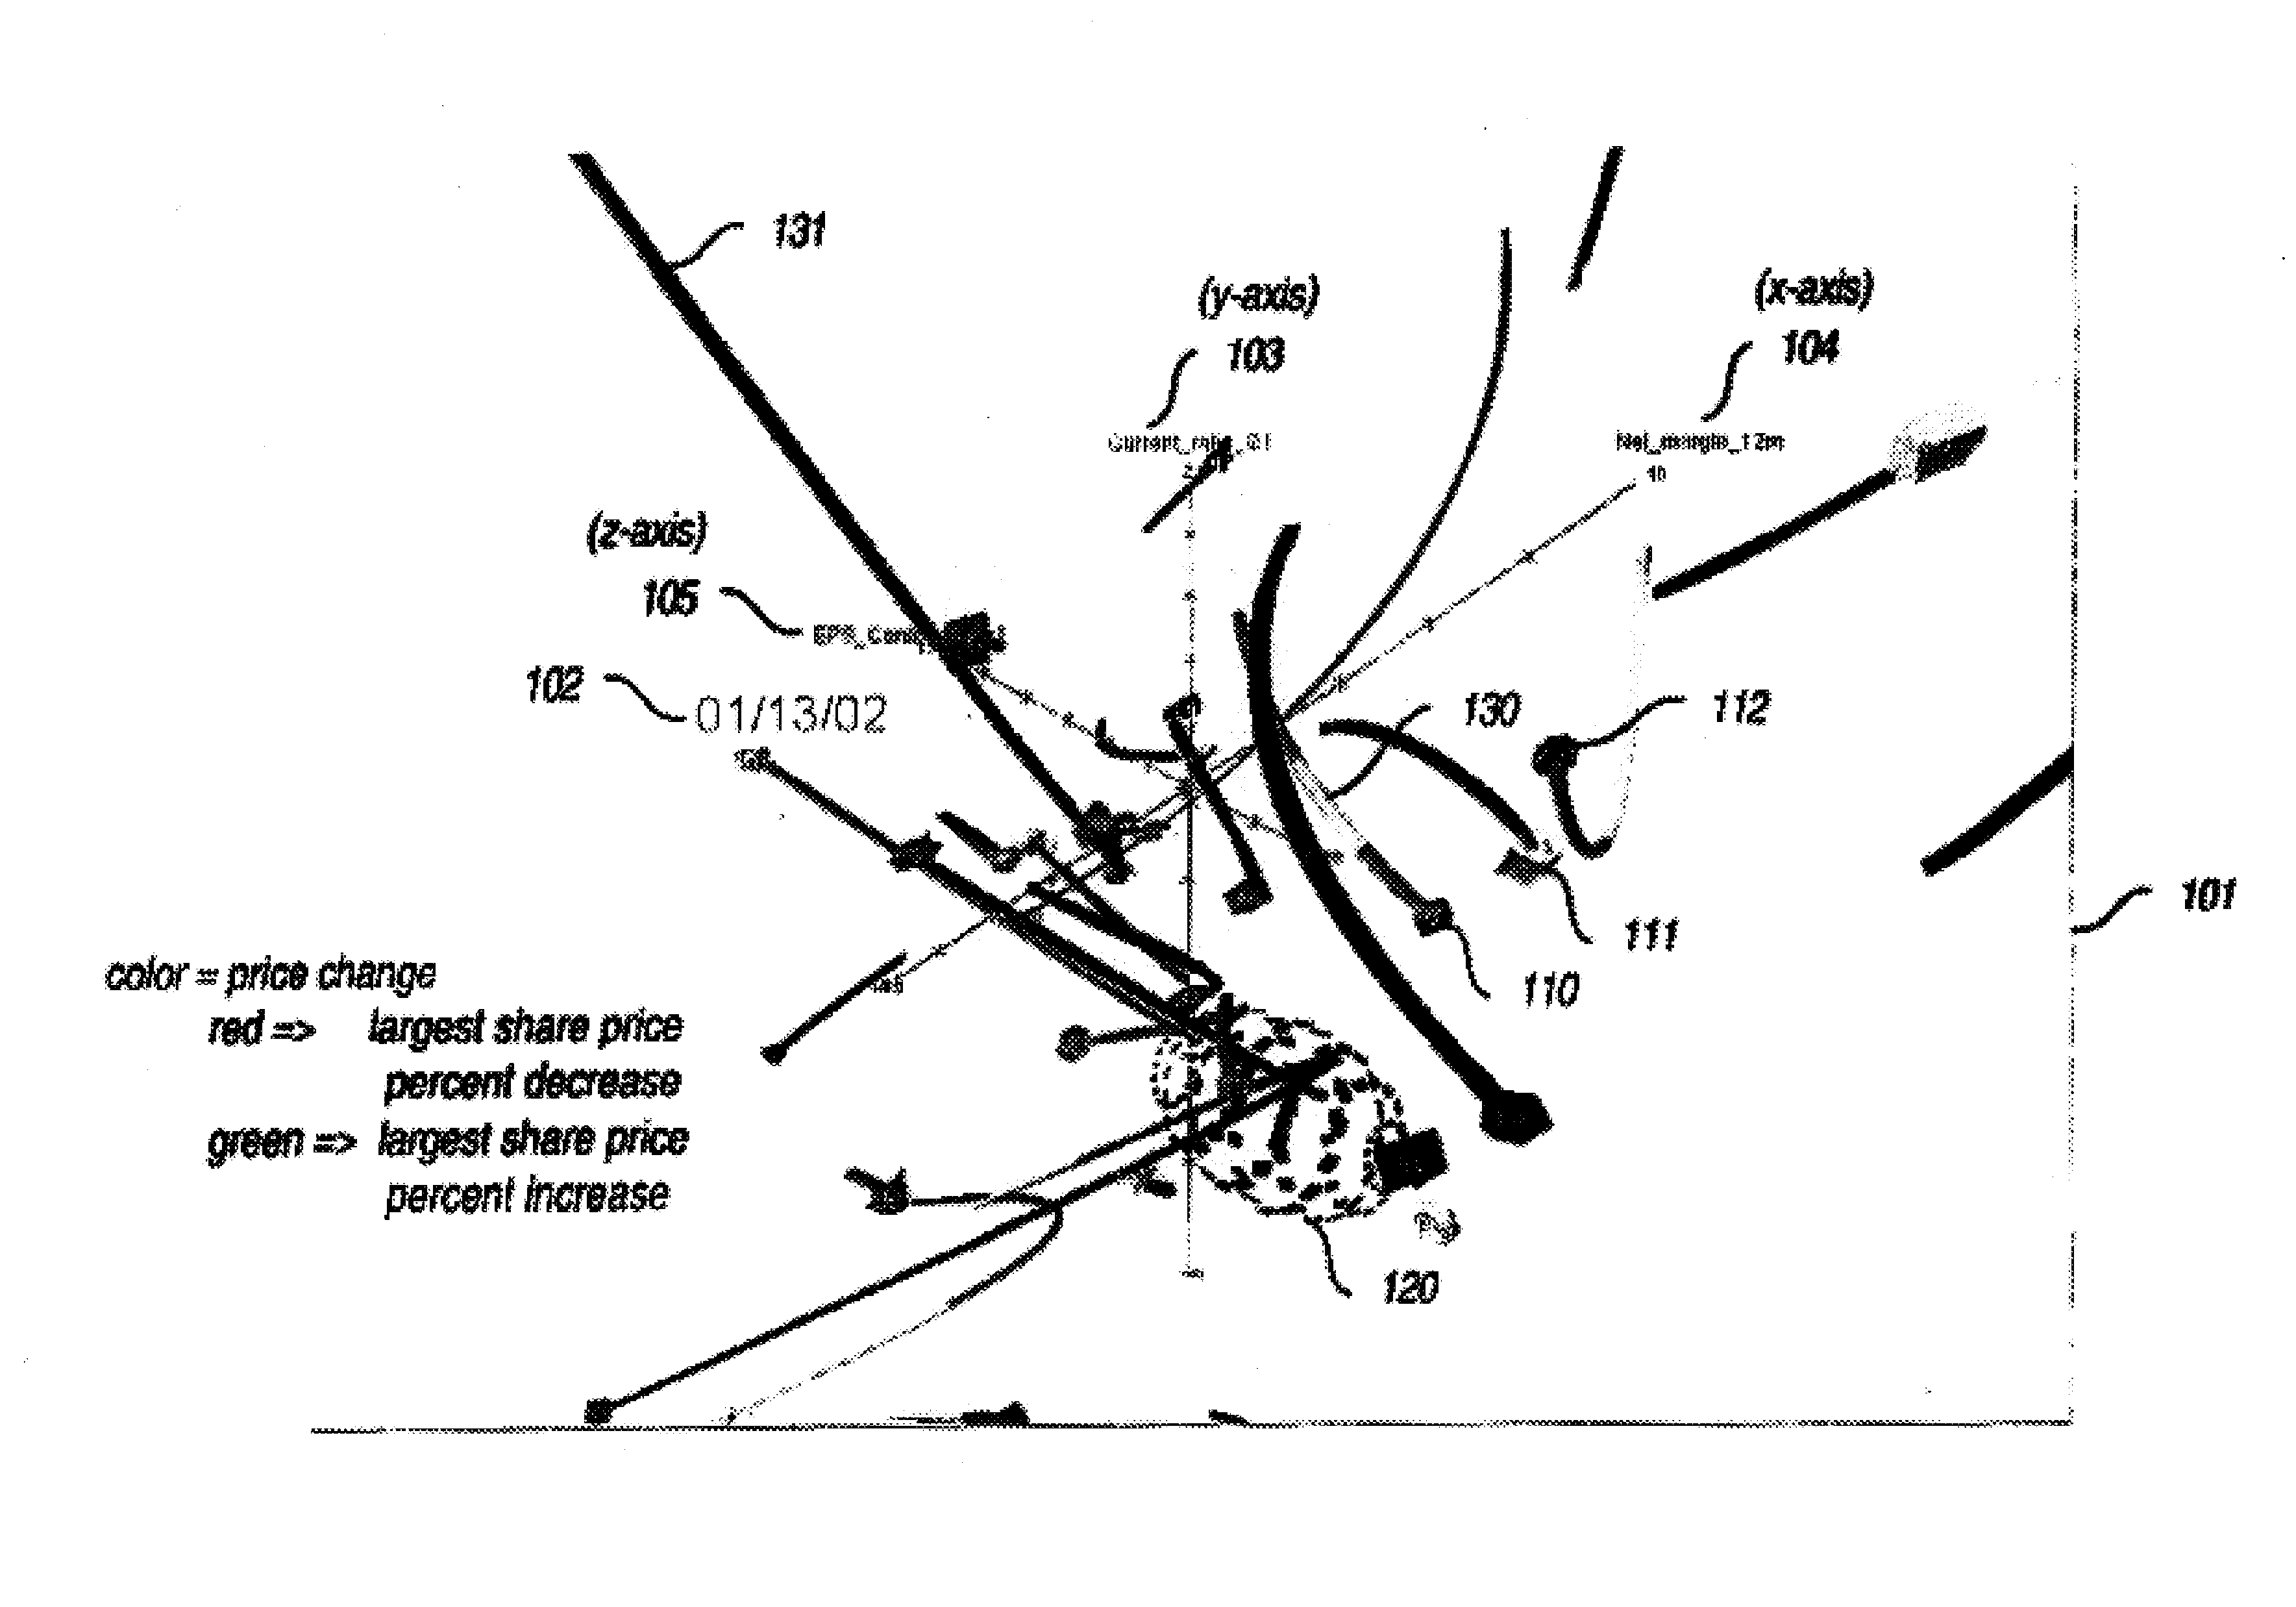
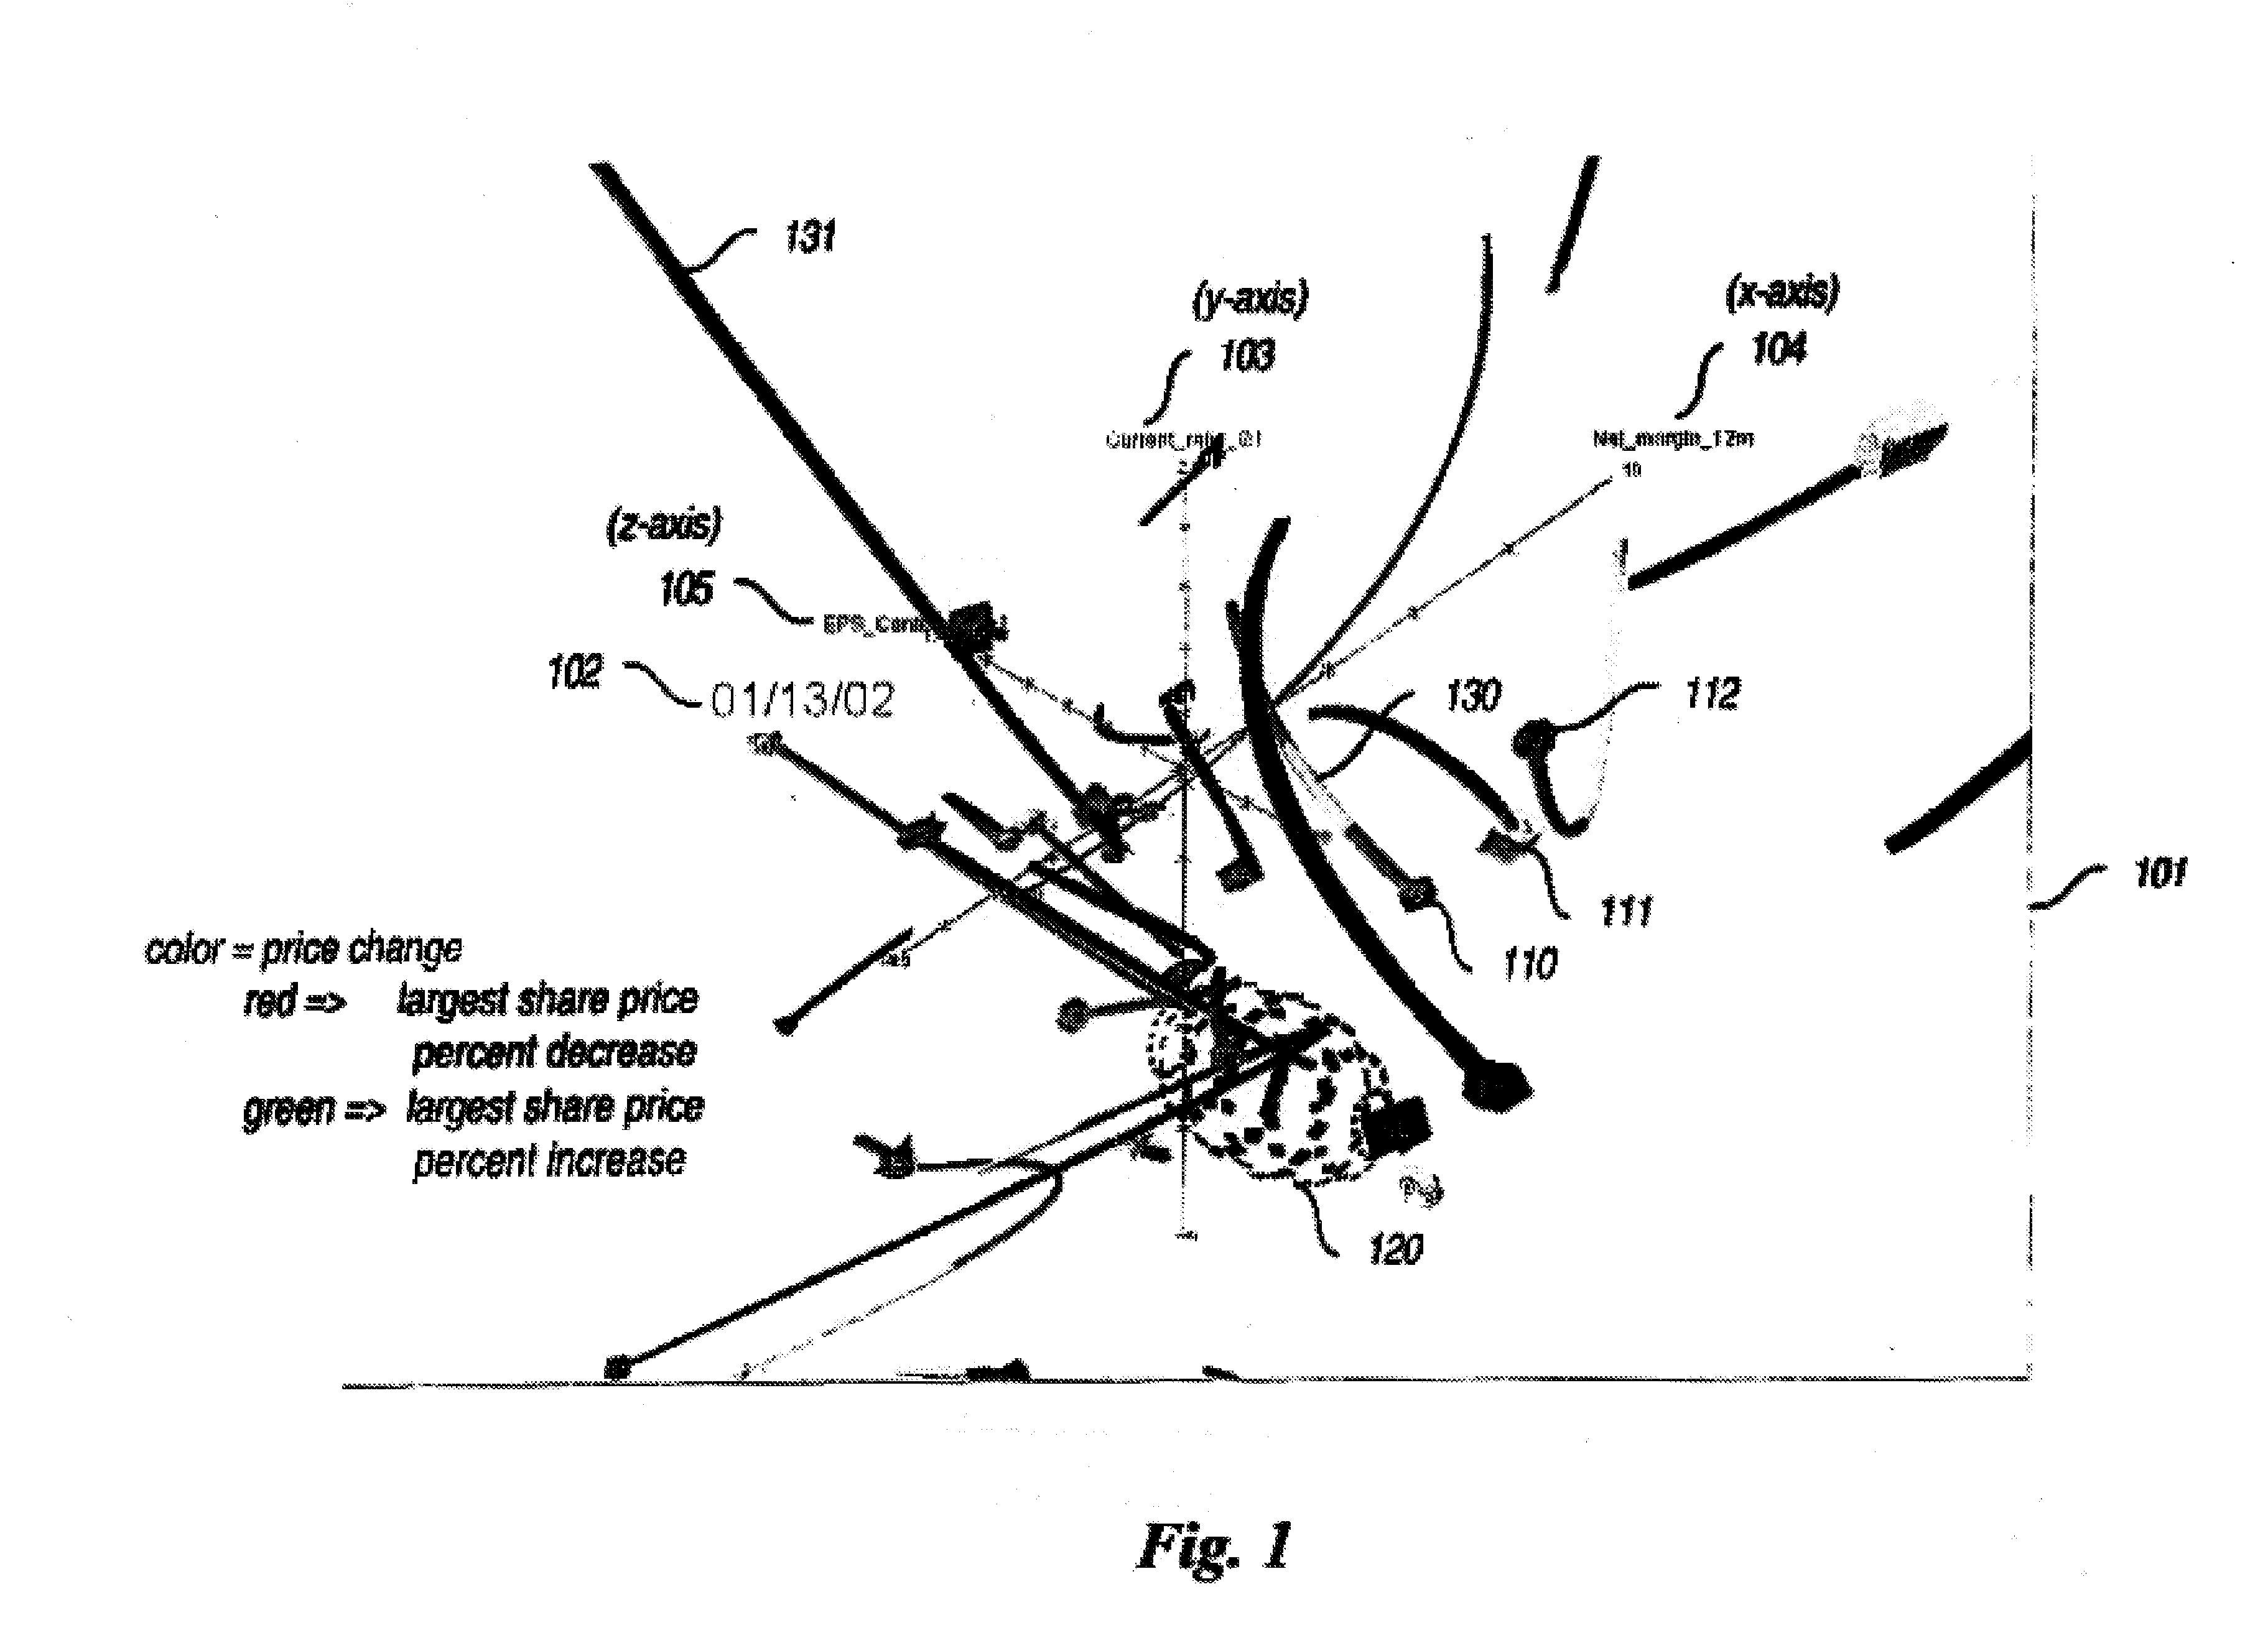
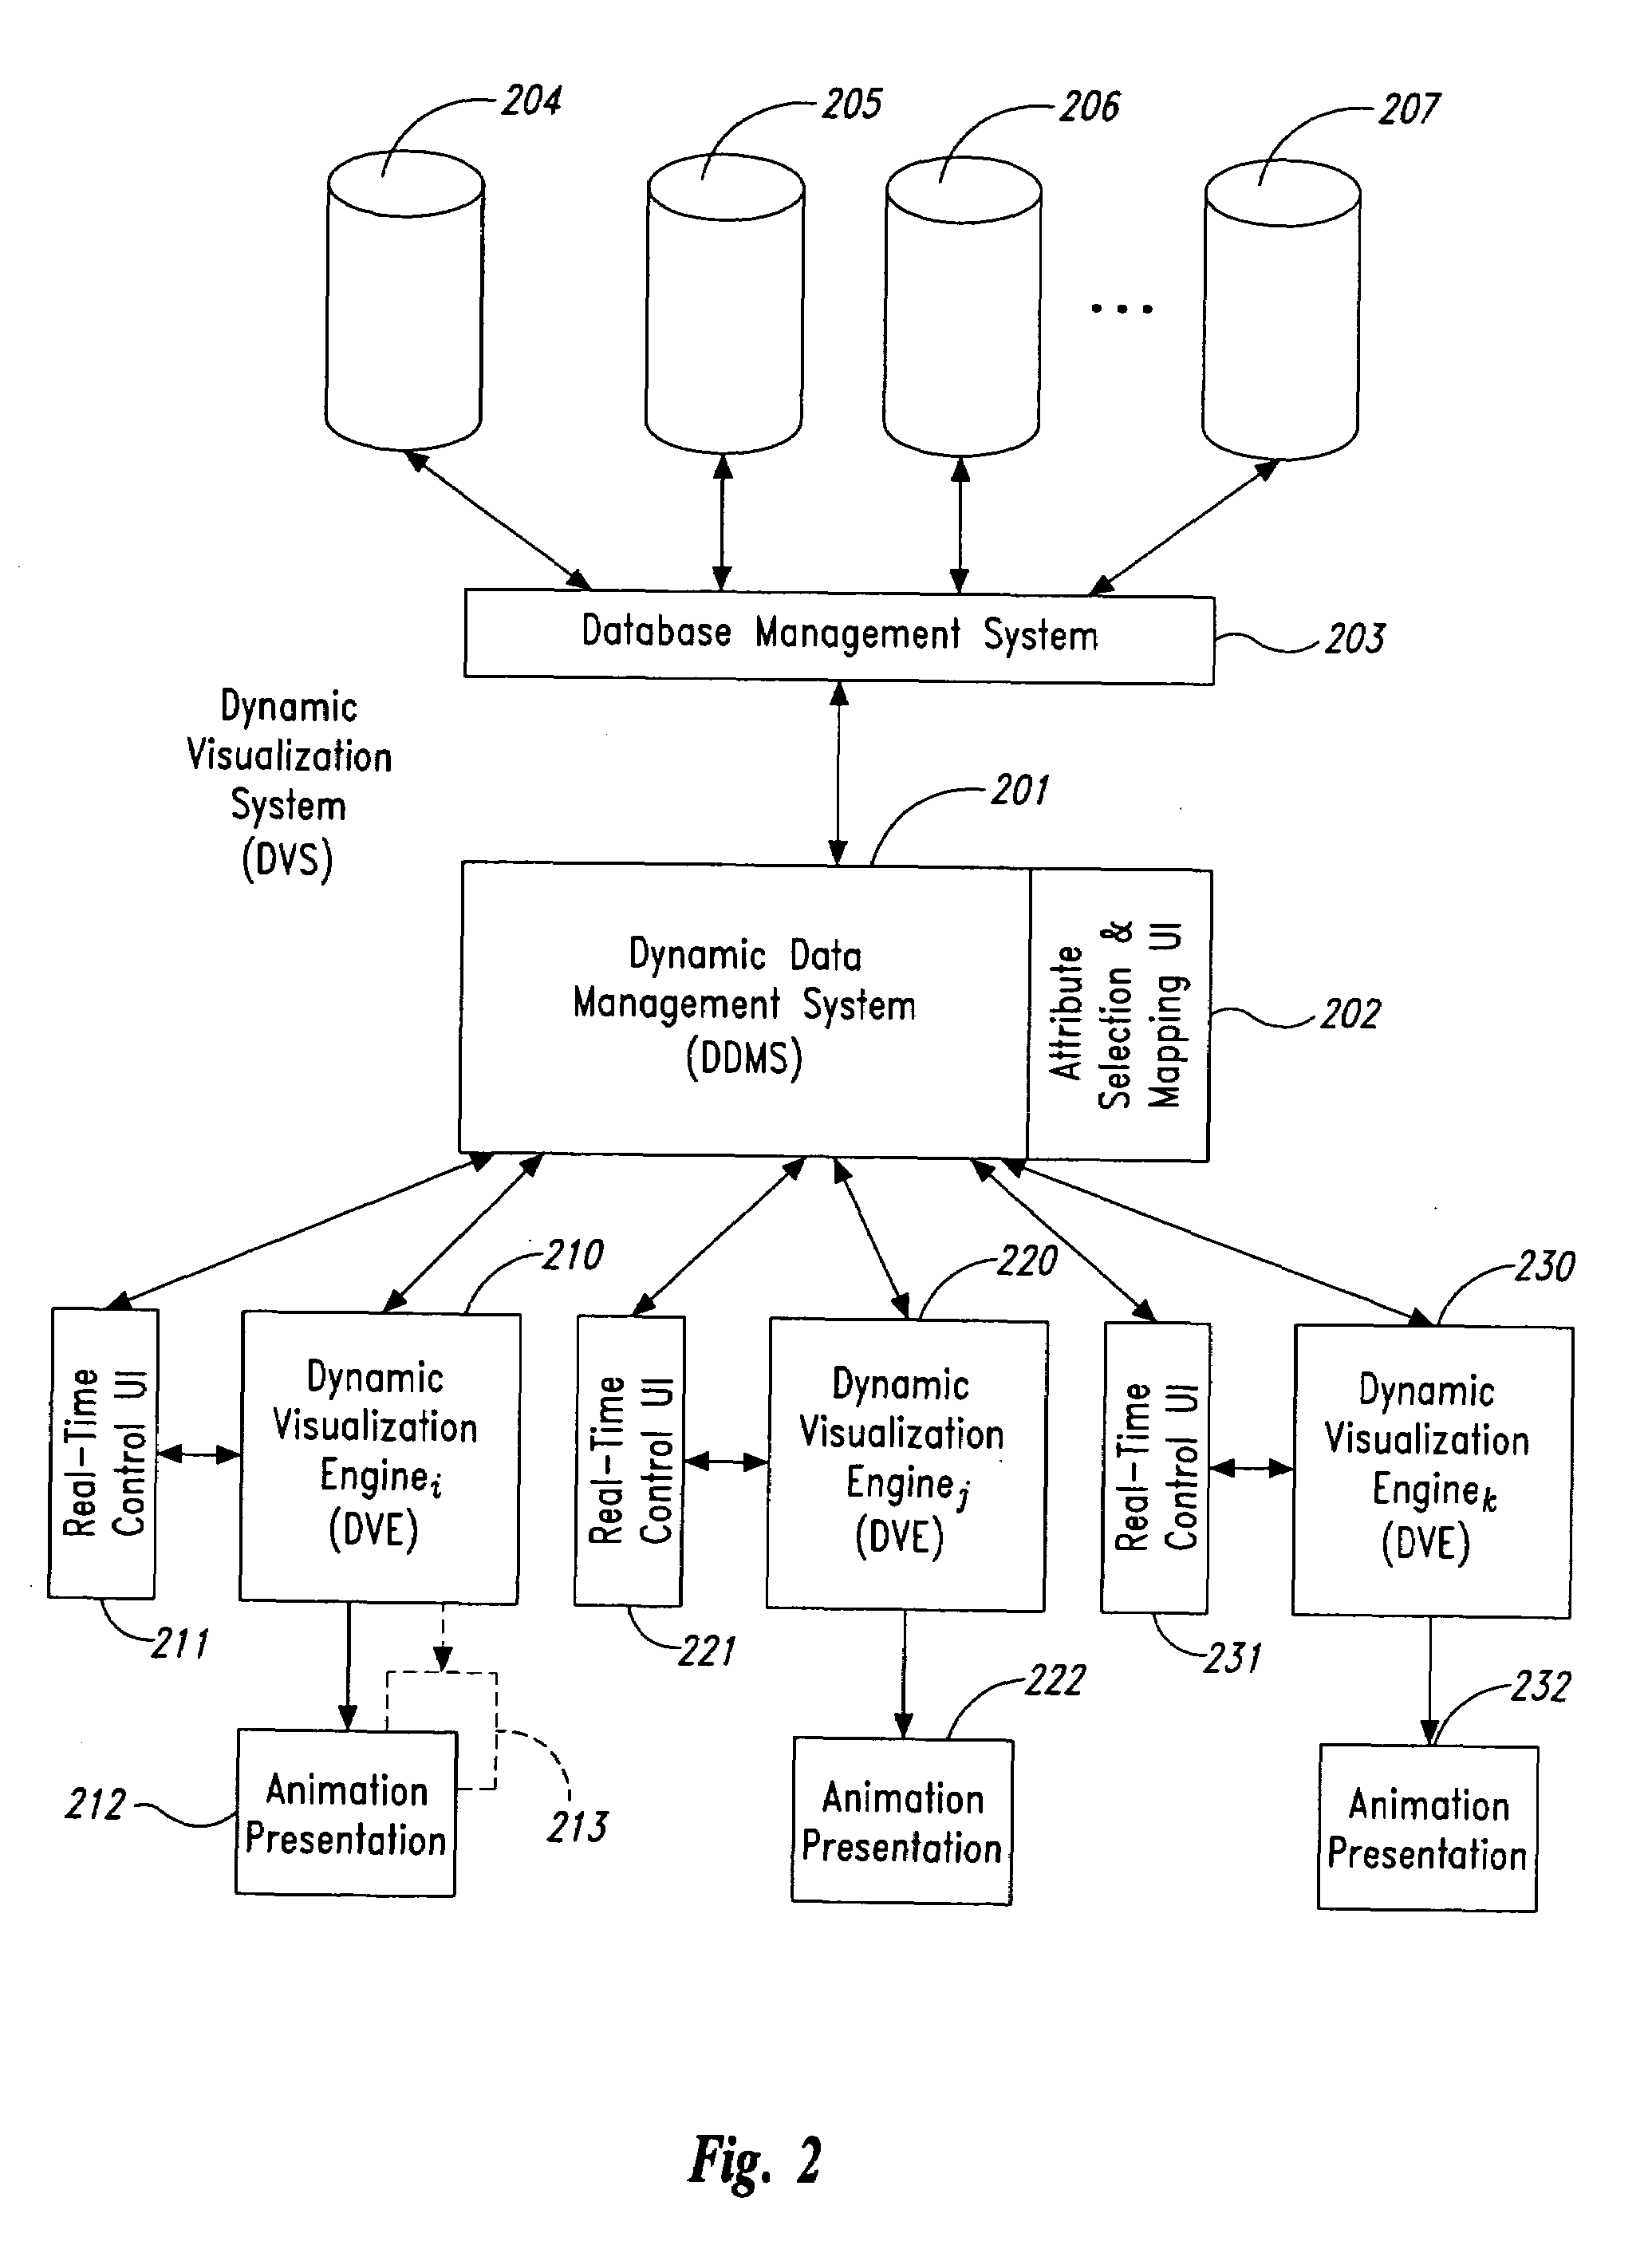
[0049]Embodiments of the present invention provide computer- and network-based methods and systems for dynamically determining and presenting appearance and spatial attribute values of subsets of multi-dimensional data over an index (a sequence) to assist in the recognition of patterns and trends within the data. Example embodiments provide a Dynamic Visualization System for the presentation of multi-dimensional data (a “DVS”), which enables users to identify patterns and trends in highly dimensional data, without being forced to reduce the information being presented by using data transformations. This allows users whose experience with the data is not sufficiently sophisticated for mentally modeling the data through such data transformations to instead identify trends by observing dynamically determined data values that are portrayed, for example, animated, over some sequence such as time. The dynamically determined data values are imputed in near real-time using functions that ar...


PUM


Abstract

Methods and systems for dynamic visualization of highly dimensional data are provided. Example embodiments provide a Dynamic Visualization System (a “DVS”), which maps data attributes to visualization dimensions and automatically imputes attribute values on-the-fly for each value of a sequencing dimension. Data having different resolutions can be simultaneously displayed in the same visualization. In one embodiment, the DVS comprises a Dynamic Data Management System with a user interface for specifying and mapping attributes, and one or more Dynamic Visualization Engines with near real-time control user interfaces. These components cooperate to define visualization scenarios based upon specified data subsets, determine and automatically execute a defined visualization, and allow analysts and other users to interactively modify the visualization.

Description

BACKGROUND OF THE INVENTION[0001]1. Field of the Invention[0002]The present invention relates to methods and systems for the display of multi-dimensional data and, in particular, to methods and systems for dynamically determining and presenting appearance and spatial attribute values of entities of the multi-dimensional data over a sequence to assist in the recognition of patterns and trends within the data.[0003]2. Background Information[0004]One of the consequences of the increasing computerization and digitization of almost all human activities is the presence of vast quantities of complex data. While capturing multiple aspects of activities and phenomena is becoming easier, comprehending the data so acquired is increasingly challenging.[0005]The process of comprehending data involves the reduction of the data by a human to a series of mental representations of the data, often fitting these representations into a pre-existing mental model. The mental model abstracting the data en...

Claims


Application Information

Patent Timeline
Patent Type & Authority Patents(United States)
IPC IPC(8): G06T11/20G06F3/14G06T17/40
CPCG06T11/206
Inventor PETERSON, BRUCE A.
Owner TERASTAT
Why Eureka
Try Eureka