It must also be noted that these needs become even more critical, and are even more difficult to satisfy, when personnel and expertise are limited.
A complex modern system, however, such as web-based enterprise systems, may involve thousands of performance
metrics,
ranging from relatively high-level
metrics, such as transaction
response time,
throughput and availability, to low-level metrics, such as the amount of physical memory in use on each computer on a network, the amount of
disk space available, or the number of threads executing on each processor on each computer, any of which or any combination of which may be significant to the operations of the system and abnormalities therein.
Due to the complexity of modern systems, however, and because of the large number of possibly significant metrics and combinations of metrics, it is unfortunately common for a
monitoring system or operator to miss monitoring at least some of the significant metrics or combinations of metrics
It is a relatively common occurrence, however, again due to the complexity of modern systems and the large number of possibly significant metrics and combinations of metrics, that a
monitoring system or an operator will become overwhelmed by the volume of information that is presented and will as a result miss or misinterpret indications of, for example, system abnormalities.
The clear and unambiguous identification and presentation of metrics and combinations of metrics accurately reflecting system performance or problems, in turn, involves a number of data collection and
processing operations, each of which involves unique and significant problems that have seriously limited the capabilities of
performance monitoring systems in the prior art and, as a consequence, the performance of the systems being monitored.
The problems of the prior art begin with the original collection of meaningful and timely information regarding system performance metrics.
The first recurring problem is therefore to select and collect sufficiently accurate and timely information pertaining to a sufficiently large number of performance metrics so as to have a useful representation of the system operation and performance.
Again, however, this is often an overwhelming task due to the potentially very large number of metrics of interest.
Another recurring problem area in
performance monitoring systems and methods of the prior art is in identifying those metrics, from all of the metrics that can be or that are monitored, that represent a current or past aspect of interest of the system performance.
The determination and setting of thresholds, however, can adversely effect the operation of the system since significant events may fail to trigger an alarm if a threshold is set too high, but an excessive number of false alarms can be generated if a threshold is set too low.
In complex systems that monitor thousands of metrics, however, this is often impractical since setting such thresholds is usually labor intensive and is typically prone to errors, particularly since the value of a given metric, and thus its thresholds, may be influenced by a number of other metrics.
Additionally, user-specified thresholds, which must typically be fixed due to the time and effort required to determine and set the thresholds, are inappropriate for many metrics, such as metrics for systems with time varying loads or performance levels.
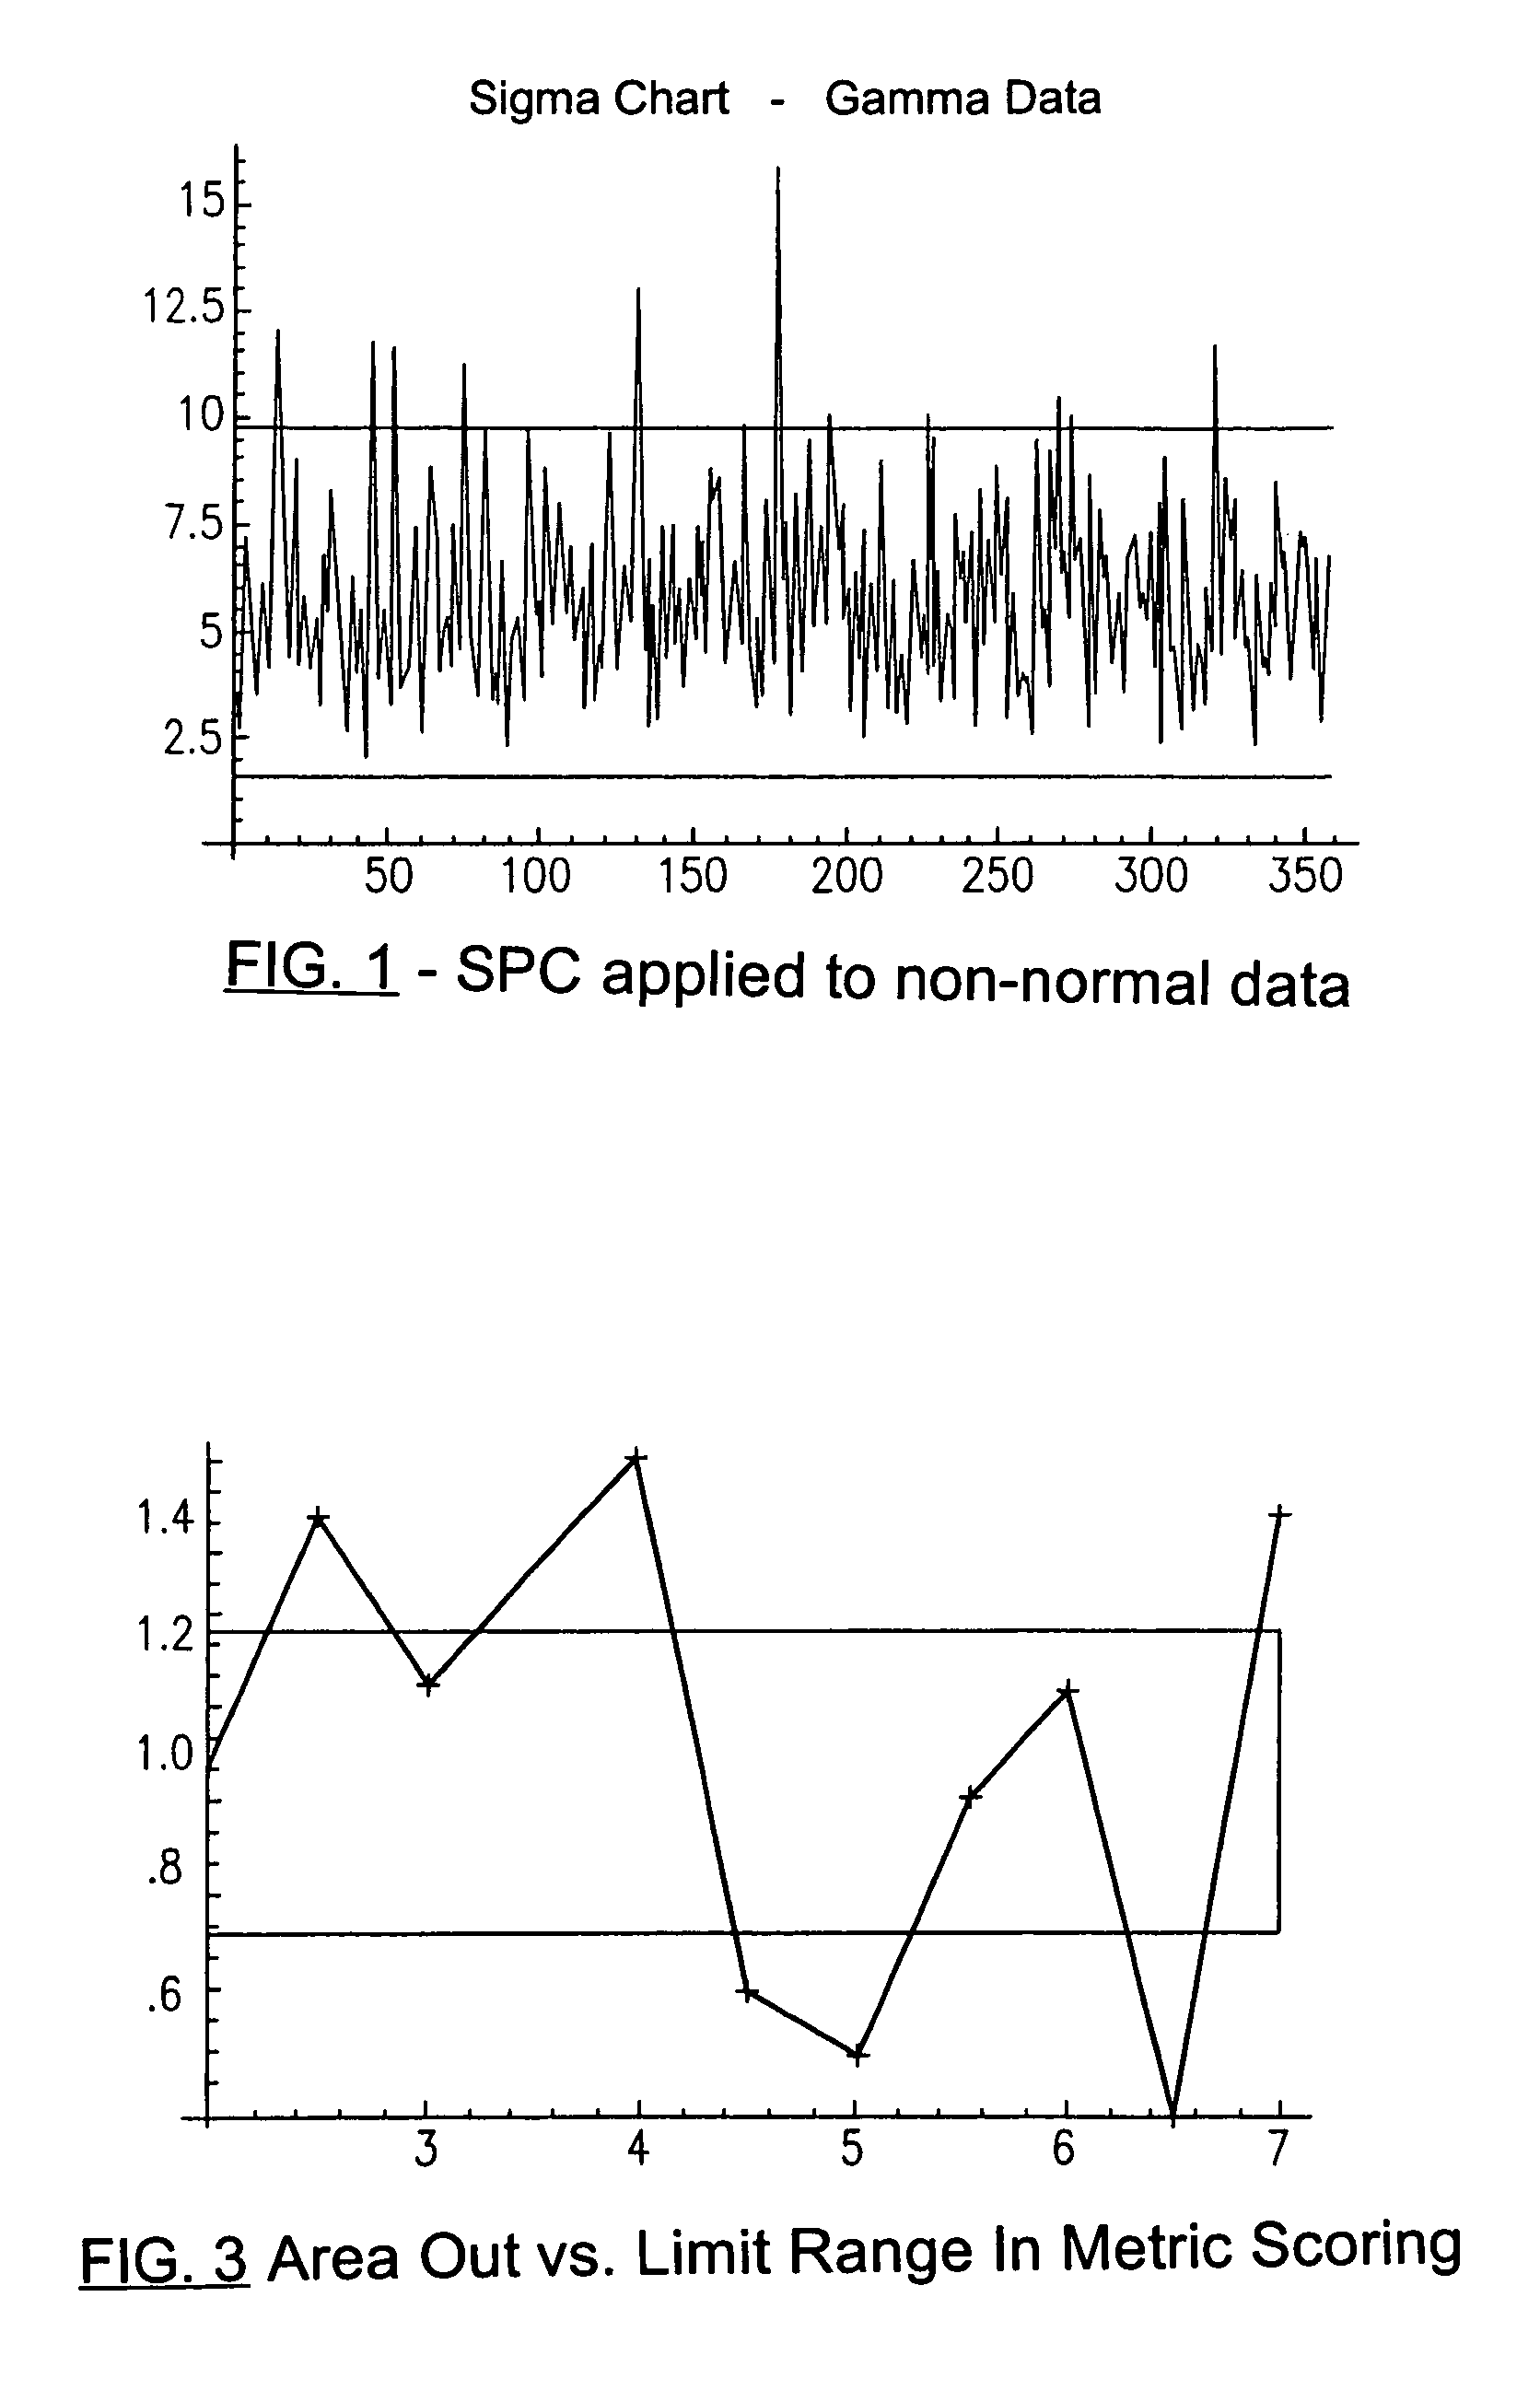
Unfortunately, however, the distribution of values of many metrics do not fit such “normal” of
Gaussian distributions, making the thresholds that are set using typical SPC techniques inappropriate for such metrics or systems.
In a further example, many performance metrics exhibit self-similar or fractal statistical distributions and, again, typical SPC techniques using normal or
Gaussian distributions will generally fail to produce optimal or even useful thresholds.
Such attempts have not been successful, however, because the underlying assumptions, that is, that processes for normal statistical distributions are valid for non-system distributions, are fundamentally fallacious no matter what is done to the data since the data is still fundamentally non-symmetric.
In addition, attempts to transform non-symmetric data into normal distribution data inherently and inescapably distorts the data, again resulting in fundamentally erroneous results.
Current dynamic threshold systems typically fail to address this issue.
In a still further typical problem in metric
thresholding, current dynamic threshold systems typically do not incorporate metric values occurring during alarm conditions, that is, during periods when the metric value exceeds the
current threshold, when adjusting the threshold value for the metric to accommodate changes in the metric value range over time.
This situation will often result in numerous
false alarm conditions until the threshold is adjusted to accommodate the shift in metric value range, which often requires manual adjustment of the threshold by an operator.
A still further recurring problem in monitoring the performance of a system is the methods for use of the information regarding system metrics to identify probable root causes of performance problems in complex, distributed, multi-tier applications, such as identifying metrics and correlations and groupings of metrics and metric behaviors that particularly reflect system performance or abnormalities.
This problem is typically due to or is aggravated by the large number of metrics and combinations of metrics and metric inter-relationships that must be considered.
Linear correlation techniques, however, are sensitive to “
outlier” metric values, that is, erroneous measurements of metric values, metric values that are significantly outside the expected range of values, that is, “spikes” in metric values.
In addition,
linear correlation techniques do not reliably or accurately detect or represent highly non-linear relationships between metrics.
For example,
cluster analysis divides metrics into static disjoint groups, so that it is difficult to use these algorithms in situations where the relations between metrics may change.
It then becomes impossible or at least impractical to track the changing correlations between metrics and, as a result, a
cluster analysis based system can overlook correlations of metrics between groups and thus miss possible problem causes.
Lastly, the above discussed problems with the techniques employed by typical monitoring systems in correlating or grouping metrics for the purpose of determining system performance or problems is further compounded because these methods are difficult to apply to dynamic or adaptive systems.
As in the case of metric pair correlation, for example, the number of operations required to dynamically update the metric thresholds to reflect the current ranges of metric values will often render this method impractical.

