Price charting system and technique

a price charting and price technology, applied in the field of financial data processing and analysis, can solve the problems of many market analysis strategies relying too heavily on the opinion of users, too much “gray area”, little long-term usefulness, etc., and achieves the effect of quick analysis of historical characteristics of any market, little effort, and quick determination

Inactive Publication Date: 2008-12-02
MICROQUANT
View PDF10 Cites 41 Cited by
  • Summary
  • Abstract
  • Description
  • Claims
  • Application Information

AI Technical Summary

Benefits of technology

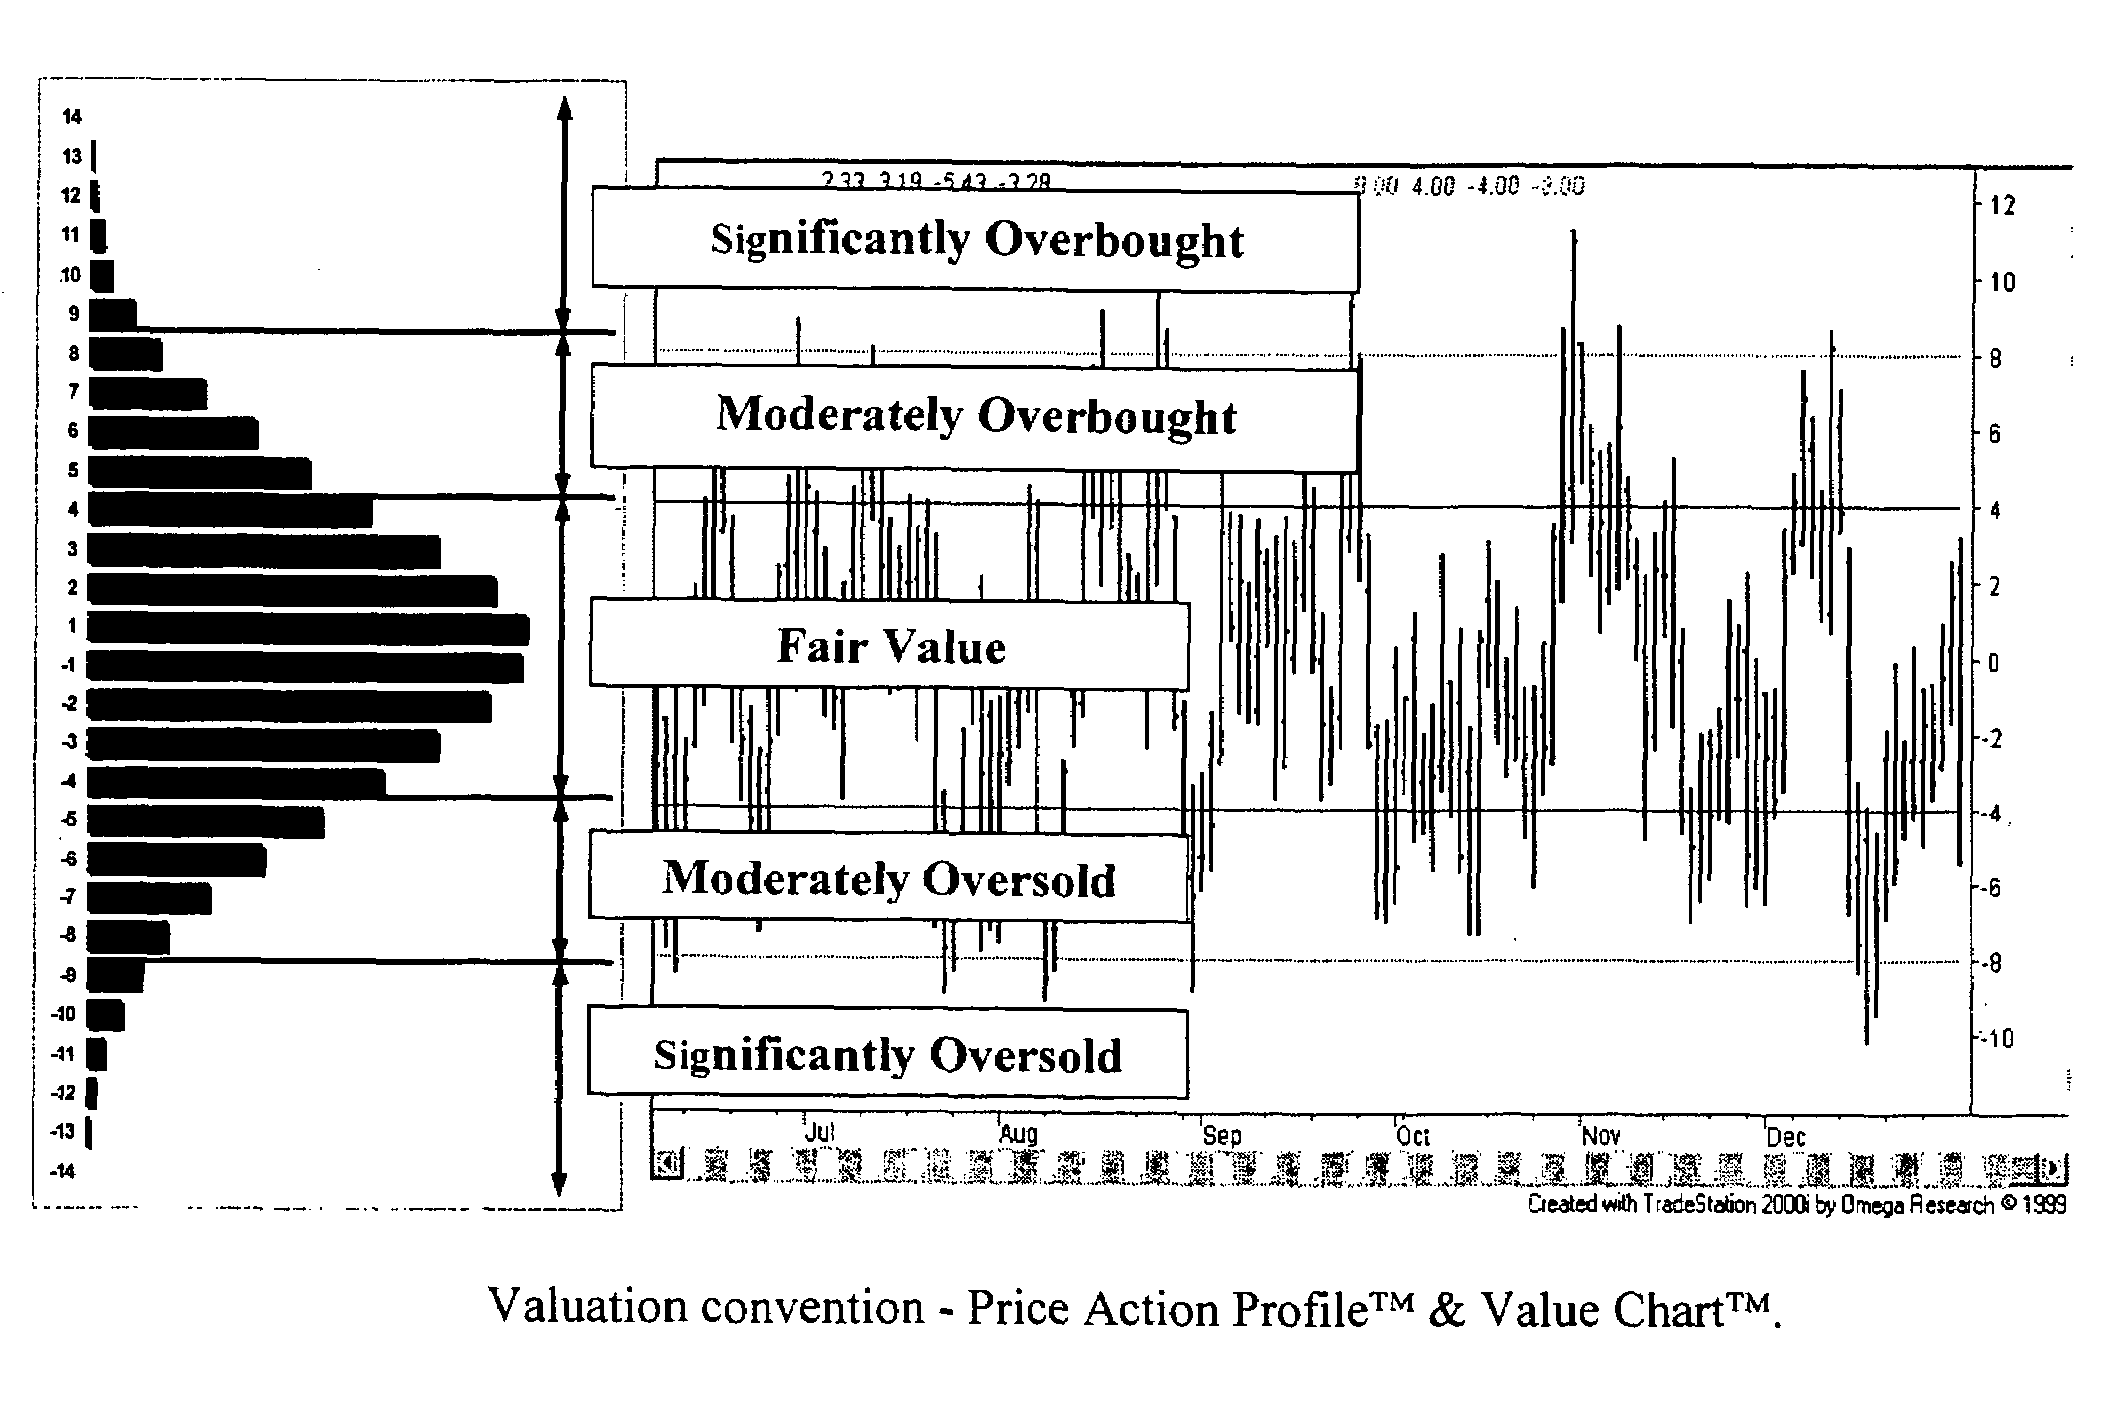
[0017]Like traditional bar charts, Value Charts™ allow investors to quickly analyze the historical characteristics of any market. However, in addition to this, Value Charts™ along with Price Action Profile™ allow investors to quickly analyze the current relative overbought or oversold state of any market with little effort. These innovative new market analysis techniques give investors the ability to quickly determine whether a market is overbought, oversold, or trading at fair value. In a powerful new way, these market analysis tools allow investors to quantify value in a market. In addition to these benefits, Value Charts™ now make it possible for trading system developers to create mathematical trading models that can generate buy or sell signals at Value Chart™ price levels, not just the at the open or close of a trading session. Furthermore, by using Value Charts™ and Price Action Profile™, computers can now scan thousands of markets to search for markets that are currently overbought or oversold, as defined by Value Charts™. Traders can use this new technology to track the overbought or oversold state of any market across different time frame price bars (i.e. 30-minute, daily, weekly, monthly, etc.).

Problems solved by technology

Many market analysis strategies rely too heavily on the opinion of the user when determining when certain rules or conditions are met.
Market analysis strategies that rely on the judgement of a trader when determining trading signals often contain too much “gray area” and have little long-term usefulness.
This is primarily because price charts are easy to read and they condense information, which saves us time.
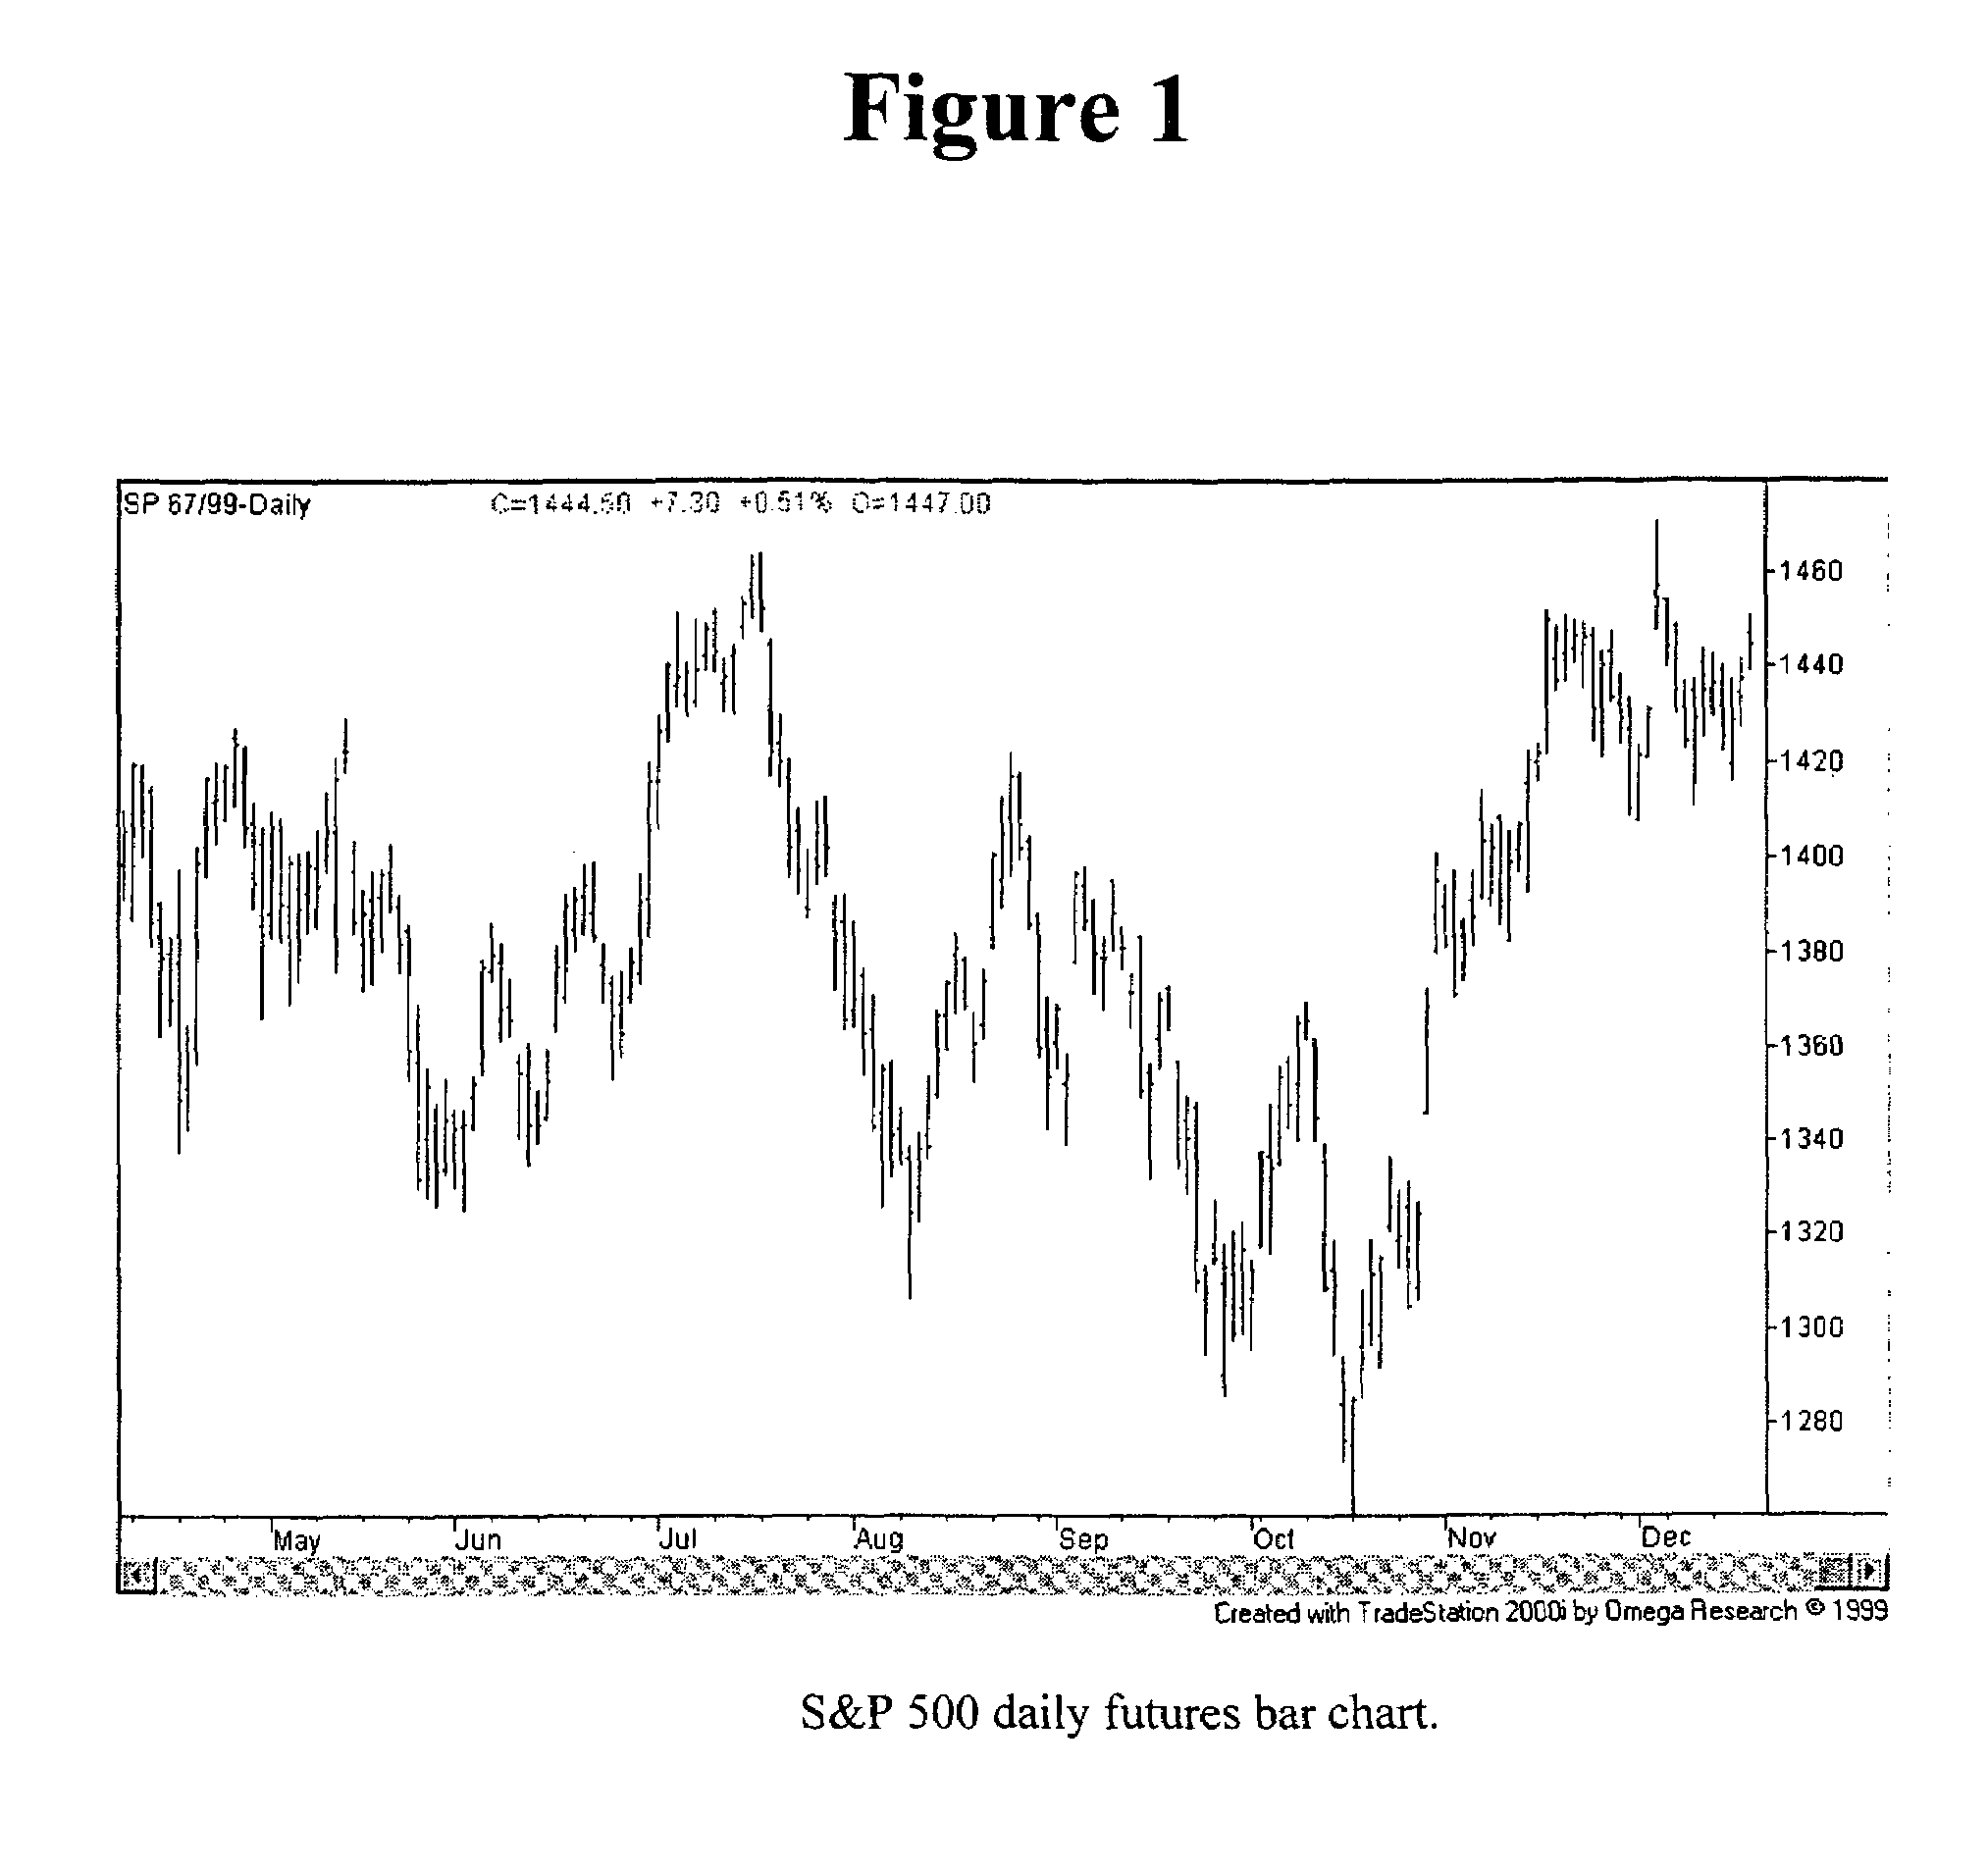
Traditional price charts, however, are not effective in identifying relative value.
In hindsight we can identify overbought and oversold price levels but they are all but impossible to identify real-time using traditional bar charts.
At first this statement may not make a lot of sense.
Furthermore, it is possible for a market to be undervalued with respect to a short-term time frame and overvalued with respect to the long-term time frame.
Although traditional bar charts are useful when trading, they are not useful in identifying relative overbought and relative oversold price levels.

Method used


Image

  • Price charting system and technique
  • Price charting system and technique
  • Price charting system and technique

Examples


Embodiment Construction

Value Charts™

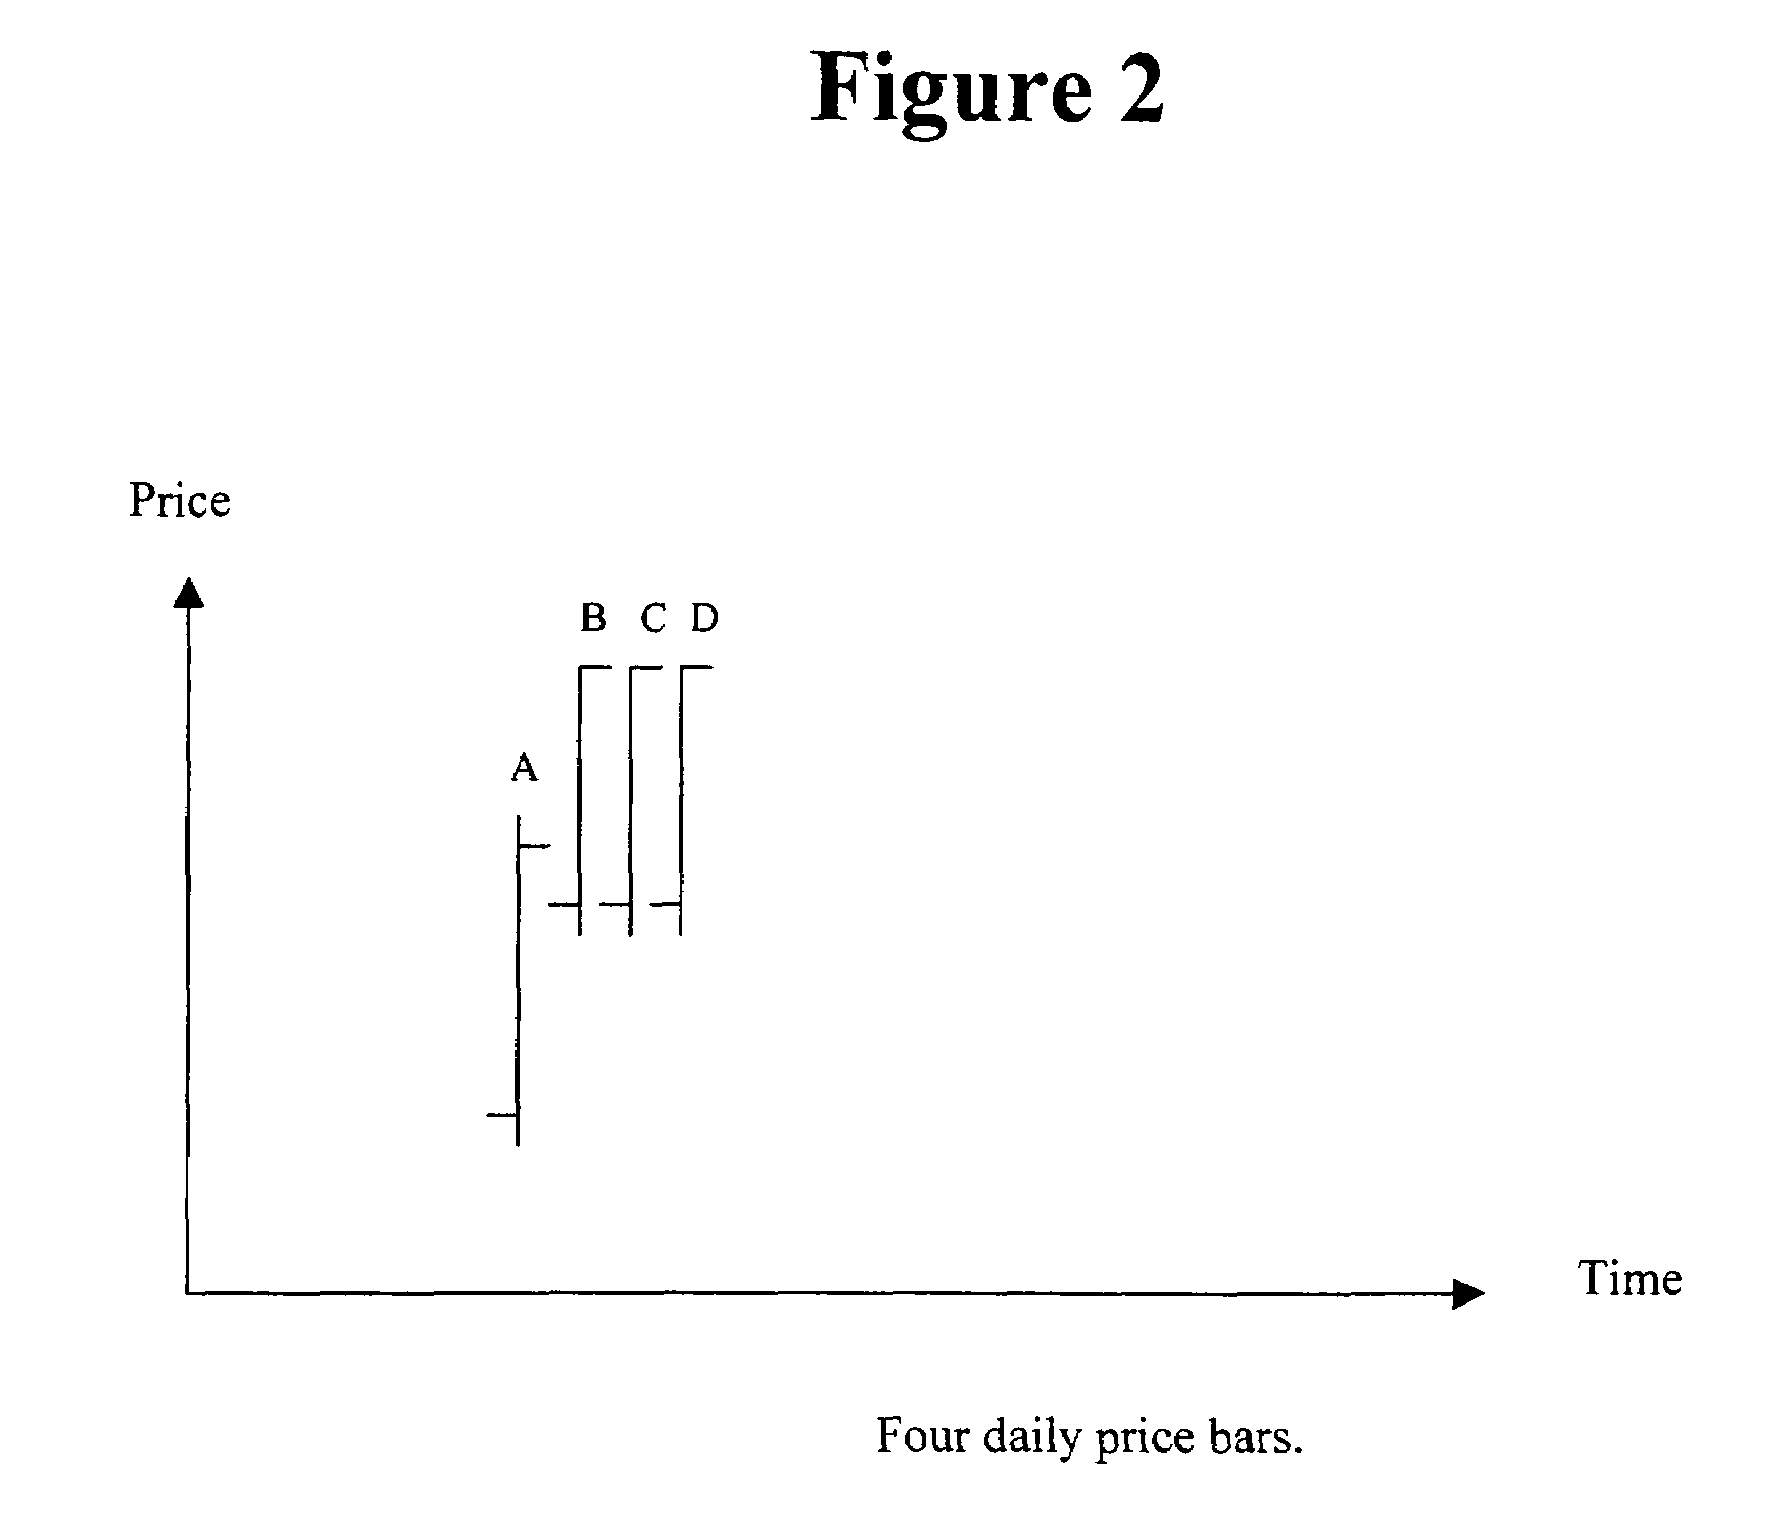
[0067]Although traditional bar charts are useful for referencing the historical and current price activity of a market, we need to have the ability to chart price in a new way so that they can clearly identify relative overbought and oversold price levels. In other words, we need to chart price bars on a relative basis instead of an absolute basis.

[0068]In this type of chart, such a relative basis may be based on a simple 5-day moving average of the median bar chart price (see Formulas for calculating a Relative Chart below) as the reference axis. Therefore, instead of plotting price with respect to zero, the price is plotted (open, high, low, and close) with respect to this simple 5-day median moving average, which we will refer to as the floating axis. Price given in terms of its relation to the floating axis, instead of zero, will be referred to as relative price (see FIG. 3).

Formulas for Calculating a Relative Chart

[0069]Median Price=(High+Low)÷2

[0070]Floating Axis=...


PUM


Abstract

The invention is directed to a market price charting method for displaying both current and historical price activity in terms of valuation rather than absolute price. The invention allows users to quantify the degree in which a market is overbought or oversold. Results may be displayed electronically or on a hard copy for viewing or used in additional analysis of a market.

Description

FIELD OF THE INVENTION[0001]The present invention relates generally to financial data processing and analysis, and more specifically, to an internet or a computer-implemented system and technique for producing enhanced price charts to allow investors to quickly and easily analyze the relative overbought or oversold state of any market and for generating quantifiable relative overbought and oversold price levels to drive (feed) mathematical trading systems or help investors strategically enter or exit markets.BACKGROUND OF THE INVENTION[0002]In today's fast-paced financial markets, investors need to access information quickly and easily in order to process trading decisions. With the significant growth of online trading, individual investors need effective market analysis tools to help them make better trading decisions. Because the saying “a picture is worth a thousand words” still holds true, traders all over the world rely on traditional bar charts to display both past and present...

Claims


Application Information

Patent Timeline
Patent Type & Authority Patents(United States)
IPC IPC(8): G06Q40/00G06F17/00
CPCG06Q40/00G06Q40/04G06Q40/06
Inventor HELWEG, MARK WEB
Owner MICROQUANT
Why Eureka
Try Eureka