Method for analyzing signal waveform and analyzing vehicle dynamic characteristic

a signal waveform and vehicle technology, applied in the direction of resistance/reactance/impedence, testing circuits, instruments, etc., can solve the problems of difficult to detect the 10 hz component correctly, difficult to extract accurate frequency of oscillatory components of signals,

Active Publication Date: 2009-04-21
MEIDENSHA ELECTRIC MFG CO LTD +1
View PDF4 Cites 122 Cited by
  • Summary
  • Abstract
  • Description
  • Claims
  • Application Information

AI Technical Summary

Problems solved by technology

When a Fourier analysis is performed on a signal containing an oscillatory component and a trend component as shown in FIG. 27, it is difficult to extract accurately the frequency of the oscillatory component of the signal under the influence of the trend component of the signal in many cases.
As a result, it is difficult to detect correctly the 10 Hz component shown in FIG. 29 with the above method.
However, as mentioned above, it is difficult to detect them with conventional analysis methods.
Since such a process is performed not automatically but manually by an operator, there is a problem that the standard of evaluation is not fixed and that it takes much time to calculate various characteristic values on vehicle driveability.

Method used


Image

  • Method for analyzing signal waveform and analyzing vehicle dynamic characteristic
  • Method for analyzing signal waveform and analyzing vehicle dynamic characteristic
  • Method for analyzing signal waveform and analyzing vehicle dynamic characteristic

Examples


first embodiment

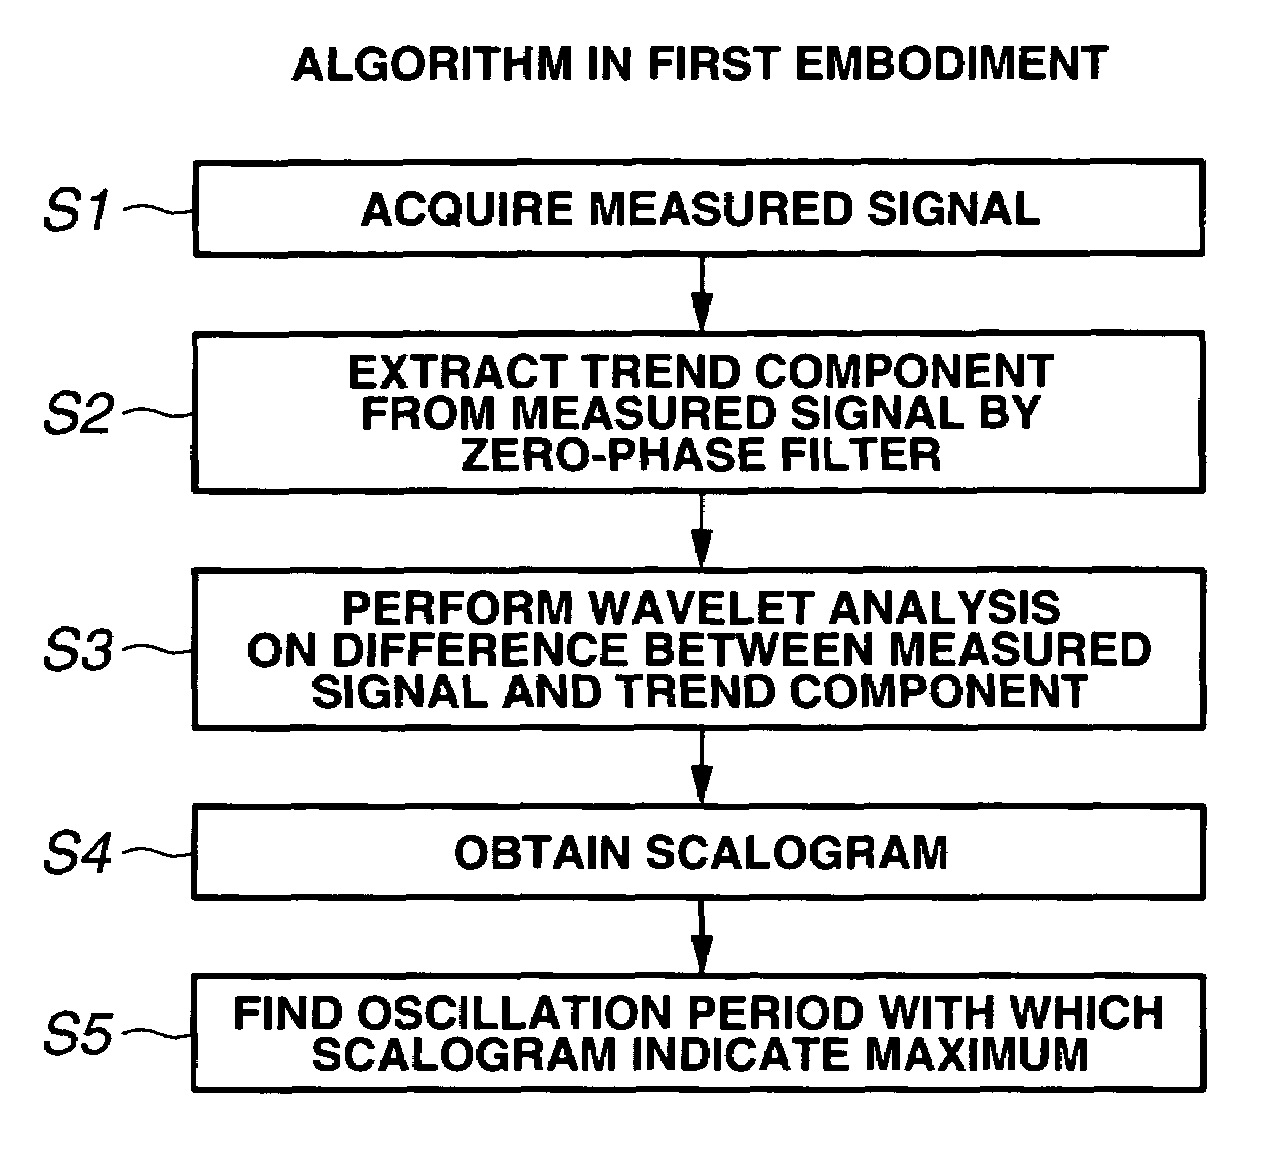
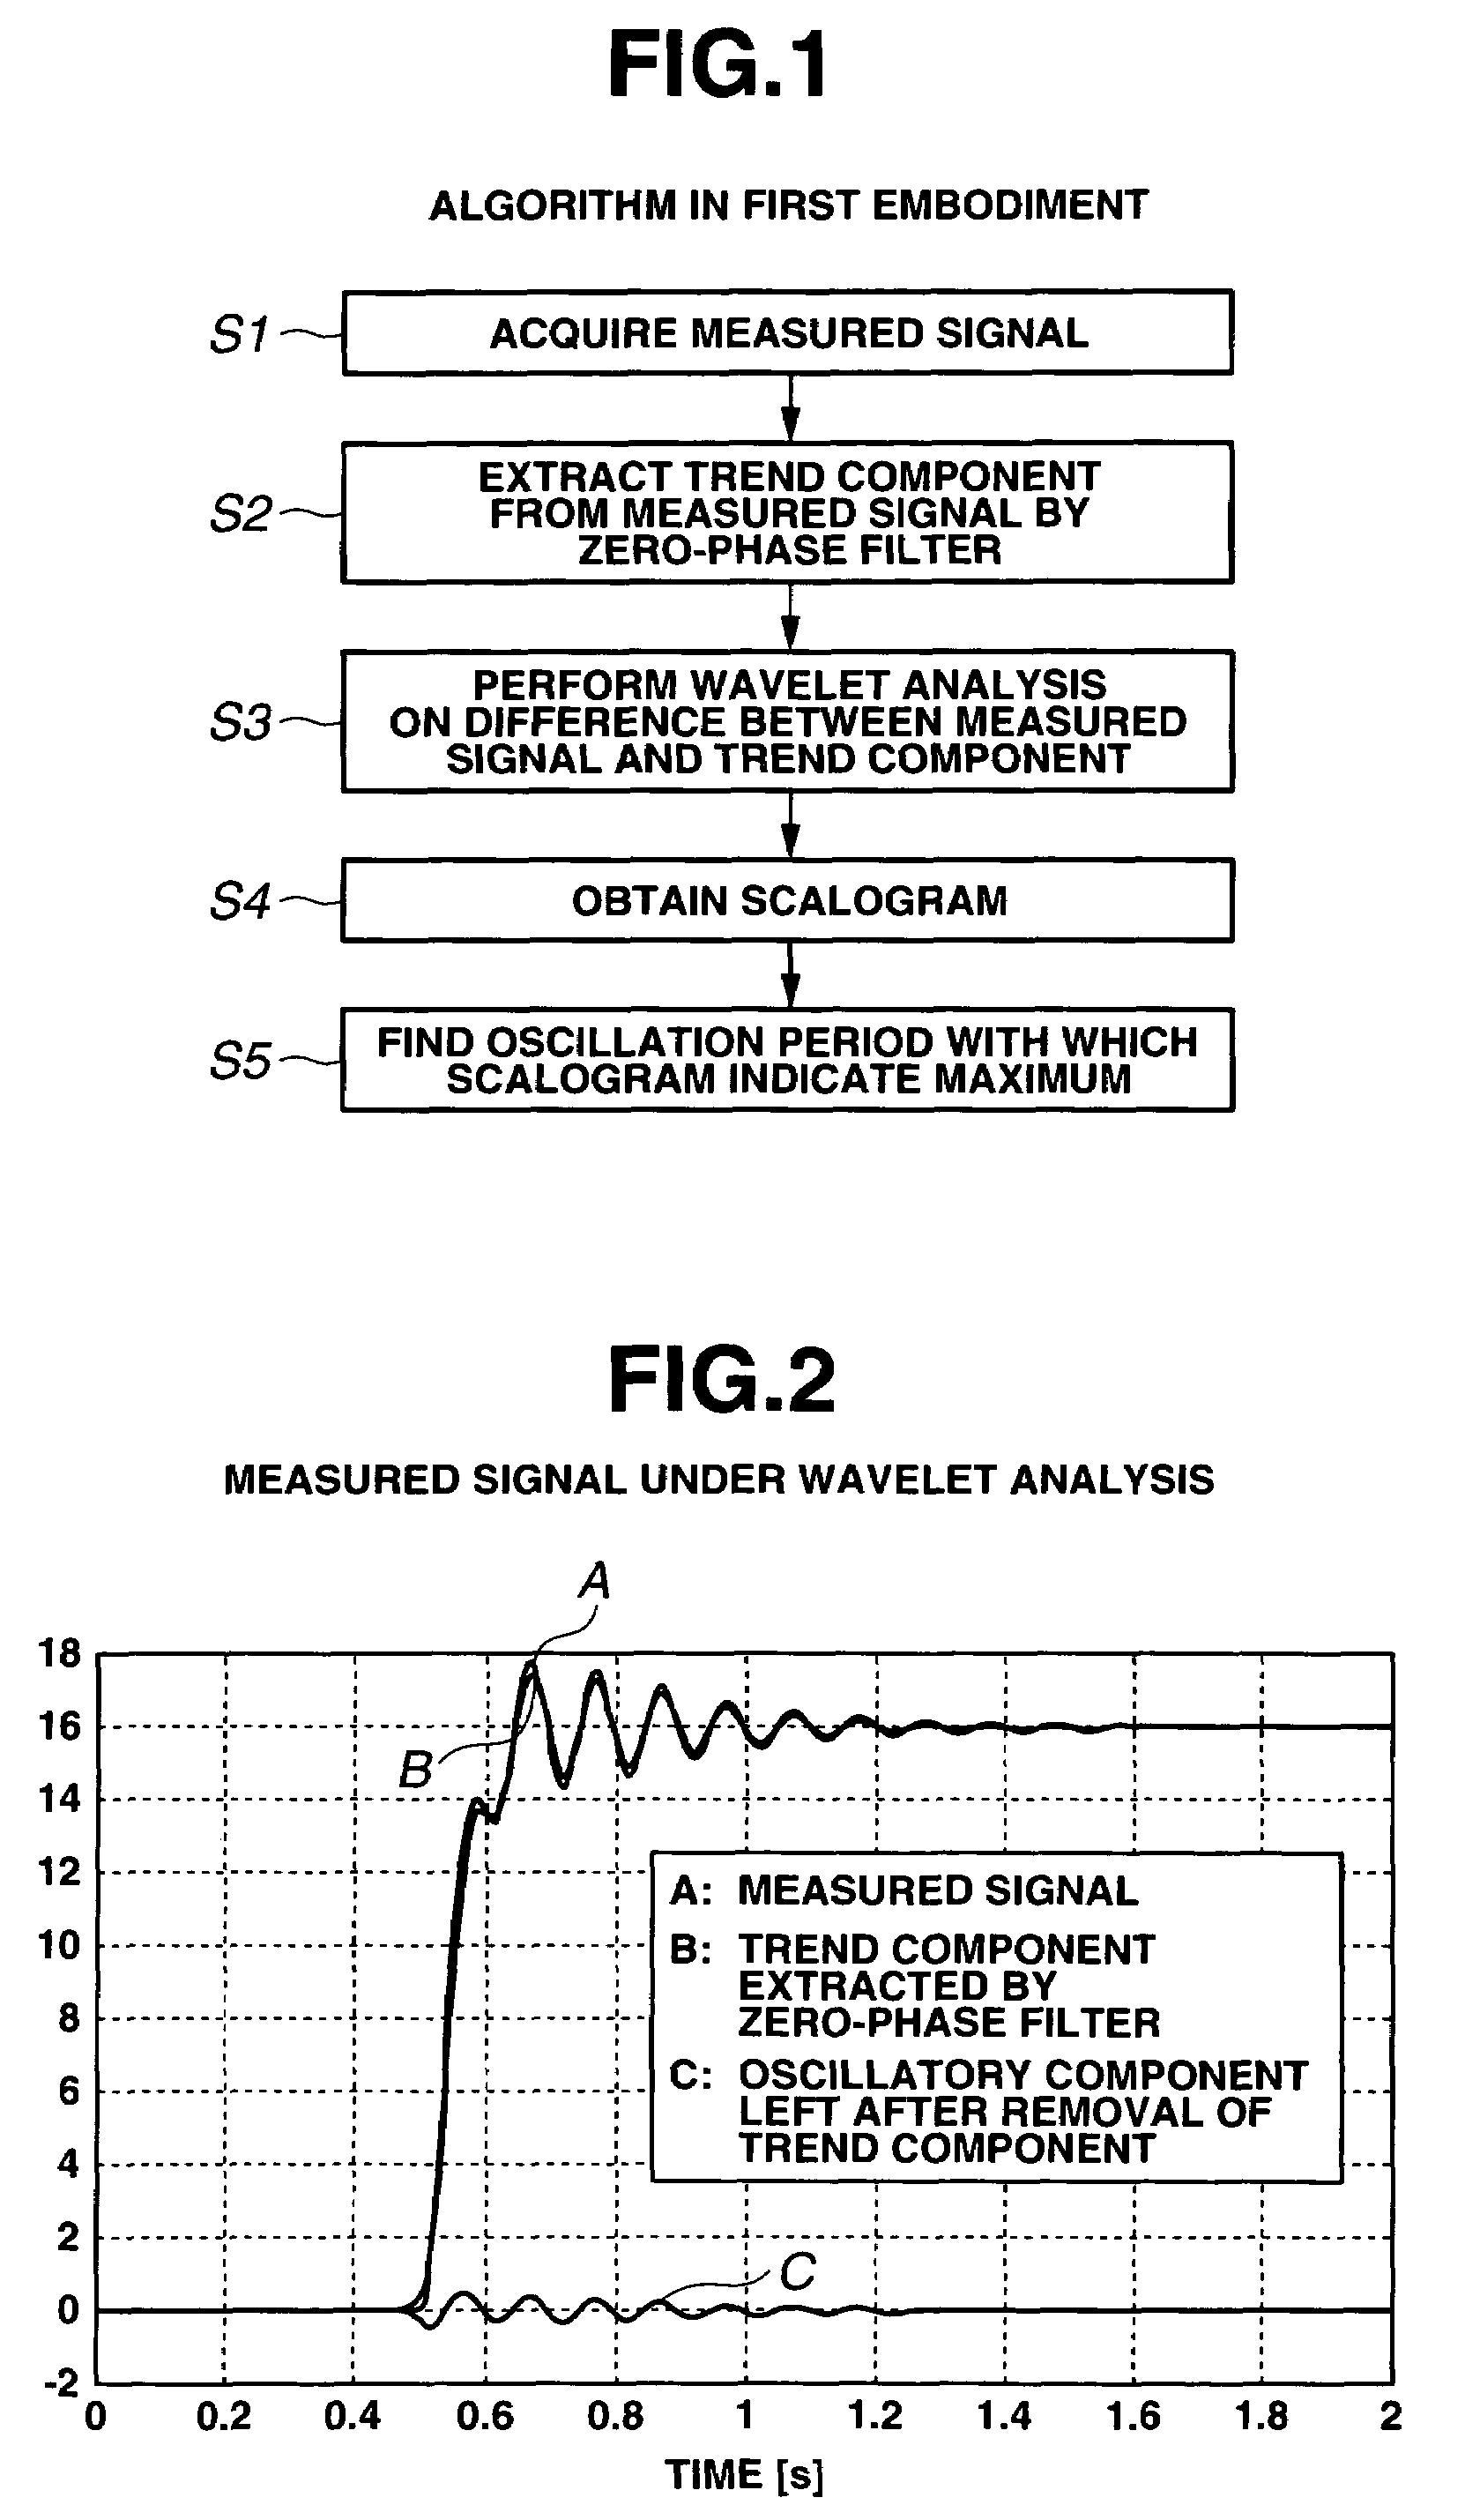
[0050]FIG. 1 is a flow chart showing an algorithm in accordance with a first embodiment of the present invention. As shown in FIG. 1, the algorithm comprises Steps S1 to S5 to be executed in sequence. Step S1 is to acquire and record a measured signal on a piece of recording media, such as a data recorder. Step S2 is to extract a trend component from the measured signal using a zero-phase filter. The zero-phase filter serves to extract a trend component without phase delay. Step S3 is to extract an oscillatory component from the measured signal, that is, to determine the difference between the trend component and the measured signal, and to perform a wavelet analysis on this oscillatory component. Step S4 is to obtain a wavelet scalogram of the oscillatory component of the measured signal. Step S5 is to find an oscillation period with which the wavelet scalogram indicates a global maximum.

[0051]FIG. 2 shows how a trend component is extracted from a measured signal at Step S2. In FIG...

second embodiment

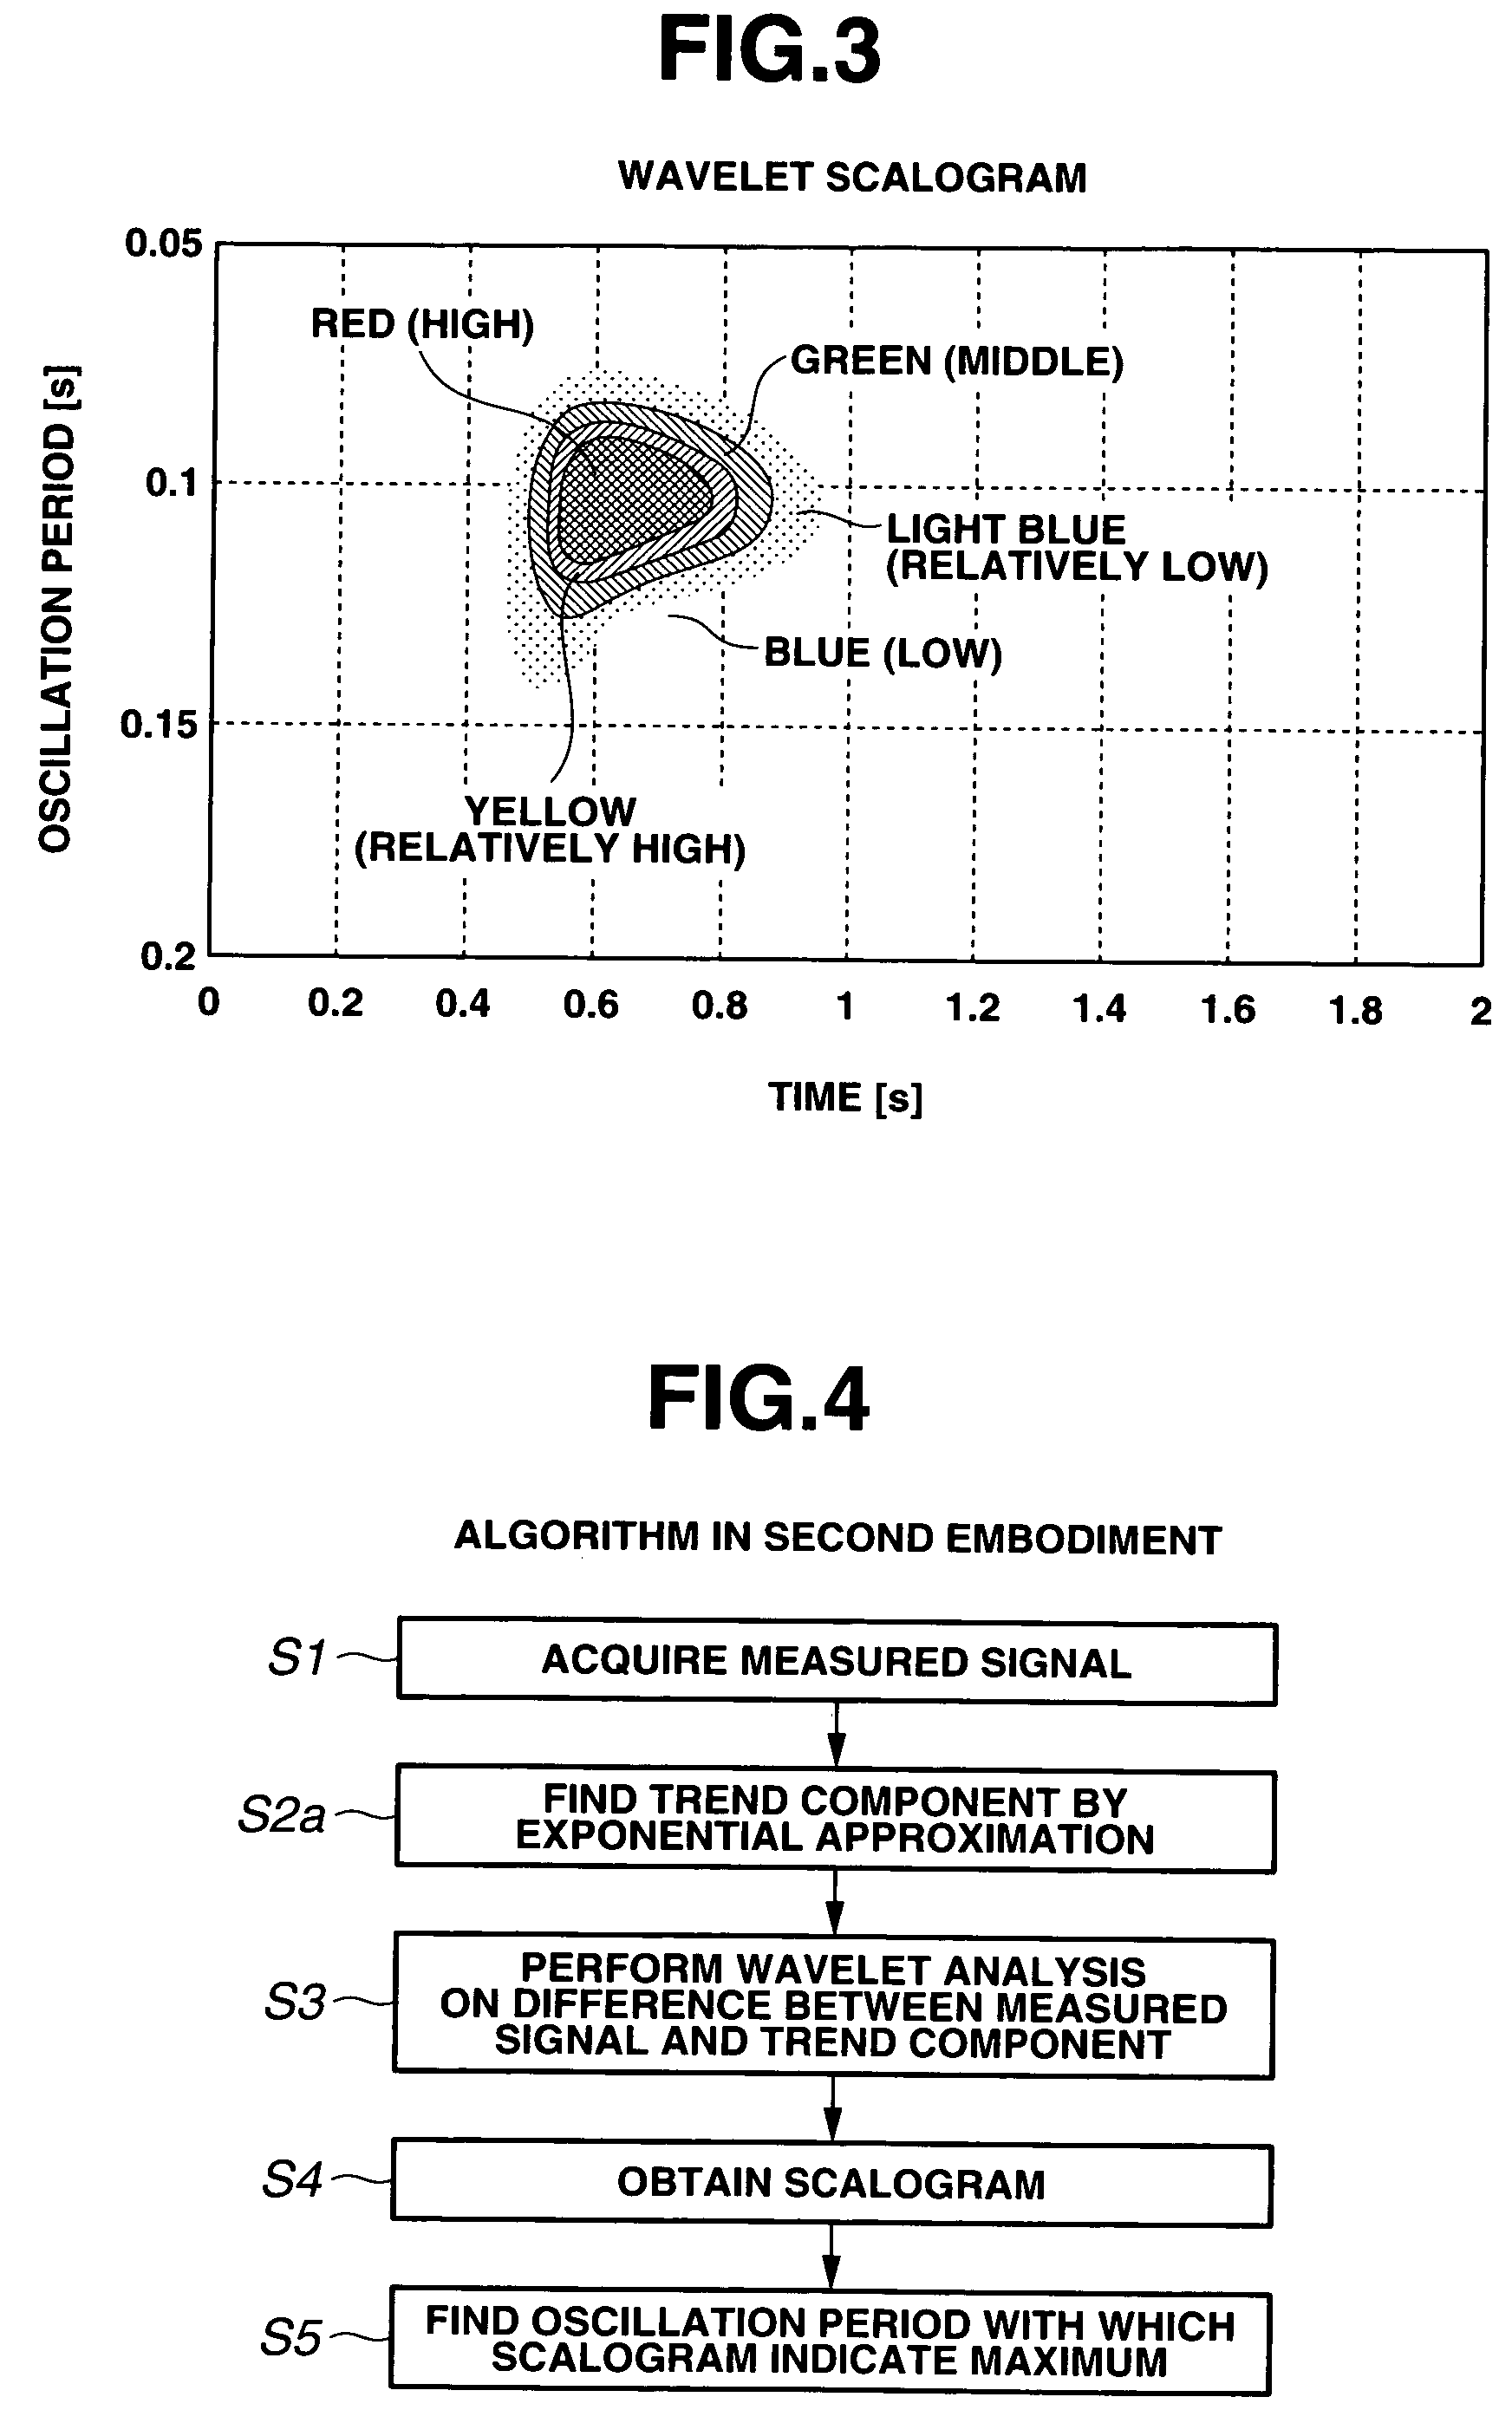
[0054]FIG. 4 is a flow chart showing an algorithm in accordance with a second embodiment of the present invention. As shown in FIG. 4, the algorithm comprises Steps S1 to S5 to be executed in sequence. The analysis method of the second embodiment differs from that of the first embodiment in that Step S2a is provided to find a trend component by exponential approximation. In the case of an automatic transmission vehicle, a shift operation of the automatic transmission may generate an acceleration signal waveform as shown in FIG. 5B. In FIG. 5B, when an accelerator opening signal occurs at time t0, the acceleration signal rises at time t1 with a certain delay, fluctuates around a value G1 after time t1, and rises toward a value G2 at time t2. In such a case, if a measured signal is applied with a zero-phase filter as in the first embodiment, the inclination of a rise of the measured signal is reduced so that it is difficult to extract accurately an oscillatory component of the measure...

third embodiment

[0057]FIG. 6 is a flow chart showing an algorithm in accordance with a third embodiment of the present invention. As shown in FIG. 6, the algorithm comprises Steps S1 to S5a to be executed in sequence. The analysis method of the third embodiment differs from that of the first embodiment of FIG. 1 in that Step S5a is provided instead of Step S5 of the first embodiment. Specifically, Step S1 is to acquire and record a measured signal on a piece of recording media, such as a data recorder. Step S2 is to extract a trend component from the measured signal using a zero-phase filter. The zero-phase filter serves to extract a trend component without phase delay. Step S3 is to extract an oscillatory component from the measured signal, that is, to determine the difference between the trend component and the measured signal, and to perform a wavelet analysis on this oscillatory component. Step S4 is to obtain a wavelet scalogram of the oscillatory component of the measured signal. Step S5a is ...


PUM


Abstract

A signal waveform analysis method includes: determining a trend component of an object signal by applying a zero-phase filter to the object signal; determining an oscillatory component of the object signal by removing the trend component from the object signal; determining a wavelet scalogram by performing a wavelet analysis on the oscillatory component; and determining an oscillation period of the object signal with which the wavelet scalogram indicates a maximum. The signal waveform analysis method is employed to evaluate vehicle dynamic characteristics.

Description

BACKGROUND OF THE INVENTION[0001]The present invention relates to a method for analyzing a signal waveform containing an oscillatory component and an aperiodic component, a computer program implementing the signal waveform analysis method, a method for analyzing vehicle dynamic characteristics with the signal waveform analysis method, and a computer program implementing the vehicle dynamic characteristic analysis method.[0002]Conventionally, there is a method of analyzing the period of an oscillatory component of such a measured signal as indicative of an acceleration of a machine at acceleration or deceleration when the measured signal contains an oscillatory component and an aperiodic component (or henceforth referred to as “trend component”). One such analysis method includes removing the average or linear regression component of the whole measured signal from the measured signal and performing a Fourier analysis on the processed signal, while another such analysis method include...

Claims


Application Information

Patent Timeline
Patent Type & Authority Patents(United States)
IPC IPC(8): G06K9/00
CPCG06K9/00516G06F18/00G06F2218/06
Inventor AKIYAMA, TAKAOSUZUKI, MASAHIKOSAGIYAMA, TATSUYAYOSHIDA, TERUOFUNAHASHI, YOICHI
Owner MEIDENSHA ELECTRIC MFG CO LTD
Why Eureka
Try Eureka