Dispersion extraction for acoustic data using time frequency analysis

a time frequency analysis and extraction technology, applied in the field of acoustic data analysis, can solve the problems of generating biased results, unable to achieve large arrays of tens of sensors, and unable to achieve the resolution and accuracy necessary to produce useful answers

Active Publication Date: 2010-01-19
SCHLUMBERGER TECH CORP
View PDF5 Cites 18 Cited by
  • Summary
  • Abstract
  • Description
  • Claims
  • Application Information

AI Technical Summary

Problems solved by technology

However, models are presently available for only simpler cases, and other physical parameters still need to be known.
Further, there is a risk that biased results will be produced if there is model mismatch or input parameter error.
These also require user input, and in some cases the results may be sensitive to the latter, requiring expert users for correctly processing the data.
However, its effectiveness is limited to large arrays of tens of sensors.
For applications with fewer sensors, such as commonly found in sensor arrays (2-13 sensors) on borehole wireline and LWD tools, this technique may lack the necessary resolution and accuracy to produce useful answers.
However, while this is an effective tool for studying dispersion behavior in a supervised setting with user input, it produces unlabelled dots on the f-k plane frequency by frequency and therefore may not be entirely suitable for deployment as an automated unsupervised processing method.
Moreover, the operation of the FFT washes out the information pertaining to the time of arrival of various propagating modes, thereby compromising performance and the effectiveness of interpretation, especially for weaker modes of interest overlapping with stronger ones in frequency domain.
However this is limited to the particular (flexural) dispersive mode, and cannot be readily extended to the general case.
However, the algorithm does not account for attenuation and has a propagation model with a pure phase response.
Extending this approach to include attenuation would make it a 3-D search, which would be relatively computationally intensive for commercial real time applications.
Finally, the use of this approach as well as the criterion of maximum energy for identifying propagating modes on the time-frequency maps generated above may obscure weak modes of interest by stronger in-band interfering modes even when they are separated in time.

Method used


Image

  • Dispersion extraction for acoustic data using time frequency analysis
  • Dispersion extraction for acoustic data using time frequency analysis
  • Dispersion extraction for acoustic data using time frequency analysis

Examples


Embodiment Construction

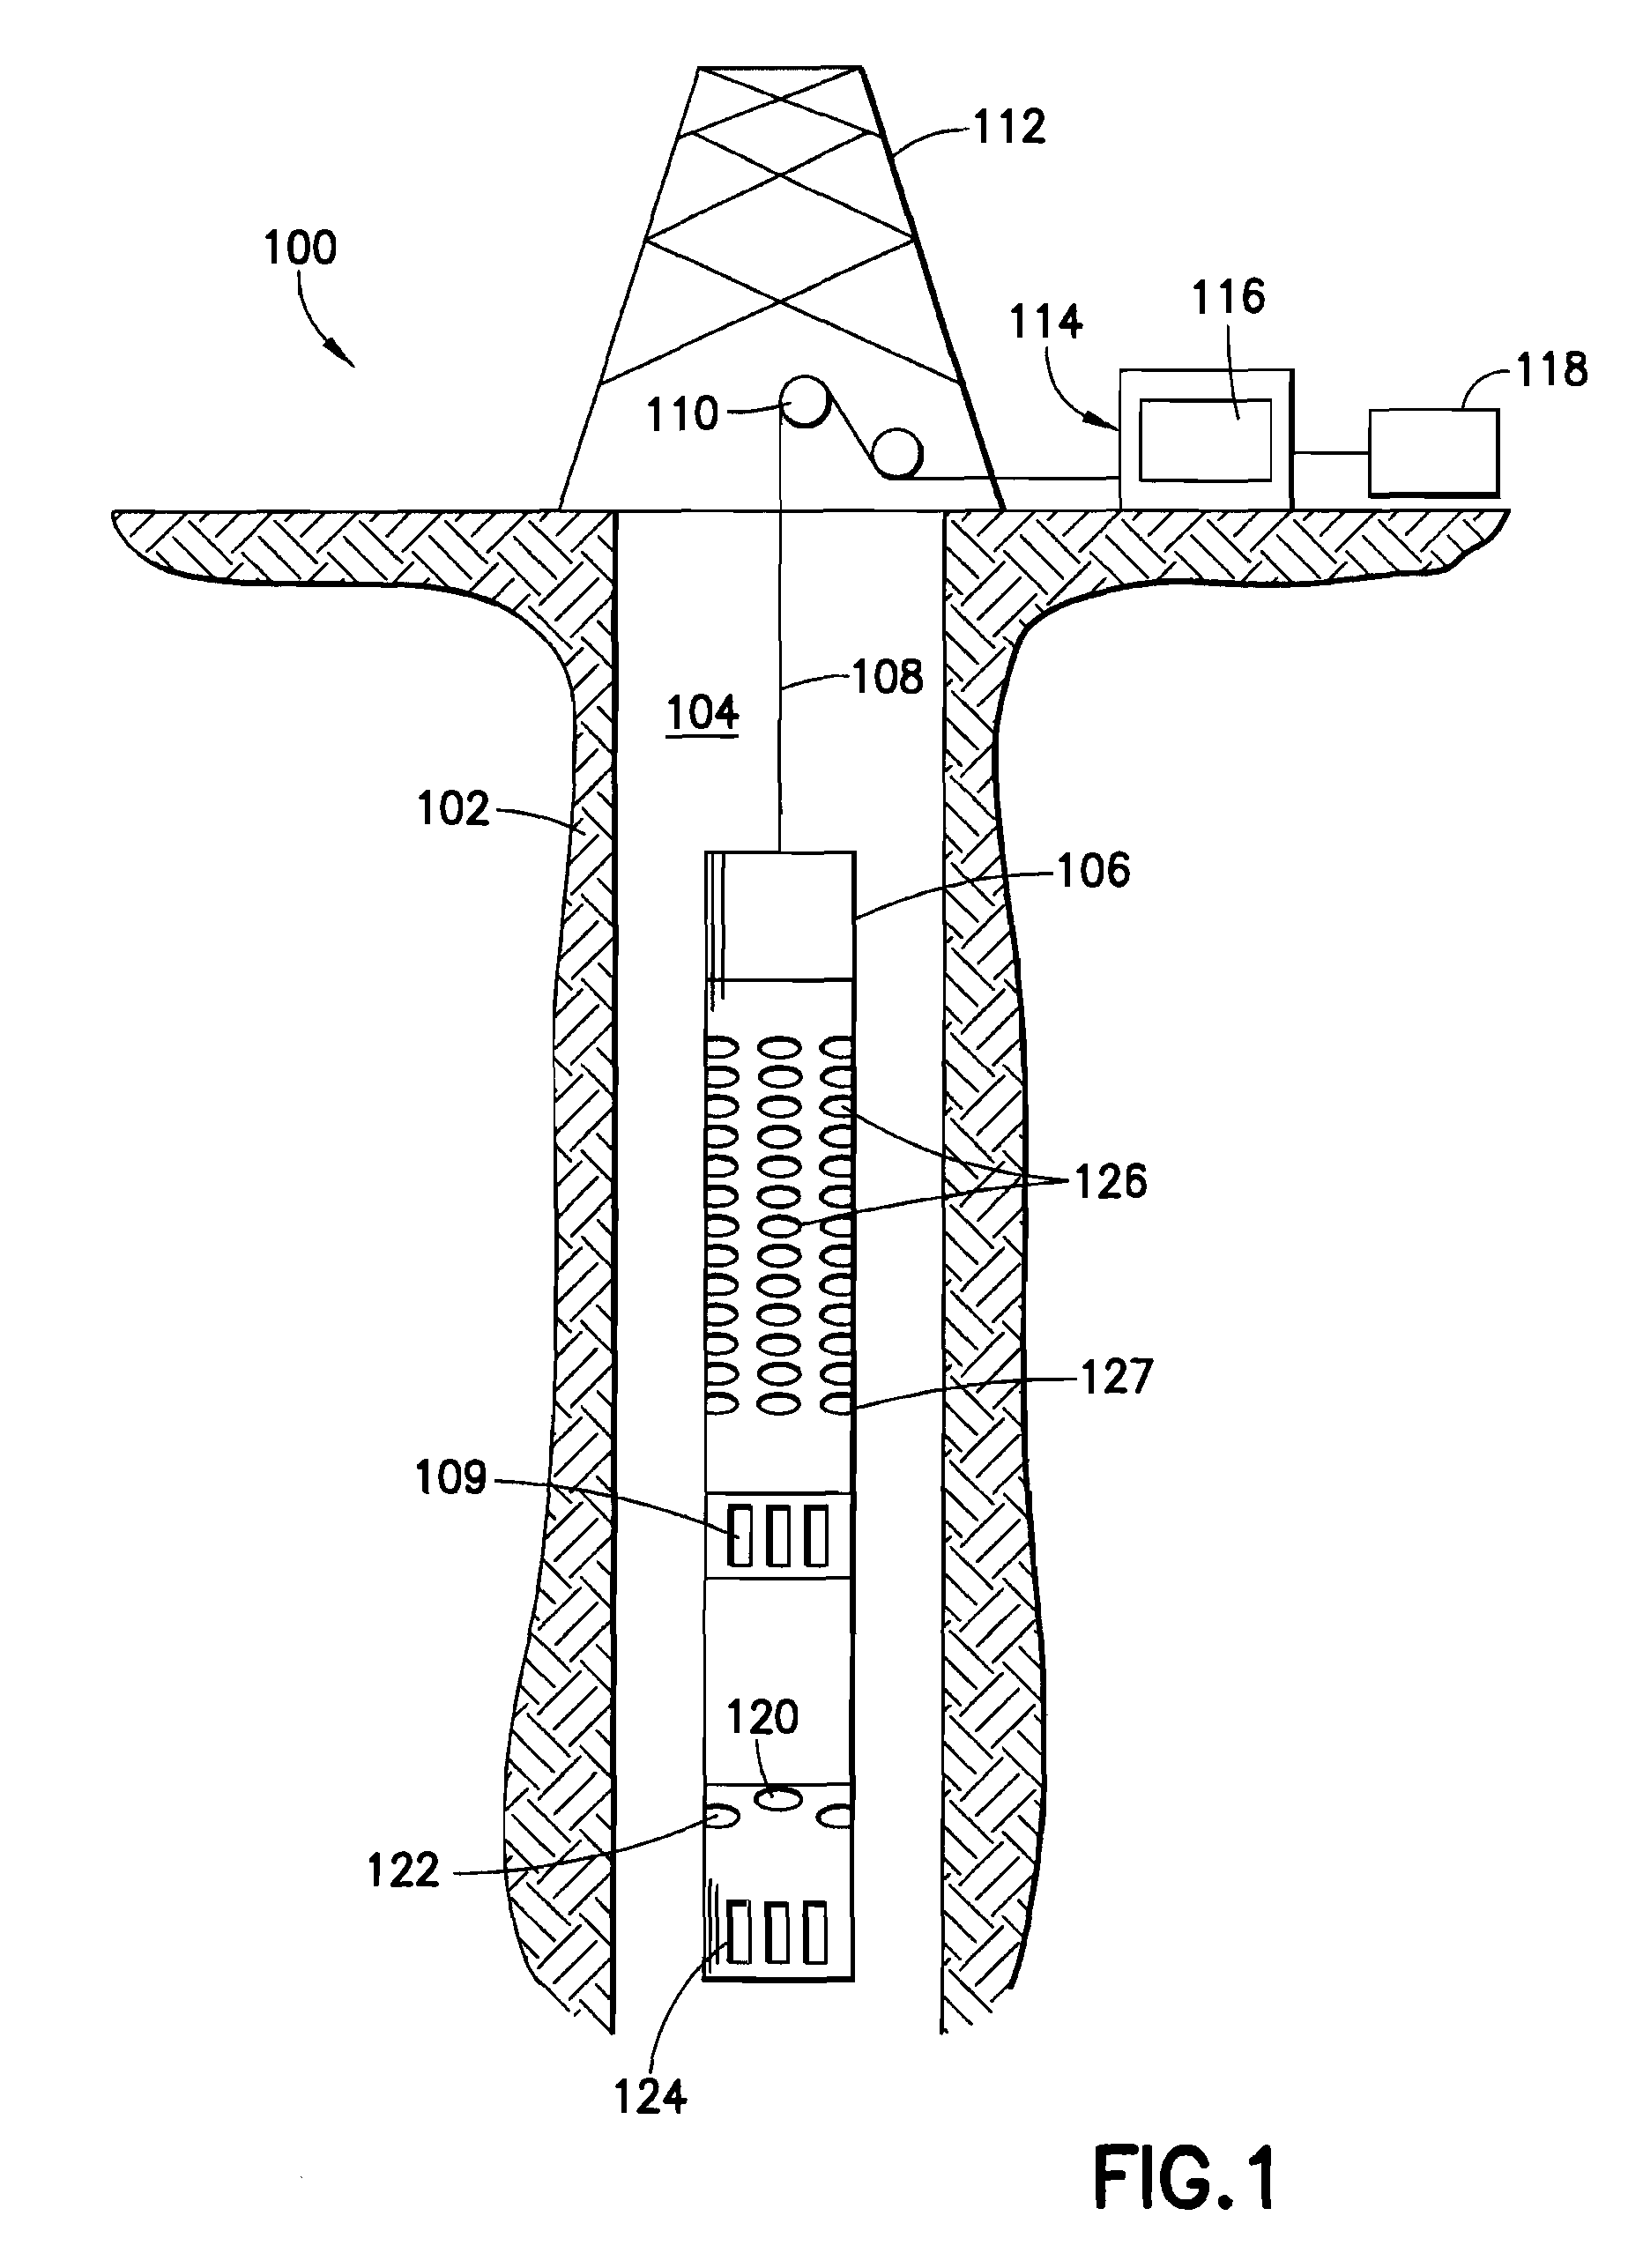
[0030]In accordance with the invention, dispersion curves are produced by an analyzer unit from acoustic data gathered by a borehole logging tool. Regardless of the embodiments illustrated, the logging tool may be of a wireline type, logging while drilling type, or any other type. Further the transmitter may be used to excite a dipole, monopole, quadrupole or any other multipole borehole acoustic mode. It should also be noted that seismic and borehole seismic data may be utilized, since both can contain dispersive arrivals. Each “sensor” includes a source (one or more transmitters) and a receiver (one or more associated hydrophones). For example, one transmitter and eight receivers constitute a set of eight sensors. Characteristic features of a sensor include the type of acoustic disturbance emitted by the source, and the distance (spacing) between the source and receiver.

[0031]FIG. 1 illustrates one example of a logging tool (106) used to acquire data from which dispersion curves w...


PUM


Abstract

This invention pertains to the extraction of the slowness dispersion characteristics of acoustic waves received by an array of two or more sensors by the application of a continuous wavelet transform on the received array waveforms (data). This produces a time-frequency map of the data for each sensor that facilitates the separation of the propagating components thereon. Two different methods are described to achieve the dispersion extraction by exploiting the time frequency localization of the propagating mode and the continuity of the dispersion curve as a function of frequency. The first method uses some features on the modulus map such as the peak to determine the time locus of the energy of each mode as a function of frequency. The second method uses a new modified Radon transform applied to the coefficients of the time frequency representation of the waveform traces received by the aforementioned sensors. Both methods are appropriate for automated extraction of the dispersion estimates from the data without the need for expert user input or supervision.

Description

FIELD OF THE INVENTION[0001]This invention is generally related to acoustic data analysis, and more particularly to processing acoustic waveforms where there is dispersion (frequency dependent wave velocity and attenuation), including but not limited to acoustic analysis of materials and subsurface formations.BACKGROUND OF THE INVENTION[0002]Dispersive processing of borehole acoustic data is useful for the characterization and estimation of rock properties using borehole acoustic data containing propagating modes. It is both more complex and more informative than non-dispersive processing, where bulk velocities in the rock are measured without any frequency dependence. Perhaps the most common parameters used to describe the dispersion characteristics are the wavenumber, k(f), and the attenuation, A(f), both of which are functions of the frequency f and are of interest in the oil industry for characterizing the properties of reservoirs. The dispersion characteristics include the grou...

Claims


Application Information

Patent Timeline
Patent Type & Authority Patents(United States)
IPC IPC(8): G01V1/00
CPCG01V1/48
Inventor BOSE, SANDIPVALERO, HENRI-PIERREAERON, SHUCHIN
Owner SCHLUMBERGER TECH CORP
Why Eureka
Try Eureka