Method and apparatus for quantum clustering

a multi-dimensional data and clustering technology, applied in relational databases, data processing applications, instruments, etc., can solve the problems of not trivial task of automated data grouping, low degree of automation, and inability to replicate, so as to reduce the dimensionality of the dataset and stable low-minimum of v

Active Publication Date: 2010-01-26
RAMOT AT TEL AVIV UNIV LTD
View PDF12 Cites 25 Cited by
  • Summary
  • Abstract
  • Description
  • Claims
  • Application Information

AI Technical Summary

Benefits of technology

[0132]An additional the advantage of the present invention is the ability to choose the eigenvalue, E, so as to set the scale on which local minima of the potential are observed. As further exemplified in the Examples section below, in cases in which E is relatively high, the density function spreads over a large region of the space covering more than one cluster center. Contrarily, the potential develops a larger number of local minima, thus allowing an identification of a correct number of cluster centers. Still another advantage of the present invention is that low minima of V are stable with respect to variation of the scale parameter.
[0133]Once the cluster centers have been located, cluster builder 20 attributes additional points to each cluster center, thereby builds a cluster near every cluster center. As further detailed hereinunder, unit 12 may considerably reduce the dimensionality of the dataset which is investigated.
[0134]Specifically, although rarely, a two-dimensional space may be spanned. In preferred embodiments of two-dimensional space, points are attributed to clusters by visual means. This may be done by more than one way. For example, it is convenient to construct a two dimensional contour plot, representing equipotential lines of the potential, and to identify local minima similarly to the way in which mountains and valleys are identified on a topographic map. Alternatively, local minima may be illustrated by constructing a three-dimensional plot of the potential over a planar image of the points of the space, and, again, attribute points which are within a predetermined distance from each local minimum. A third alternative is to transform potential values to predetermined colors and to illustrate local minima on a density plot where different regions of colors corresponds to different potential values. In any case, clusters of points are visually obtained from all the points which are within the basin of attraction of each local minimum.
[0135]The present invention successfully provides a well defined procedure for attributing points to cluster centers also for multidimensional space. Hence. according to a preferred embodiment of the present invention points may be attributed to cluster centers by a dynamically descending of points in a direction of a gradient of the potential, into the local minima. This procedure is also known as a gradient descent algorithm [R. O. Duda, P. E. Hart, and D. G. Stork “Pattern Classification”, Wiley, New York (2001), the contents of which are hereby incorporated by reference], which mathematically formulated in the following way.
[0136]Defining for the ith datum point a time-dependent dynamical process according to which, at each time interval, Δt, the point “falls” closer to the cluster center. The dynamical process is preferably in accordance with the equation:yi(t+Δt)=yi(t)−η(t)∇V(yi(t)),  (Eq. 4)where yi(t) represent the location of the ith point at time t, and η(t) is a descent rate which is selected in order not to miss a local minimum and skip to an adjacent one. yi(0) is selected to be the initial location of the point being descended.
[0137]Other method known in the art may also be used by cluster builder 20 so as to attribute points to cluster centers. For example, more sophisticated minimum search algorithms can be found in W. H. Press, S. A. Teuklosky, W. T. Vetterling and B. P. Flannery, “Numerical Recipes—The Art of Scientific Computing”, 2nd ed. Cambridge Univ. Press, 1992, the contents of which are hereby incorporated by reference.

Problems solved by technology

Certainly, this method is time-consuming, labor-intensive and not very reproducible.
Nevertheless, the diversity of different families often varies and families are not always exactly defined, hence the task of automated data grouping is not at all trivial.
Given a very large set of multi-dimensional data points, the data space is usually not uniformly occupied by the data points.
Instead, some regions in the space are sparse while others are crowded.
Indeed, when the dataset is very large and the dimensions are higher than two, visualizing the whole dataset in full dimensions is almost impossible.
However, hierarchical methods have a rather large complexity which grows as a cubic power of the total number of objects which are clustered.
Moreover, hierarchical methods are not suitable to all kinds of databases, as the basic feature of any hierarchical method is to impose a hierarchy on the data, while such property of the data may not exist at all.
An additional drawback of hierarchical methods is that once two objects are merged, these objects always belong to one cluster, and once two objects are separated, these objects are never re-grouped into the same cluster.
Thus, in hierarchical methods motion within the data space is limited.
Still another drawback of hierarchical methods is a tendency to cluster together individuals linked by a series of intermediates.
This property, generally known as chaining, often gives poor results in cases where noisy data points are present.
However, like in hierarchical methods, data may not conform to these assumptions and an incorrect structure of the data may be obtained.
Another difficulty, also encountered in hierarchical method, is the necessity to estimate an optimal number of clusters, before completing the analysis.
However, when clustering data using the K-means algorithm, the number of clusters must be determined a-priori, and sometimes affects the quality of the results.
The K-means algorithm intrinsically assumes spherical shape of all the clusters, which of course may not be correct.
Although several procedures have been employed to try and overcome the local minima problem, so far none guarantees finding the global minimum.
Hence, all the known clustering methods detailed above, suffer from one or more limitations which may commonly be attributed to assumptions and decisions which are made in advance; a predetermined structure of the data even though it may be erroneous; and a predetermined number of clusters, which may affect the quality of the results.

Method used


Image

  • Method and apparatus for quantum clustering
  • Method and apparatus for quantum clustering
  • Method and apparatus for quantum clustering

Examples


example 1

Crab Data

[0156]Crab data were taken from B. D. Ripley, “Pattern Recognition and Neural Networks”, Cambridge University Press, Cambridge UK, (1996). The set contains 200 samples divided equally into four classes of crabs: two species, male and female each. This data set is defined over a five-dimensional parameter space. When analyzed in terms of the second and third principal components of the correlation matrix one observes a nice separation of the 200 instances into their four classes.

[0157]The correlation matrix which was used was the autocorrelation matrix.

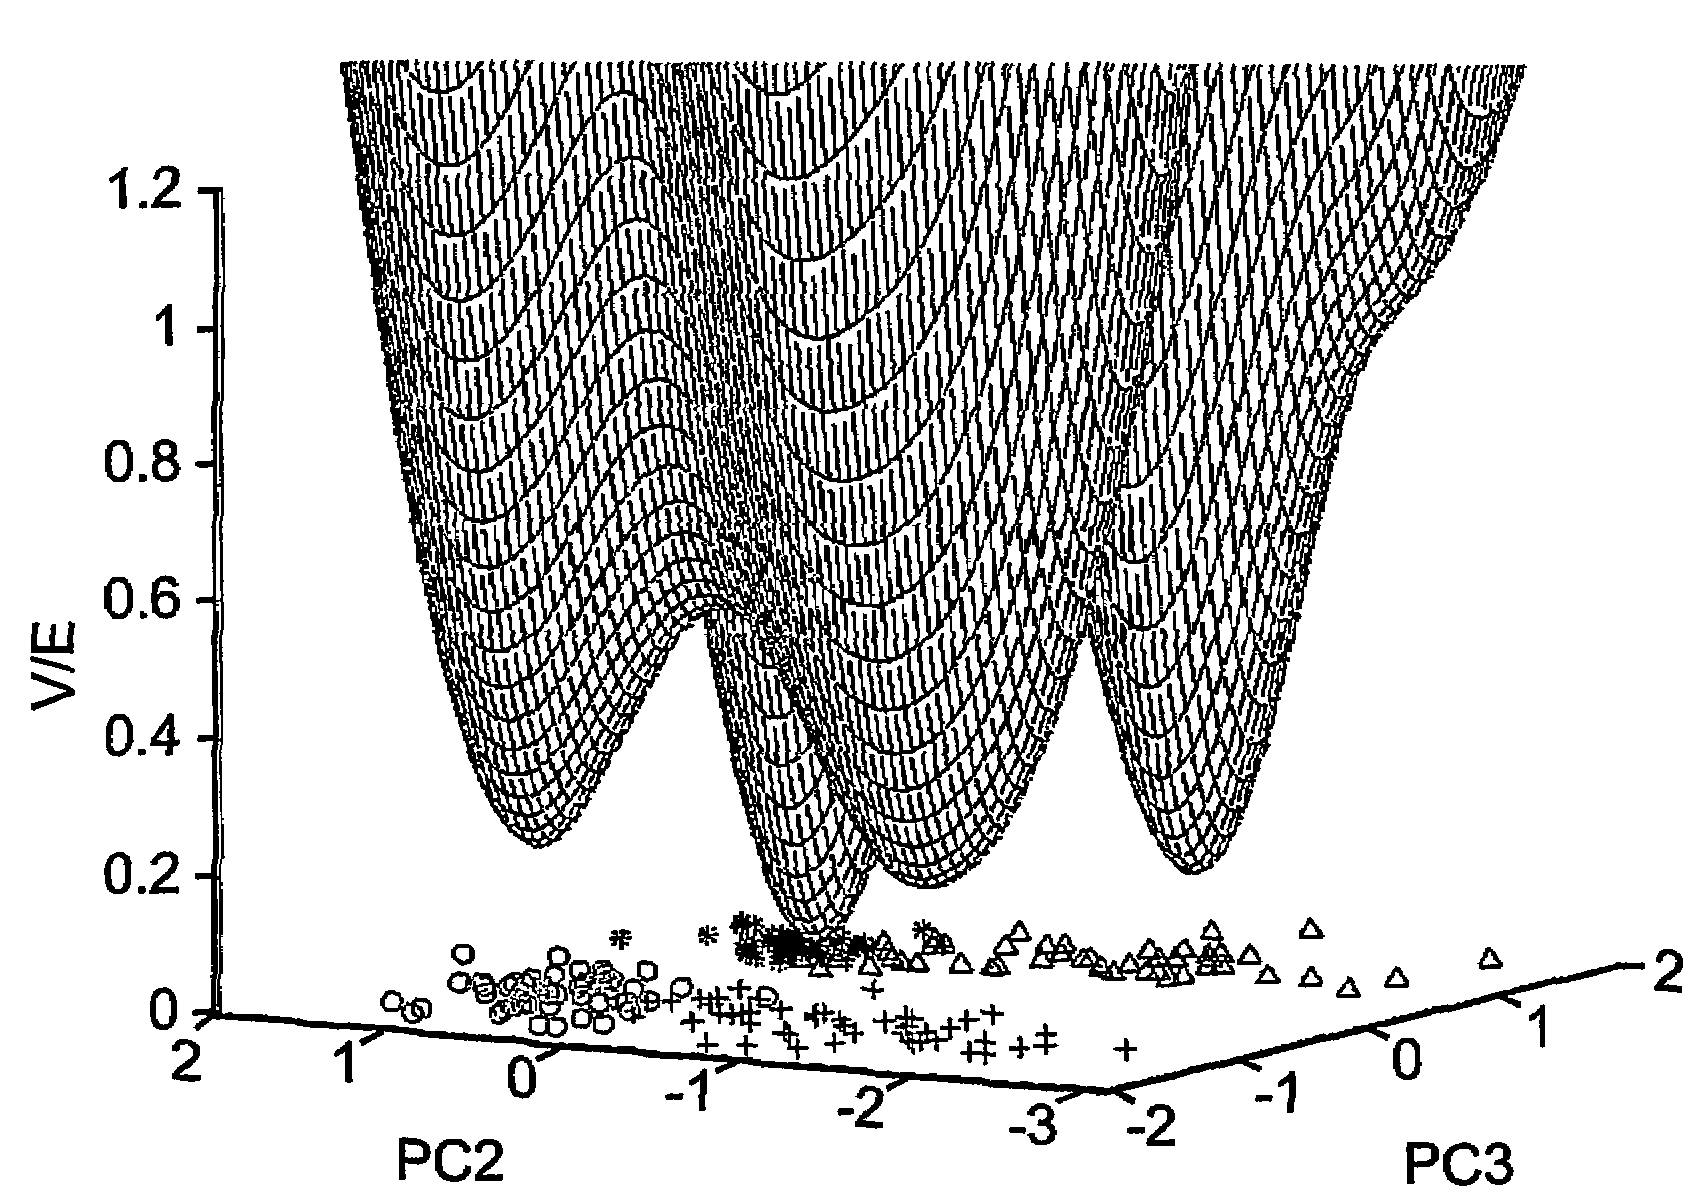
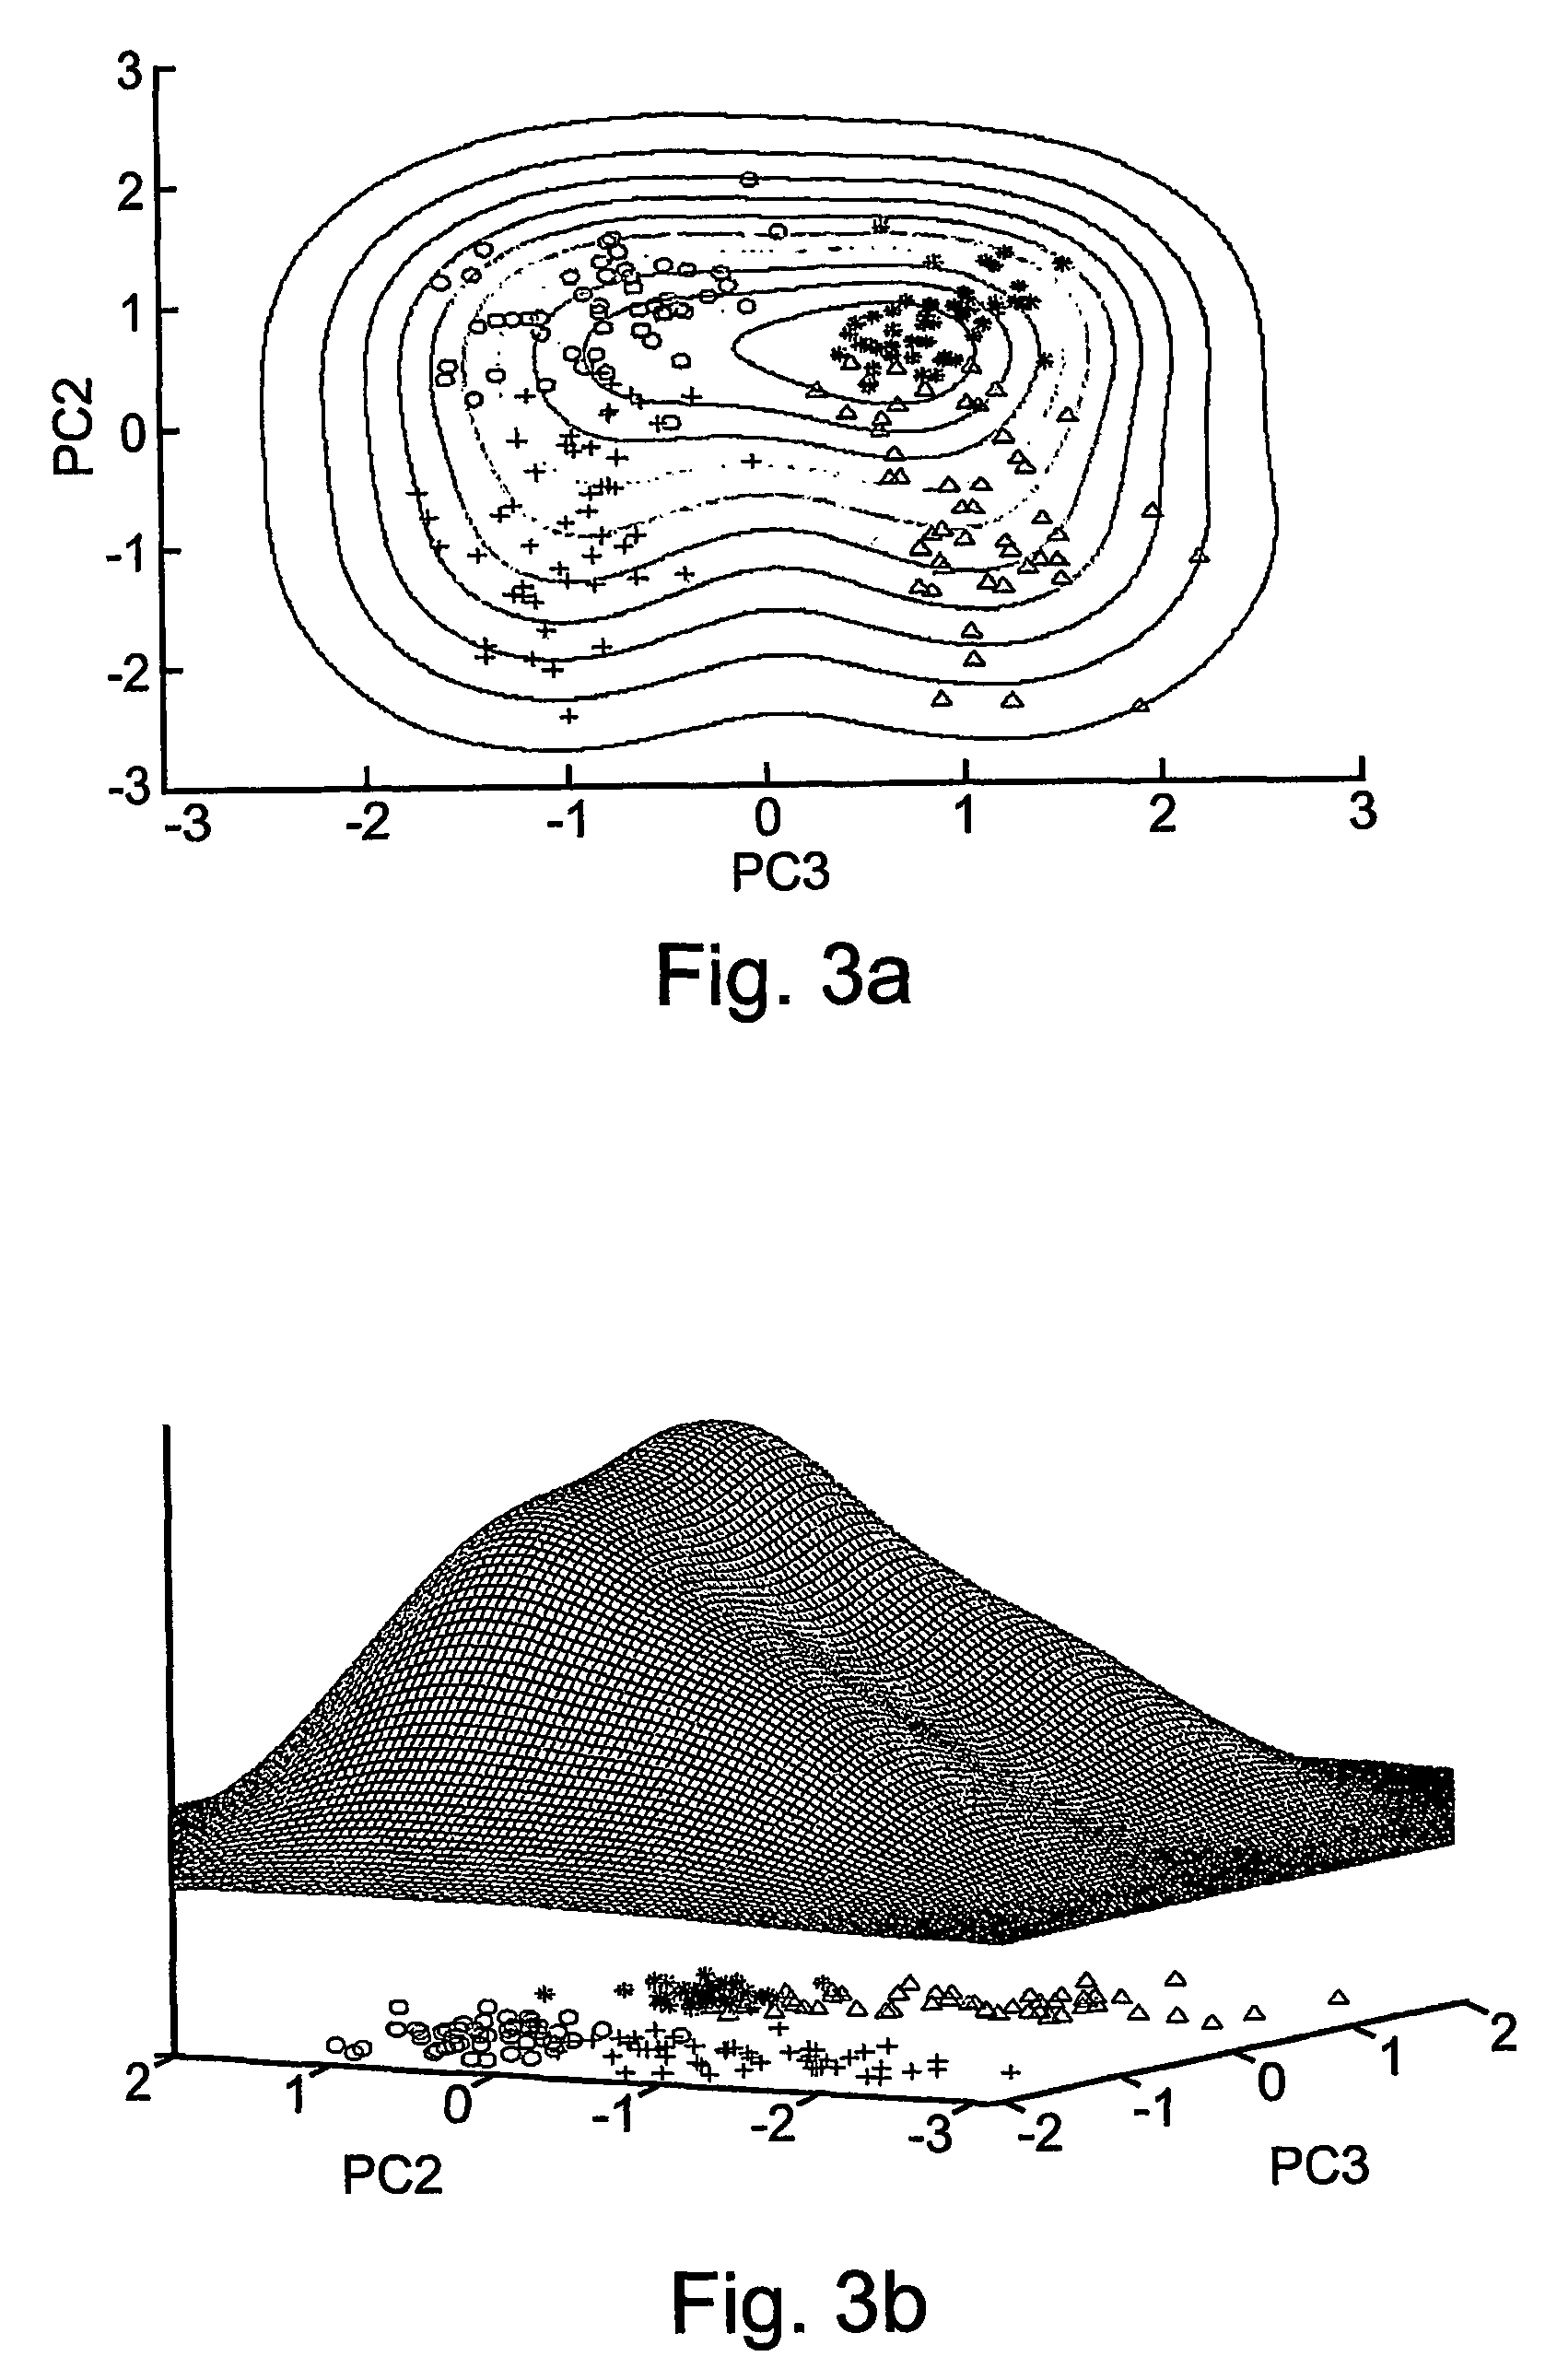
[0158]Reference is now made to FIGS. 3a-b, showing the second and third principal components of the data as well as a contour plot (FIG. 3a) and a three dimensional plot (FIG. 3b) of the density function, ψ, for width value of σ2=0.5. It is quite obvious that this width is not sufficiently small to deduce the correct clustering according to a conventional approach which uses maxima of the density function.

[0159]In FIGS. 4a-b, ...

example 2

Iris Data

[0164]The present invention was tested on an iris dataset of Fisher [R. A. Fisher, Annals of Eugenics, 7, 179 (1936)], obtained from C. L. Blake and C. J. Mer, “UCI Repository of machine learning databases” (1998). The data set contains 150 instances each composed of four measurements of an iris flower. There are three types of flowers, represented by 50 instances each. Clustering of these data in the space of the first two principal components, using σ=0.25, has an amazing result of only four misclassifications.

[0165]The correlation matrix which was used was the autocorrelation matrix.

[0166]Reference is now made to FIG. 10, showing a contour plot of the potential for the iris data. The three minima are denoted by crossed circles and interpreted as cluster centers. The contours are set at values of V / E=0.2, 0.4, 0.6, 0.8 and 1.

[0167]Reference is now made to FIGS. 11a-d, showing the progress of the gradient descent dynamics for the iris data set on principal components 1 and...

example 3

Wine Recognition Data

[0170]The present invention was tested on a wine recognition dataset obtained from C. L. Blake and C. J. Mer, “UCI Repository of machine learning databases” (1998). The dataset represents 13 different chemical constituents of 178 wines manufactured from grapes grown in the same region in Italy but derived from three different cultivars.

[0171]Due to the wide variation between the mean of the features, an additional linear normalization was performed on the dataset. The correlation matrix which was used was the covariance matrix.

[0172]Reference is now made to FIG. 14, showing the first and second principal components of the data as well as a contour plot of the potential, for width value of σ=0.6. The contours are set at values of V / E=0.2, 0.4, 0.6, 0.8 and 1. Beside six misclassifications, originally from the second cluster, the fit of the potential to the data is quite remarkable.

[0173]In FIGS. 15a-d, the number of minima of V is compared to the number of maxima...


PUM


Abstract

A method of determining clusters of data within a dataset, the dataset is represented by a plurality of multidimensional data entries, the method comprises (a) spanning a space, represented by a plurality of points; (b) determining a density function over the space;(c) associating a potential to the density function; (d) locating a plurality of local minima of the potential; and (e) for each of the plurality of local minima, attributing at least one of the points; thereby determining clusters of data within the dataset.

Description

RELATED PATENT APPLICATION[0001]This application is a National Phase Application of PCT / IL02 / 00374International Filing Date 14 May 2002, which claims priority from U.S. Provisional Patent Application No. 60 / 290,385 filed 14 May 2001.FIELD AND BACKGROUND OF THE INVENTION[0002]The present invention relates to a method and apparatus for clustering multidimensional data and, more particularly, to a method and apparatus for clustering multidimensional data incorporating quantum mechanical techniques.[0003]There is a growing emphasis on exploratory analysis of large datasets to discover useful patterns. Organizations are investing heavily in “data warehousing” to collect data in a form suitable for extensive analysis, and there has been extensive research on clustering.[0004]Informatics is the study and application of computer and statistical techniques for the management of information.[0005]Bioinformatics includes the development of methods to search biological databases fast and effici...

Claims


Application Information

Patent Timeline
Patent Type & Authority Patents(United States)
IPC IPC(8): G06F17/30G06F17/00G06K9/62
CPCG06F17/30595G06F17/30707G06K9/6218G06F16/353G06F16/284G06F18/23Y10S707/99943
Inventor HORN, DAVIDGOTTLIEB, ASSAFAXEL, INON
Owner RAMOT AT TEL AVIV UNIV LTD
Why Eureka
Try Eureka