
Method for robust analysis of biological activity in microscopy images

a biological activity and microscopy image technology, applied in the direction of material analysis, material testing goods, instruments, etc., can solve the problems of high content measurement confounded, false positives and false negatives, error in assays, etc., to improve measurement repeatability, reduce measurement variations, and high detection sensitivity

Active Publication Date: 2010-04-13
LEICA MICROSYSTEMS CMS GMBH
View PDF11 Cites 5 Cited by
  • Summary
  • Abstract
  • Description
  • Claims
  • Application Information

AI Technical Summary

Benefits of technology

The patent describes a method for analyzing biological activity by segmenting objects in images and measuring their features. The method is robust against variations in image quality and can detect and measure the activity of individual cells. The results can be used to study the behavior of cells in response to different treatments or to analyze the activity of whole organs. The method can also be used to compare different samples and to extract important features from images. Overall, the method provides a reliable and accurate way to analyze biological activity and can help to advance the field of biological research.

Problems solved by technology

Recently, high content analysis has become vital to cell culture automation, which has been identified as a critical bottleneck in both high content and high throughput screening.
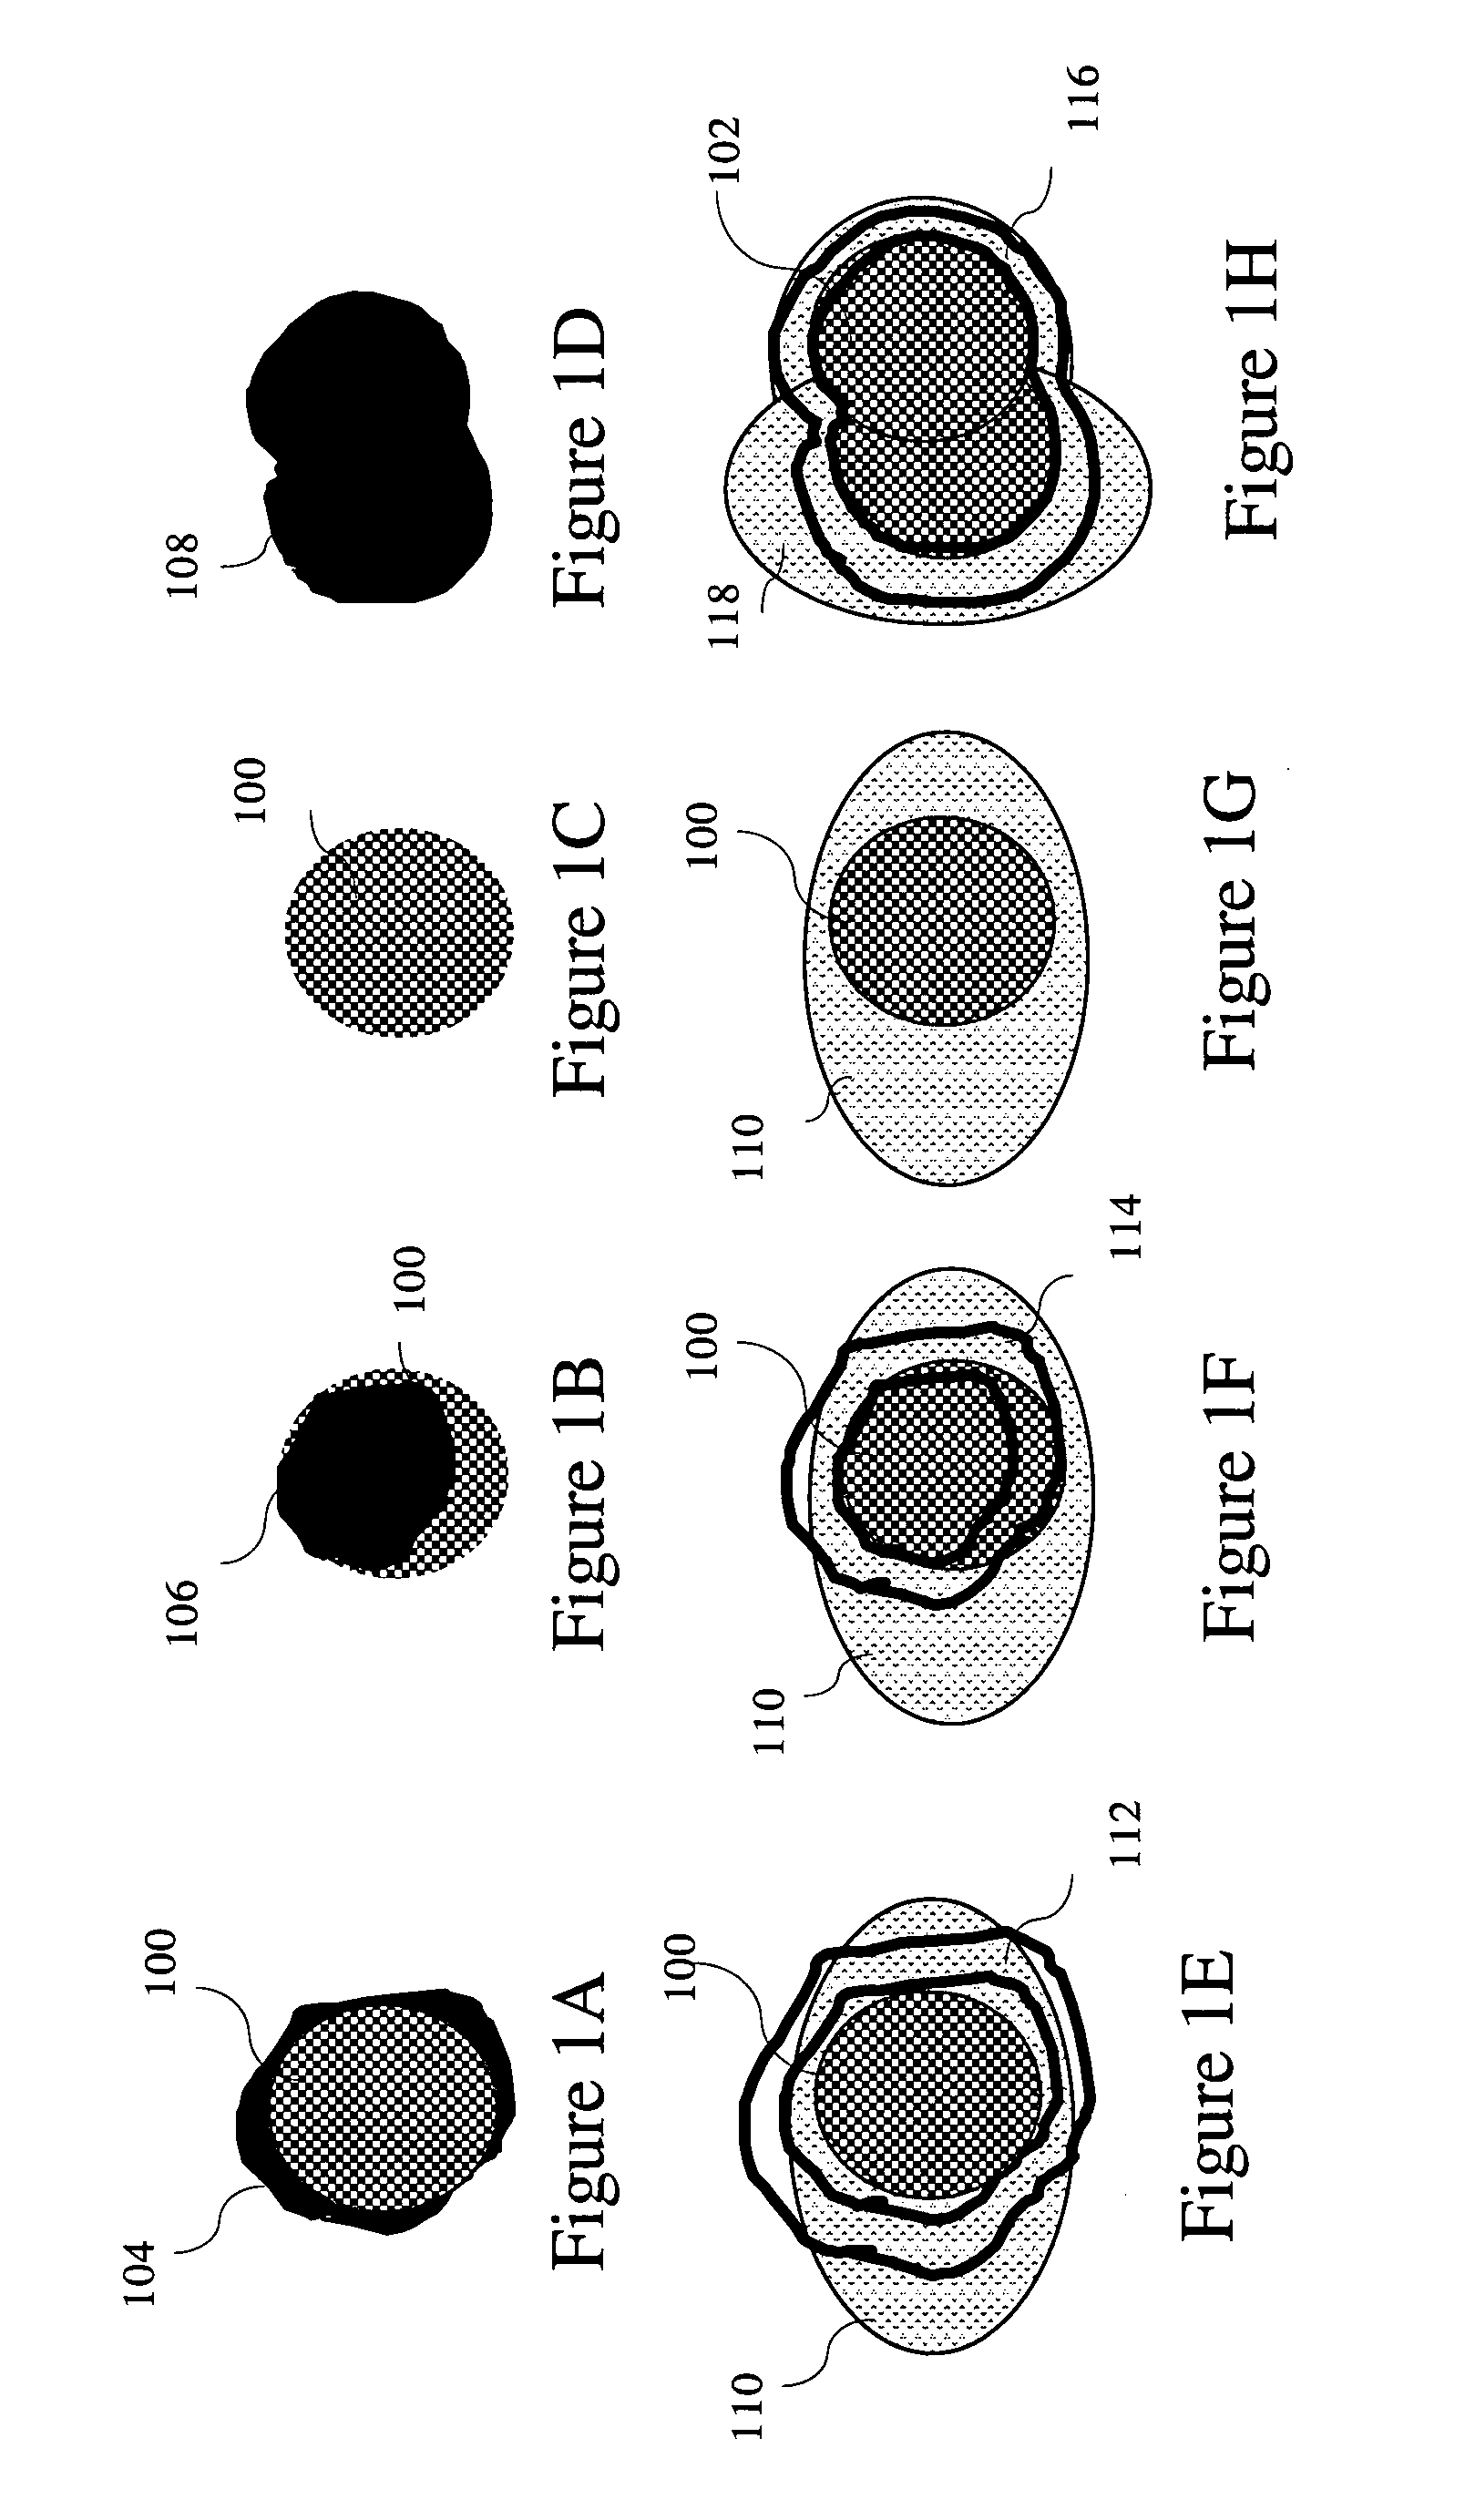
Furthermore, high content measurements can be confounded by compound related artifacts that can cause false positives and false negatives; such as fluorescent compounds, toxic compounds and rare morphological changes that affect the biological signal on which the assay is based.
Binary mask based high content measurements introduce error into the assay at an early stage, in addition to instrument error such as focusing errors and variation in illumination.
This error is again accumulated and undermines derived measurements such as the standard deviation of intensity, the ratio of cytoplasmic to nuclear intensity, etc.
Similar error is accumulated in time lapse images when objects are not perfectly aligned from frame to frame.
These fundamental errors in object segmentation and measurement are propagated throughout the assay's statistics resulting in higher assay variability and reduced signal dynamic range.

Method used


Image

  • Method for robust analysis of biological activity in microscopy images
  • Method for robust analysis of biological activity in microscopy images
  • Method for robust analysis of biological activity in microscopy images

Examples


Embodiment Construction

I. Application Scenario

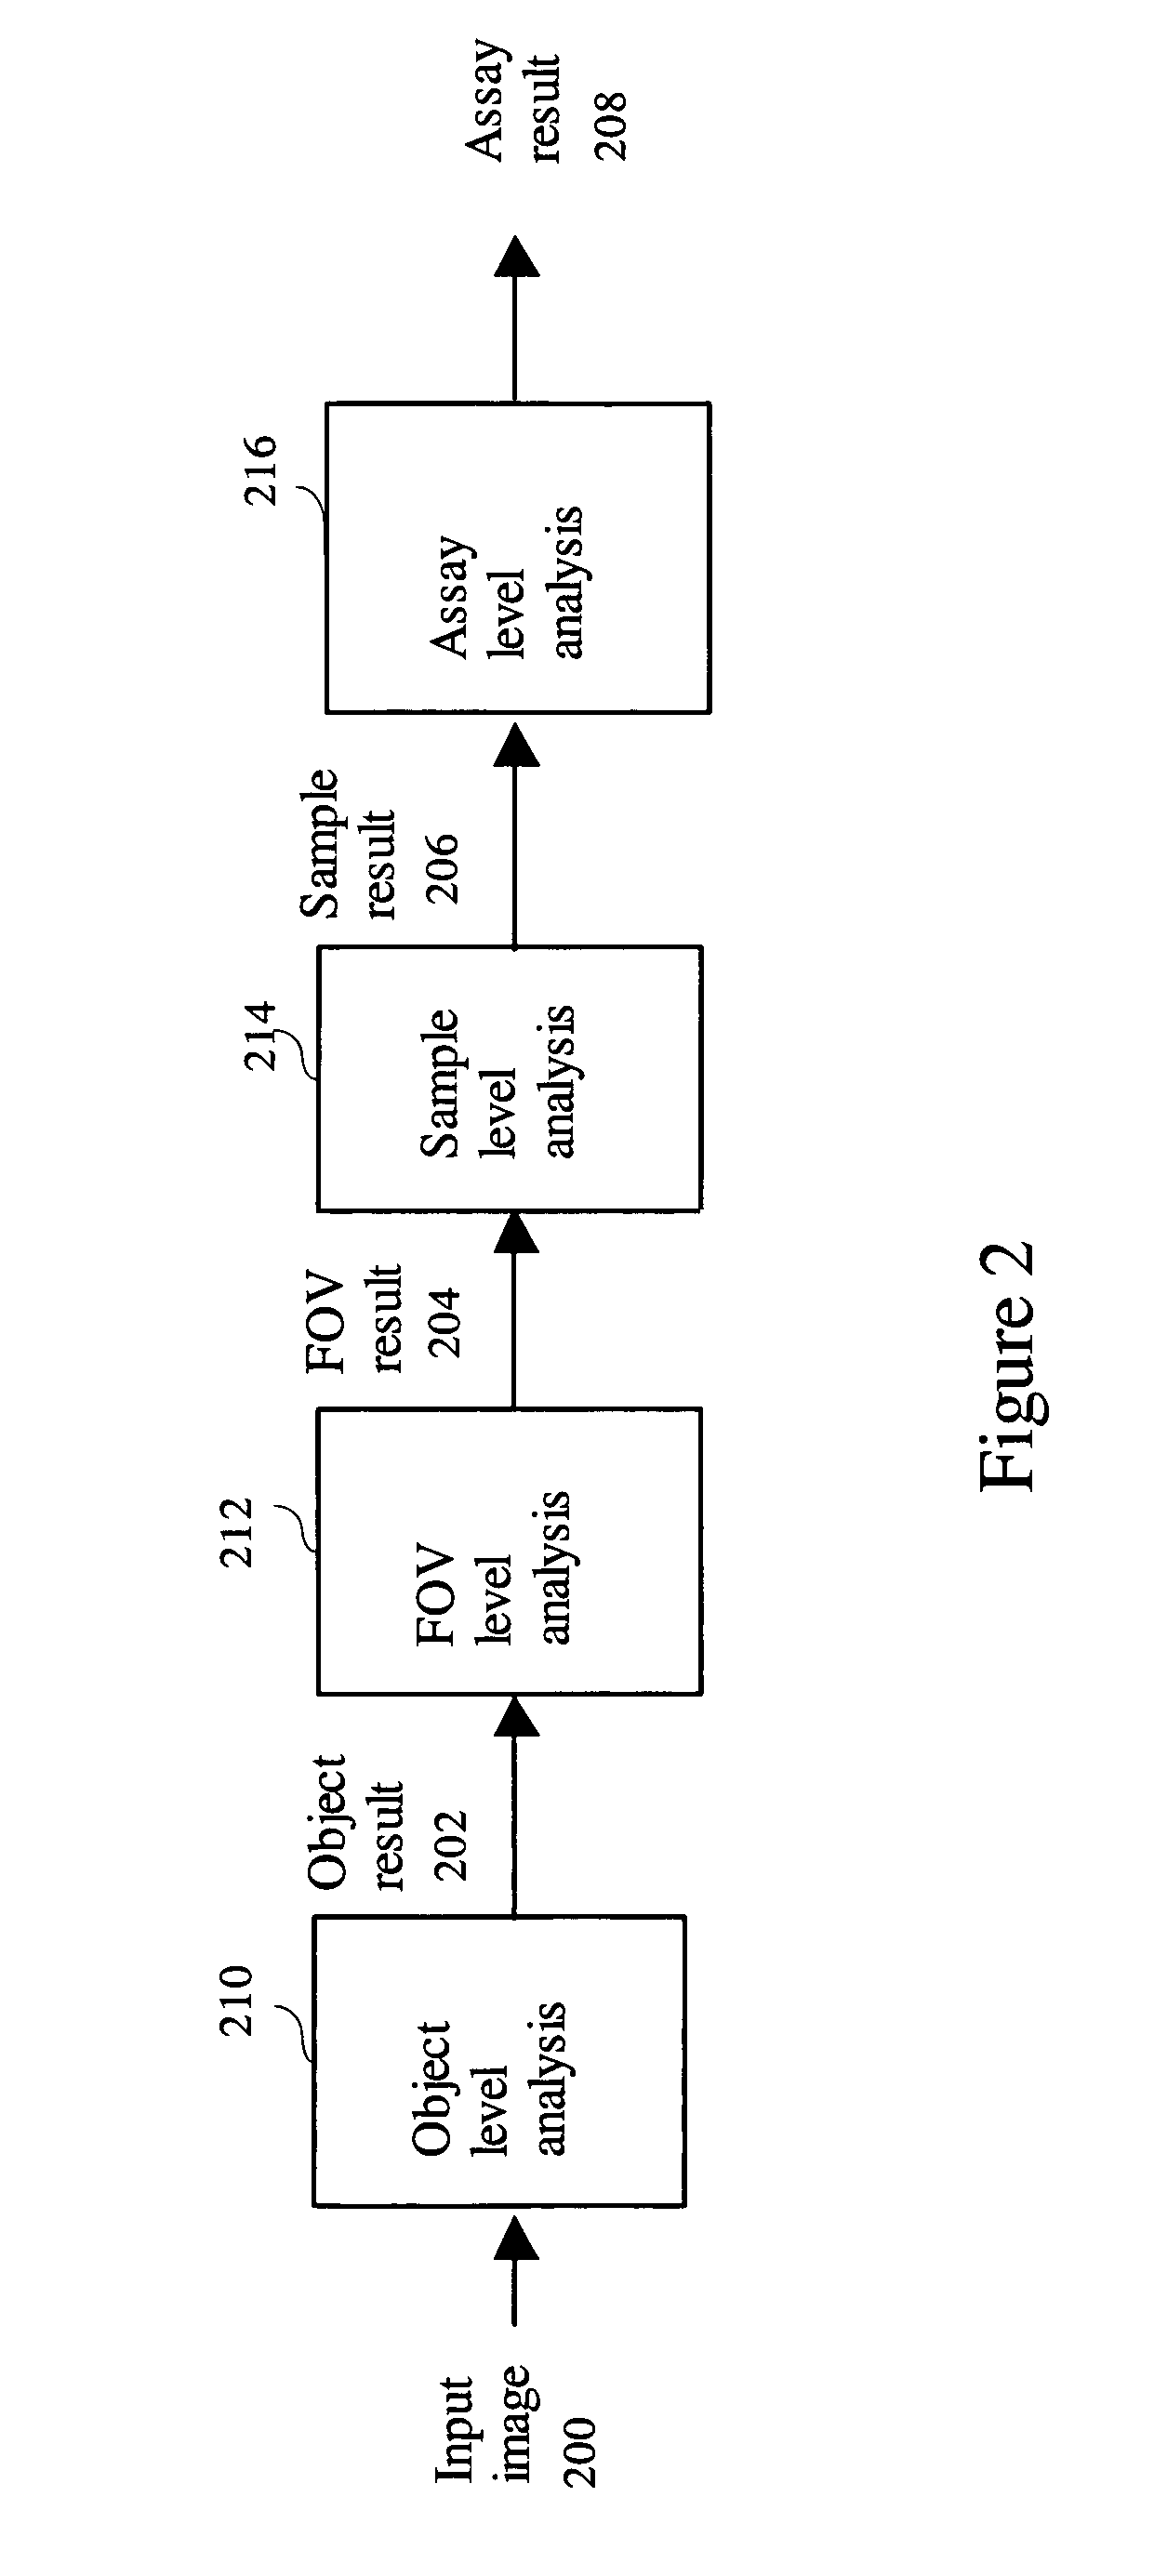
[0057]The robust method can be applied at different levels of cellular analysis to achieve high detection sensitivity with high specificity, reproducibility, and accuracy. FIG. 2 shows multiple processing levels for a cellular analysis assay. A cellular analysis assay consists of at least one or a plurality of processing levels 210, 212, 214, 216. As shown in FIG. 2, at least one input image 200 is processed by an object level analysis step 210. The input image 200 could contain more than one channels such as images of different spectrum, florescence stained image, nucleus stained image, phase contrast image, Difference Interference Contrast (DIC) image, images of different focal planes, or time lapse images containing different temporal sampling of the objects of interest, etc. The object level analysis step 210 detects, segments, and measures the objects of interest to create the object result 202. An object could be a tissue section, a cell, a nucleus, a su...


PUM

PropertyMeasurementUnit
thresholdaaaaaaaaaa
microscopyaaaaaaaaaa
volumeaaaaaaaaaa

Abstract

An object analysis method performs object segmentation to generate segmentation confidence map and uses the segmentation results to generate robust object features. The robust object features are combined to create robust FOV summary features, robust sample summary features and robust assay summary features.

Description

TECHNICAL FIELD[0001]This invention relates to methods for the automated or semi-automatic analysis of biological activity in microscopy images from life sciences applications that can consistently achieve high detection sensitivity with high specificity, reproducibility and accuracy.BACKGROUND OF THE INVENTION[0002]High content, quantitative analysis of microscopy images is an increasingly important tool for applications in drug discovery, basic research and medical diagnosis. We define image based, high content analysis to mean the measurement of multiple image parameters per cell or subcellular compartment or objects, across multiple cells in an image, or across multiple images. This could be done automatically in a high volume and high throughput manner or in a research setting that involves few cells or images in a semi-automatic fashion. High content analysis of these assays has only become practical in drug discovery and medical diagnosis in recent years, and is currently bei...

Claims


Application Information

Patent Timeline
Patent Type & Authority Patents(United States)
IPC IPC(8): G06K9/00G01N33/53G06K9/34G06K9/46G06K9/62G06K9/66
CPCG06K9/00127G06V20/69
Inventor LEE, SHIH-JONG J.ALWORTH, SAMUEL
Owner LEICA MICROSYSTEMS CMS GMBH
Learn More