
Dependability measurement schema for communication networks

Active Publication Date: 2010-06-08
CIENA
View PDF3 Cites 105 Cited by
  • Summary
  • Abstract
  • Description
  • Claims
  • Application Information

AI Technical Summary

Benefits of technology

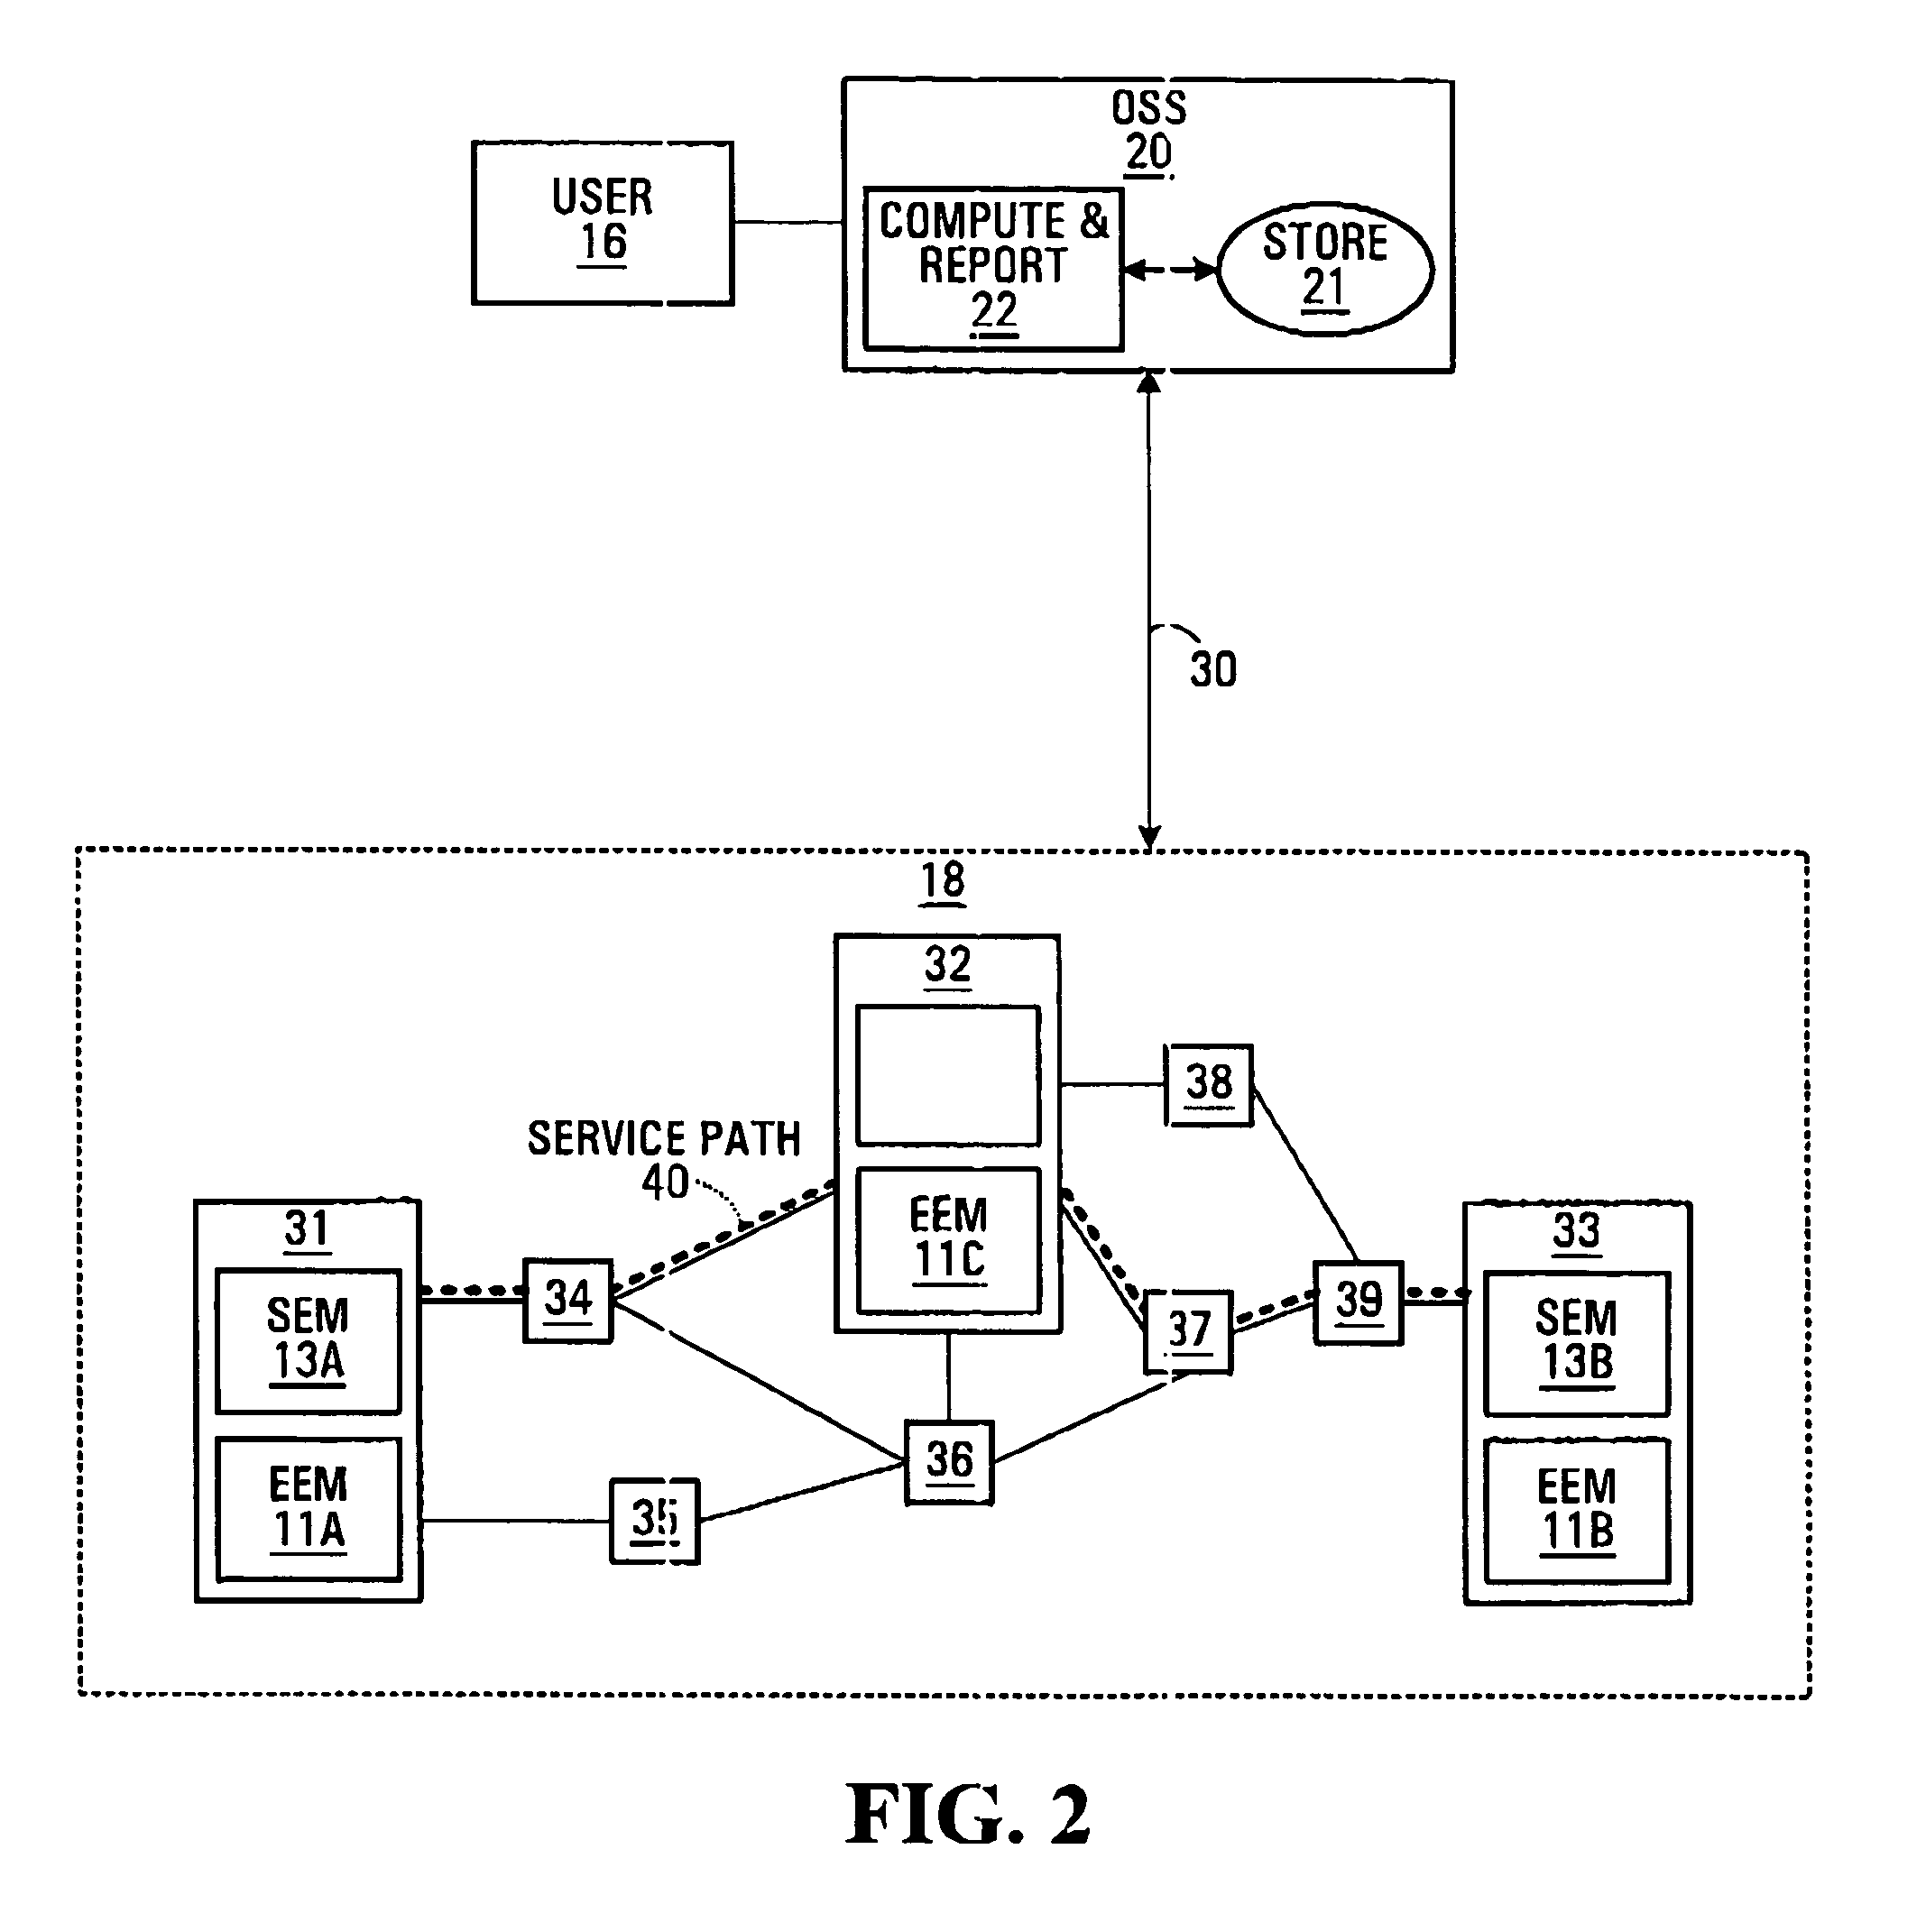
[0010]Two methodologies are used in combination to implement an autonomous schema to report dependability information. In a first methodology, transmission quality performance parameters are measured along a service path. The service path can be a link between two network elements or across a single network element. The transmission performance results are compared to threshold criteria to determine if the event is a service failure. Time data is also collected. The results are analyzed to determine inter-network element dependability parameter information. In a second methodology, network elements are monitored for an occurrence of a network element alarm indicating a network element event, such as a network element failure. Intra-network element dependability parameter information such as event start time, event end time, event duration, repair duration, etc. is collected when the network element alarm is detected. Correlating the inter-network element dependability parameter information and the intra-network element dependability parameter information allows for determination of a location of a network event and an impact that the network event has on service.
[0012]Measuring dependability parameters and dependability metrics in this manner allow a system provider or solution vendor to initiate corrective and preventative action by having a better understanding of typical network events and their causes.
[0013]An automated dependability measurement feature of this type being permanently embedded in the communications network provides the advantage of being able to measure meaningful dependability parameters and metrics without impacting the end-user. The automated dependability measurement schema also eliminates the tedious process of attempting to analyze and correlate dependability data in a conventional manual fashion where the results may or may not reflect actual dependability SLAs.

Problems solved by technology

Currently, dependability Service Level Agreements (SLAs) existing between service providers and service customers and between service providers and solution vendors are ambiguous, vague and difficult to measure.
However, whether an end-user experiences a network event is not always important in determining how the network event is classified.
A service failure for PSTN telephony is when a subscriber experiences dial tone delay greater than 5 seconds or ring back delay greater than 9 seconds when trying to access the service and greater than 5 second delay (or the subscriber being disconnected and having to re-dial) when in a talk state.
However, if the impairment lasted long enough such that after three attempts (when the typical subscriber abandons the call attempt), the subscriber would consider that the service is unavailable.
However, this is not sufficient to provide meaningful SLAs since the information does not reflect the impact from the service customers' perspective.
This requires a significant amount of manual effort and usually only considers network element failure modes, though a considerable contributor to end-to-end service dependability issue may be network failures, such as cable cuts.

Method used


Image

  • Dependability measurement schema for communication networks
  • Dependability measurement schema for communication networks
  • Dependability measurement schema for communication networks

Examples


Embodiment Construction

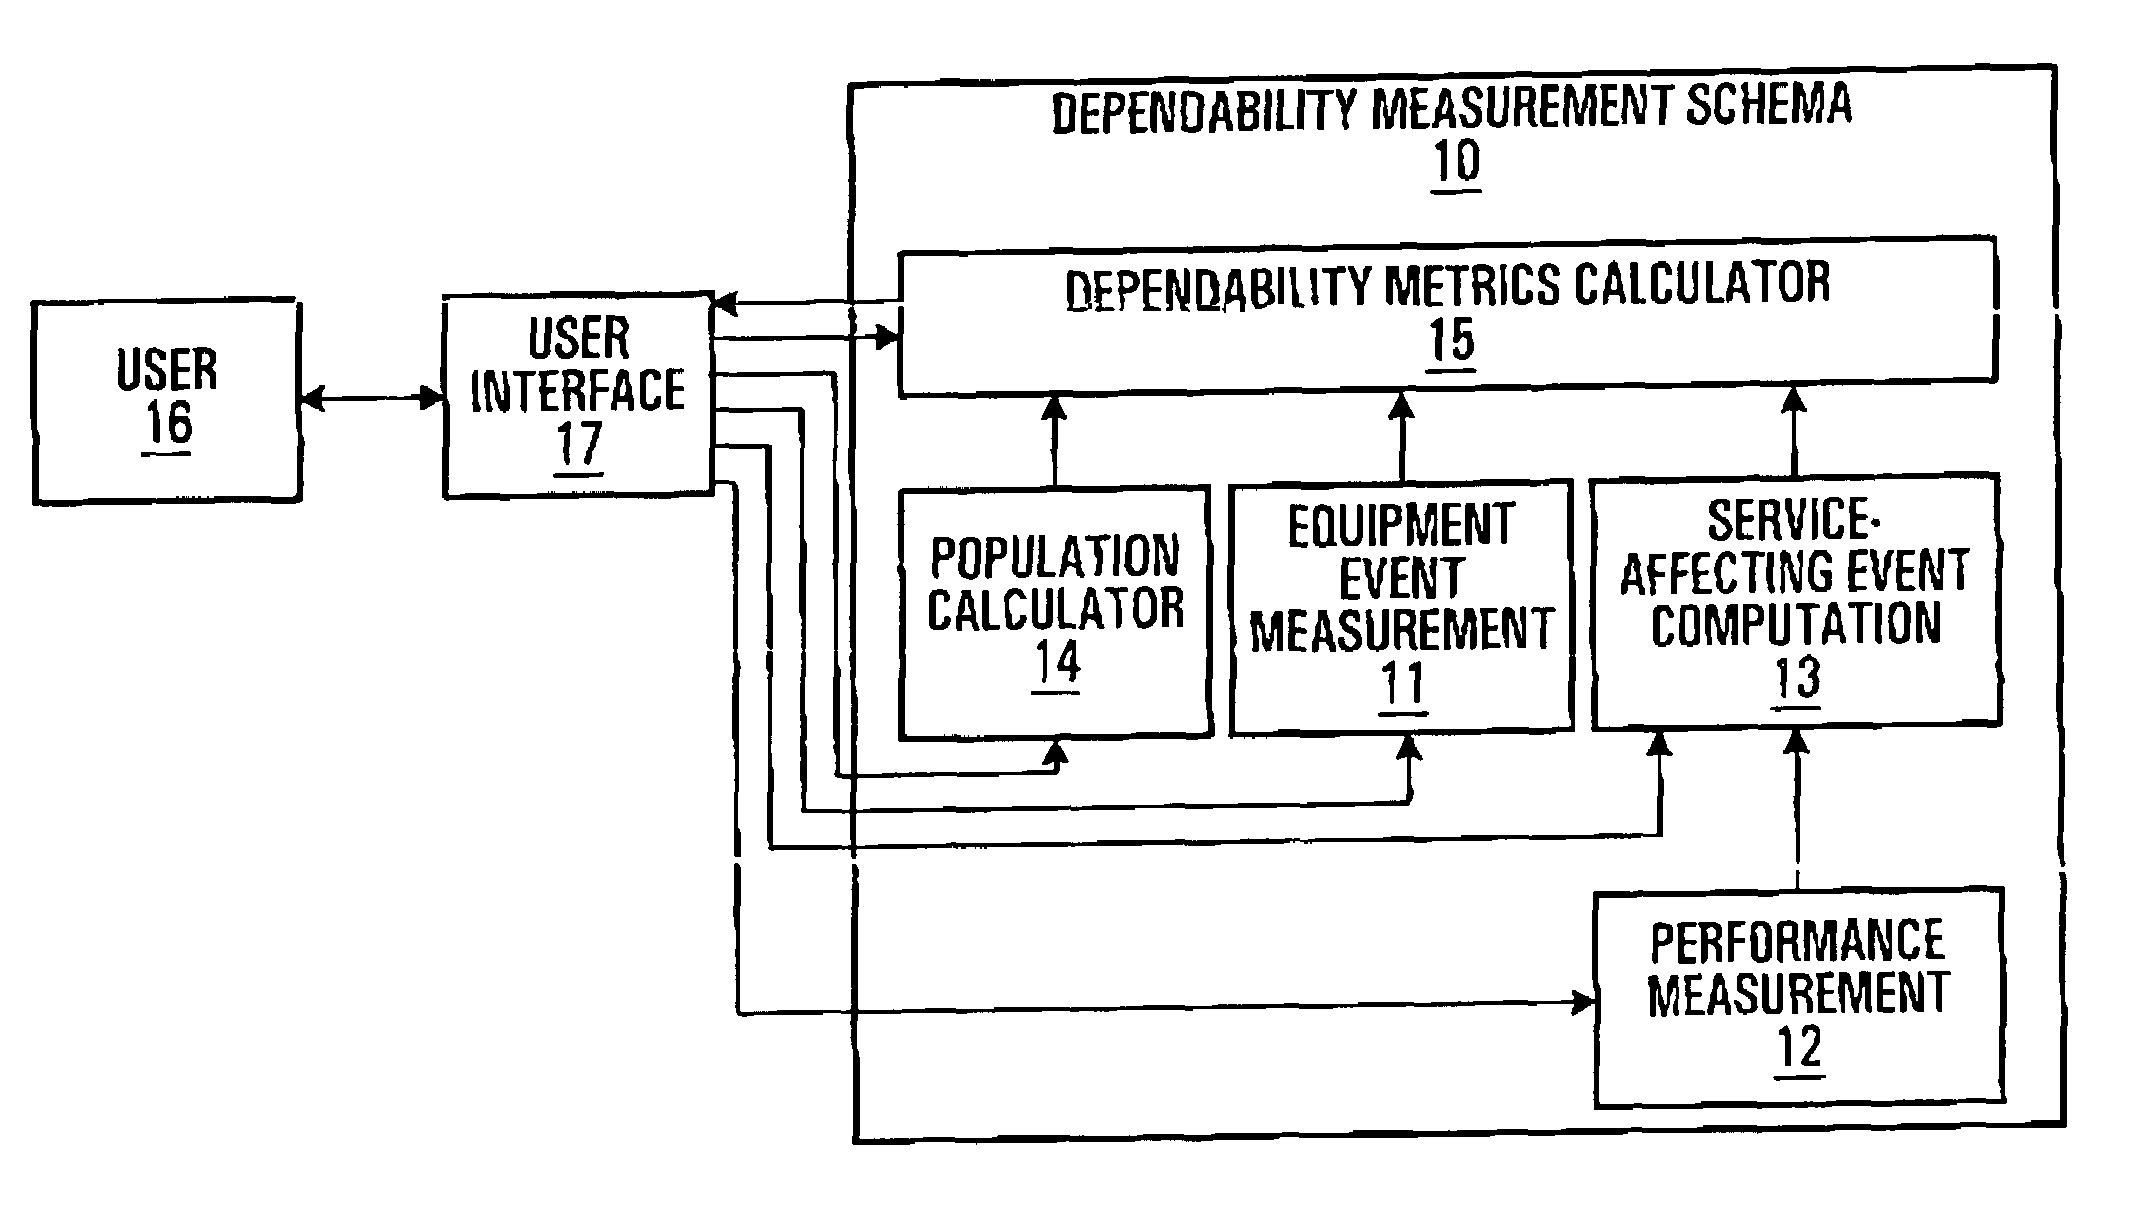
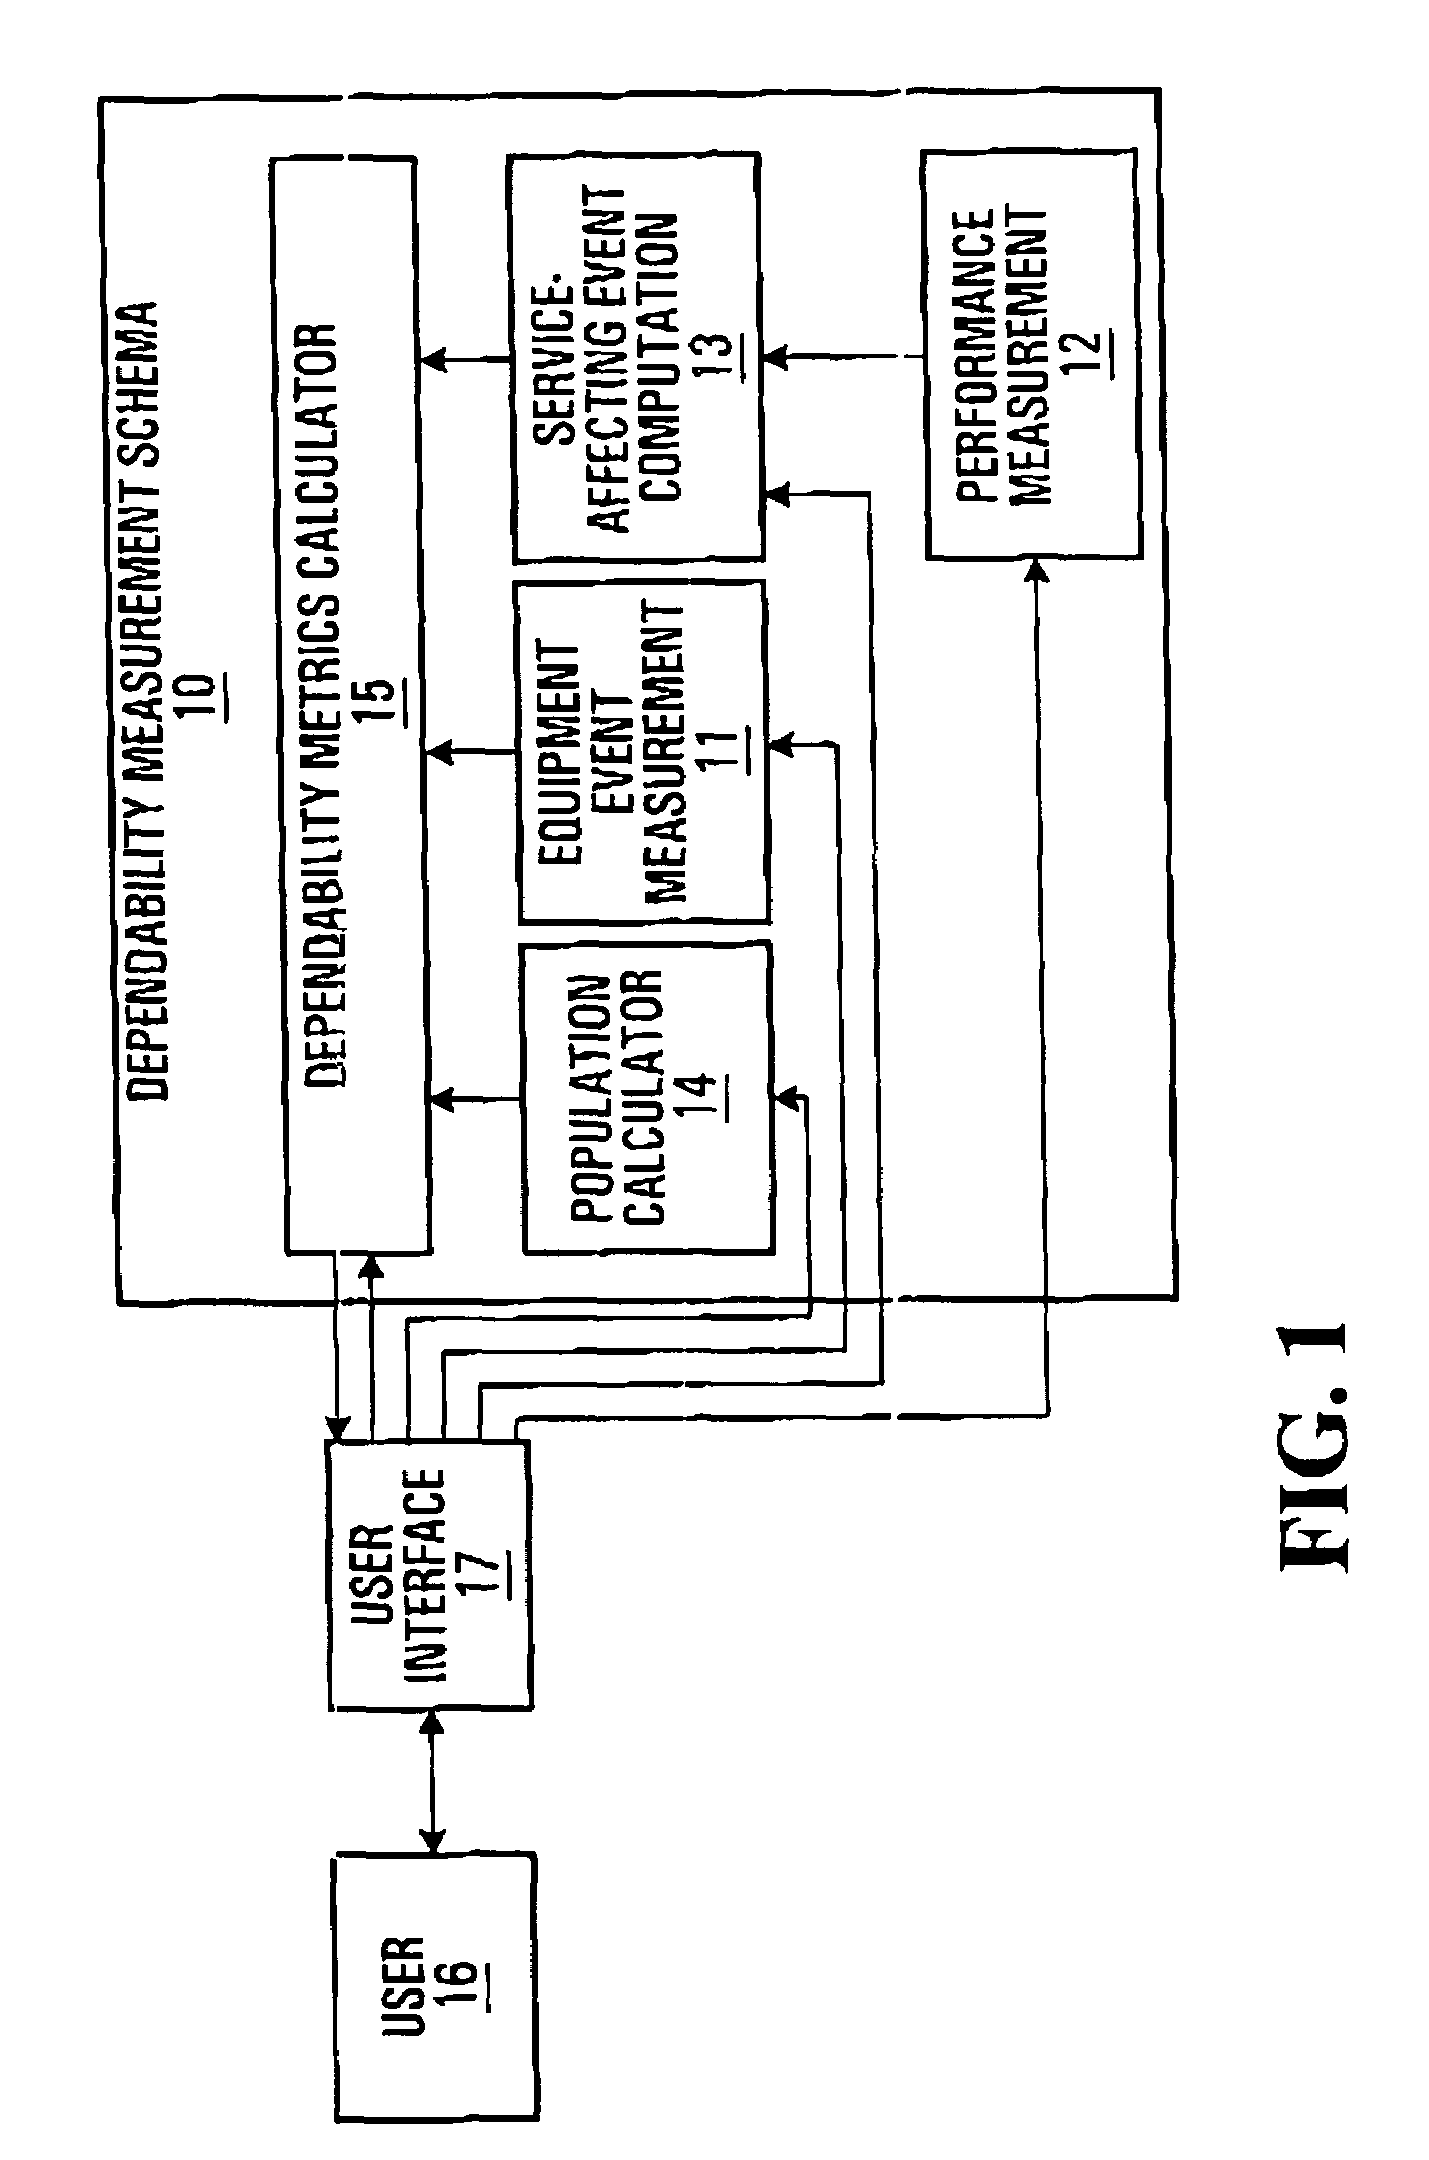
[0021]FIG. 1 is a schematic diagram of an architecture that comprises a dependability measurement schema (DMS) 10. The DMS 10 is comprised of five processes: an equipment event measurement (EEM) function 11, a performance measurement function 12, a service-affecting event computation (SEC) function 13, a population calculator 14 and a dependability metrics calculator 15. An output of the performance measurement function 12 supplies an input to the SEC function 13. Outputs from the SEC function 13, the EEM function 11, and the population calculator 14 are input to the dependability metrics calculator 15. Connections are provided between a user interface 17 and the EEM function 11, the performance measurement function 12, the SEC function 13, the population calculator 14 and the dependability metrics calculator 15. A user 16, for example a service provider employee, interacts with the DMS 10 via a user interface 17.

[0022]The EEM function 11 monitors, categorizes, stores information re...


PUM


Abstract

A dependability measurement system for use in a communications network includes several functional components which work together to measure, analyze and report the dependability parameters and metrics. A performance measurement function measures performance parameters between a first location and a second location in the communications network. A service-affecting event computation function analyzes performance parameters measured by the performance measurement function. An equipment event measurement function monitors network elements of the communications network for occurrence of network element events. A population calculator determines components within the communications network which are related to the dependability metrics to be reported upon and calculates in-service time information for the components. Finally, a dependability metric calculator calculates, analyzes and reports user requested dependability parameters and metrics using information output from the service-affecting event computation function, equipment event measurement function and population calculator.

Description

FIELD OF THE INVENTION[0001]The invention relates to measuring, analyzing and reporting dependability parameters and dependability metrics in communication networks.BACKGROUND OF THE INVENTION[0002]Currently, dependability Service Level Agreements (SLAs) existing between service providers and service customers and between service providers and solution vendors are ambiguous, vague and difficult to measure. As enterprises become increasingly more dependent on networks for their critical business services, service dependability is becoming an important attribute for service providers to guarantee to service customers. Service dependability refers to aspects of reliability, availability, maintainability, and survivability of services, networks, and network elements. The ability of a service provider to set clear and meaningful dependability SLAs can be a significant market differentiator. However, meaningful SLAs must be able to be measured in a way that reflects the experience of the ...

Claims


Application Information

Patent Timeline
IPC IPC(8): G01R31/08G06F11/00
CPCH04L41/0631H04L41/5032H04L41/5012H04L41/5003
Inventor PATERSON, ROBERTDUNNING, JOHN
Owner CIENA
Learn More