
Forecast model quality index for computer storage capacity planning

a computer storage capacity and quality index technology, applied in the field of forecasting data, can solve problems such as insufficient models, decision-makers in the wrong direction, and often confusing approaches

Active Publication Date: 2010-08-31
LIGHTHOUSE CAPITAL PARTNERS V LP
View PDF10 Cites 19 Cited by
  • Summary
  • Abstract
  • Description
  • Claims
  • Application Information

AI Technical Summary

Benefits of technology

Enables unbiased, objective, and efficient evaluation of model quality, reducing the complexity of interpreting multiple parameters and facilitating automation in decision-making, ensuring more accurate and reliable forecasting and storage capacity planning.

Problems solved by technology

For example, a model may have found the best-fitted trend, but if it was based on a sample of data that was too small to make any reasonable decisions regarding a trend then the model is inadequate, even if the trend explains most of the variation in the data.
In addition, not only is the conventional approach often confusing, it also may be dangerous in situations where a misleading model / forecast criterion is used.
For example, analysts and end users of models and forecasts may make financial decisions based on forecasts, and a misunderstood combination of criteria may drive the decision-maker in the wrong direction.
Such an approach is not useable by someone not skilled in statistics and modeling.
Also, no single parameter can be used to realistically compare various models.
While some modeling and forecasting tools, such as BFS ForecastPro or Autobox, execute an automatic selection of models, these tools do not consistently provide or enforce a multiple-parameter quantitative judgment of model quality or relevance.
Further, the analyst has a variety of model parameters to tune the model with and a variety of model statistics to judge the quality of the tuning, which creates potential problems, as the analyst now has to judge each of the model parameters and decide what they mean in each particular case.
That, however, requires a person sufficiently skilled in statistics to make such decisions and sufficient time to keep re-calculating the model with different controls.
The present state of the art does not provide for a higher-level criterion that allows easily evaluation of a model and / or forecast quality; nor is there such a statistic that would formalize the model quality criteria, such that an automatic evaluation is possible.
In addition, because of this absence of a reliable, simple, and easy-to-understand model quality indicator, automation of decision-making regarding the quality of models using the present state of the art is complicated and / or of questionable accuracy.

Method used


Image

  • Forecast model quality index for computer storage capacity planning
  • Forecast model quality index for computer storage capacity planning
  • Forecast model quality index for computer storage capacity planning

Examples


Embodiment Construction

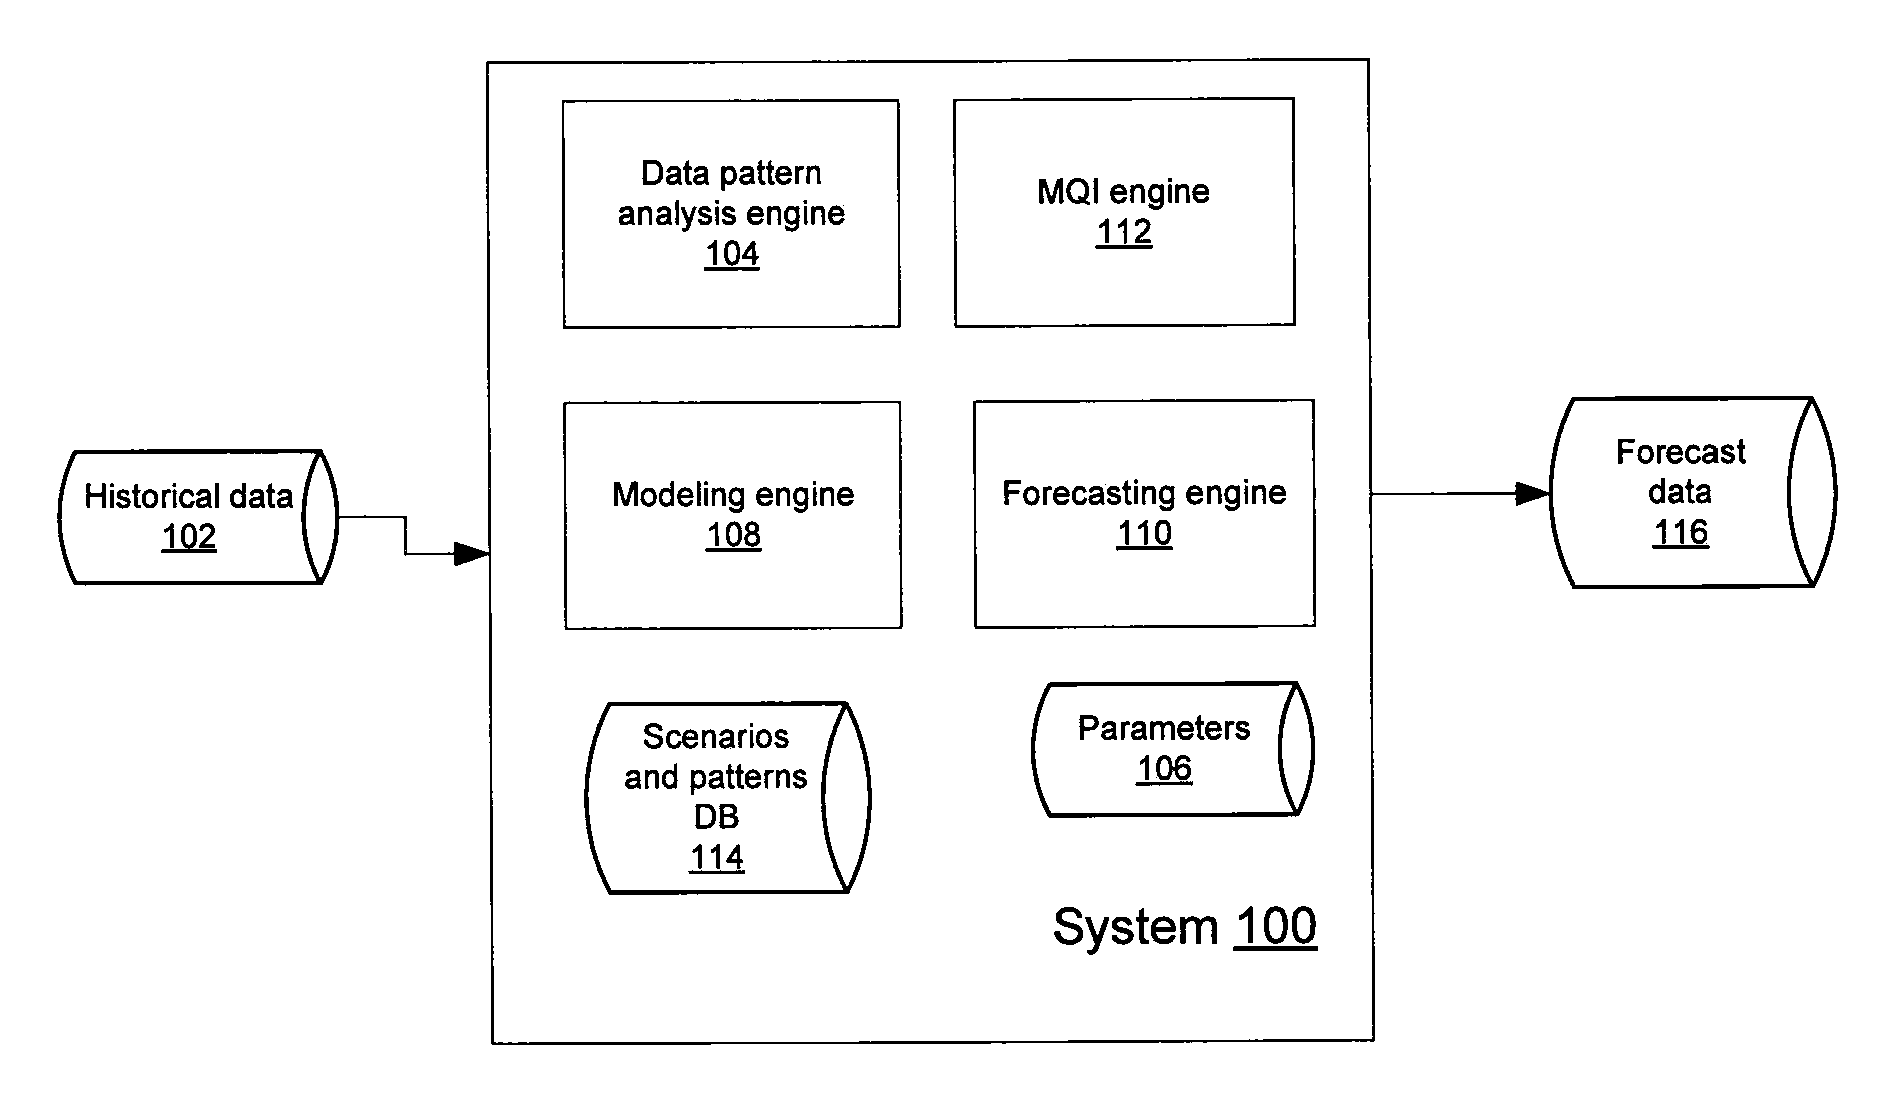
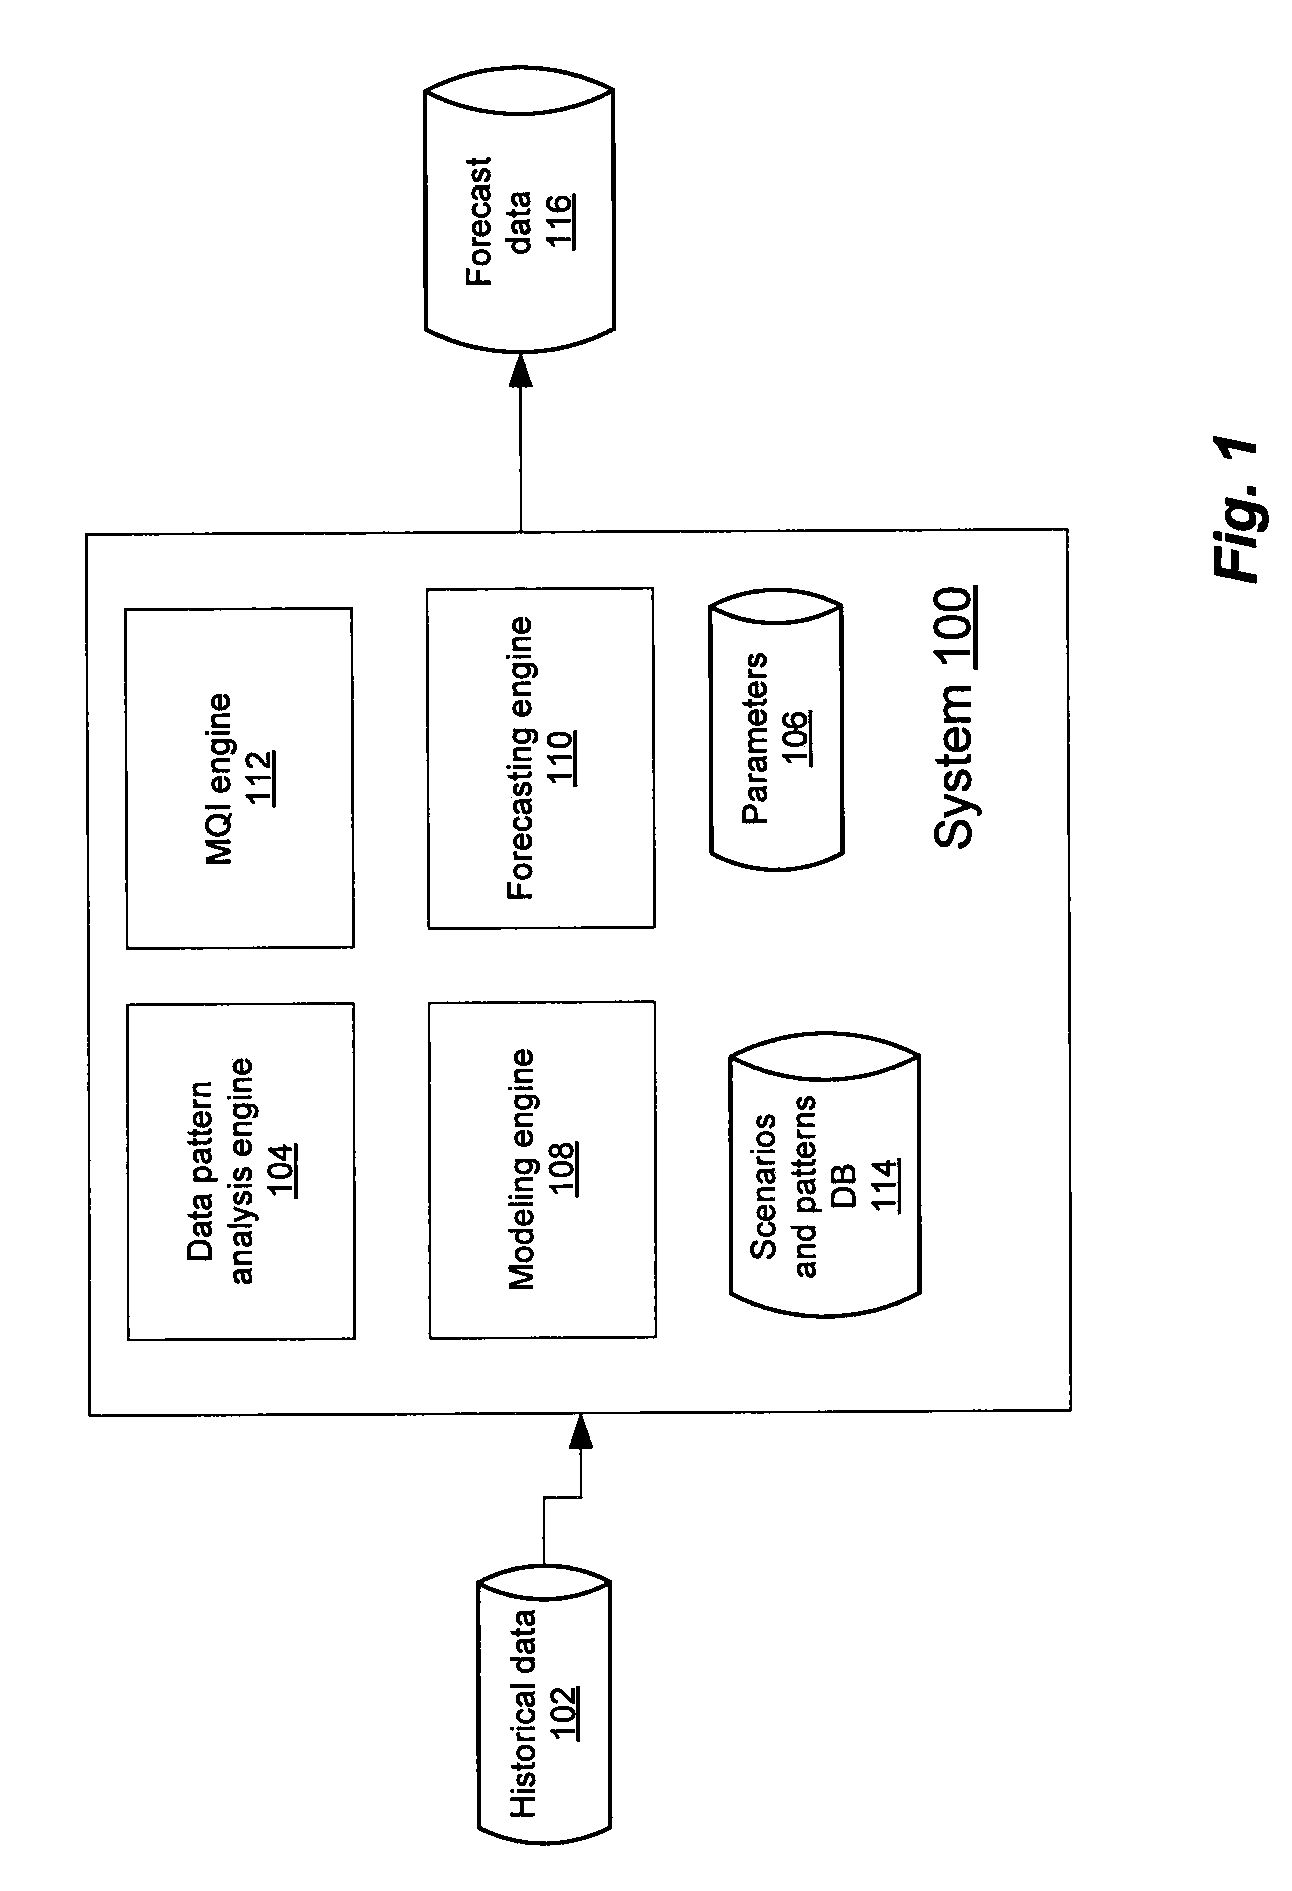
[0021]FIG. 1 illustrates a system 100 for performing modeling and forecasting of data in accordance with an embodiment of the present invention. System b00 includes a data analysis engine 104, a parameters database 106, a modeling engine 108, a forecasting engine 110, a model quality index (MQI) engine 112, and a scenarios and patterns database 114. The operation of each of these elements is described further below.

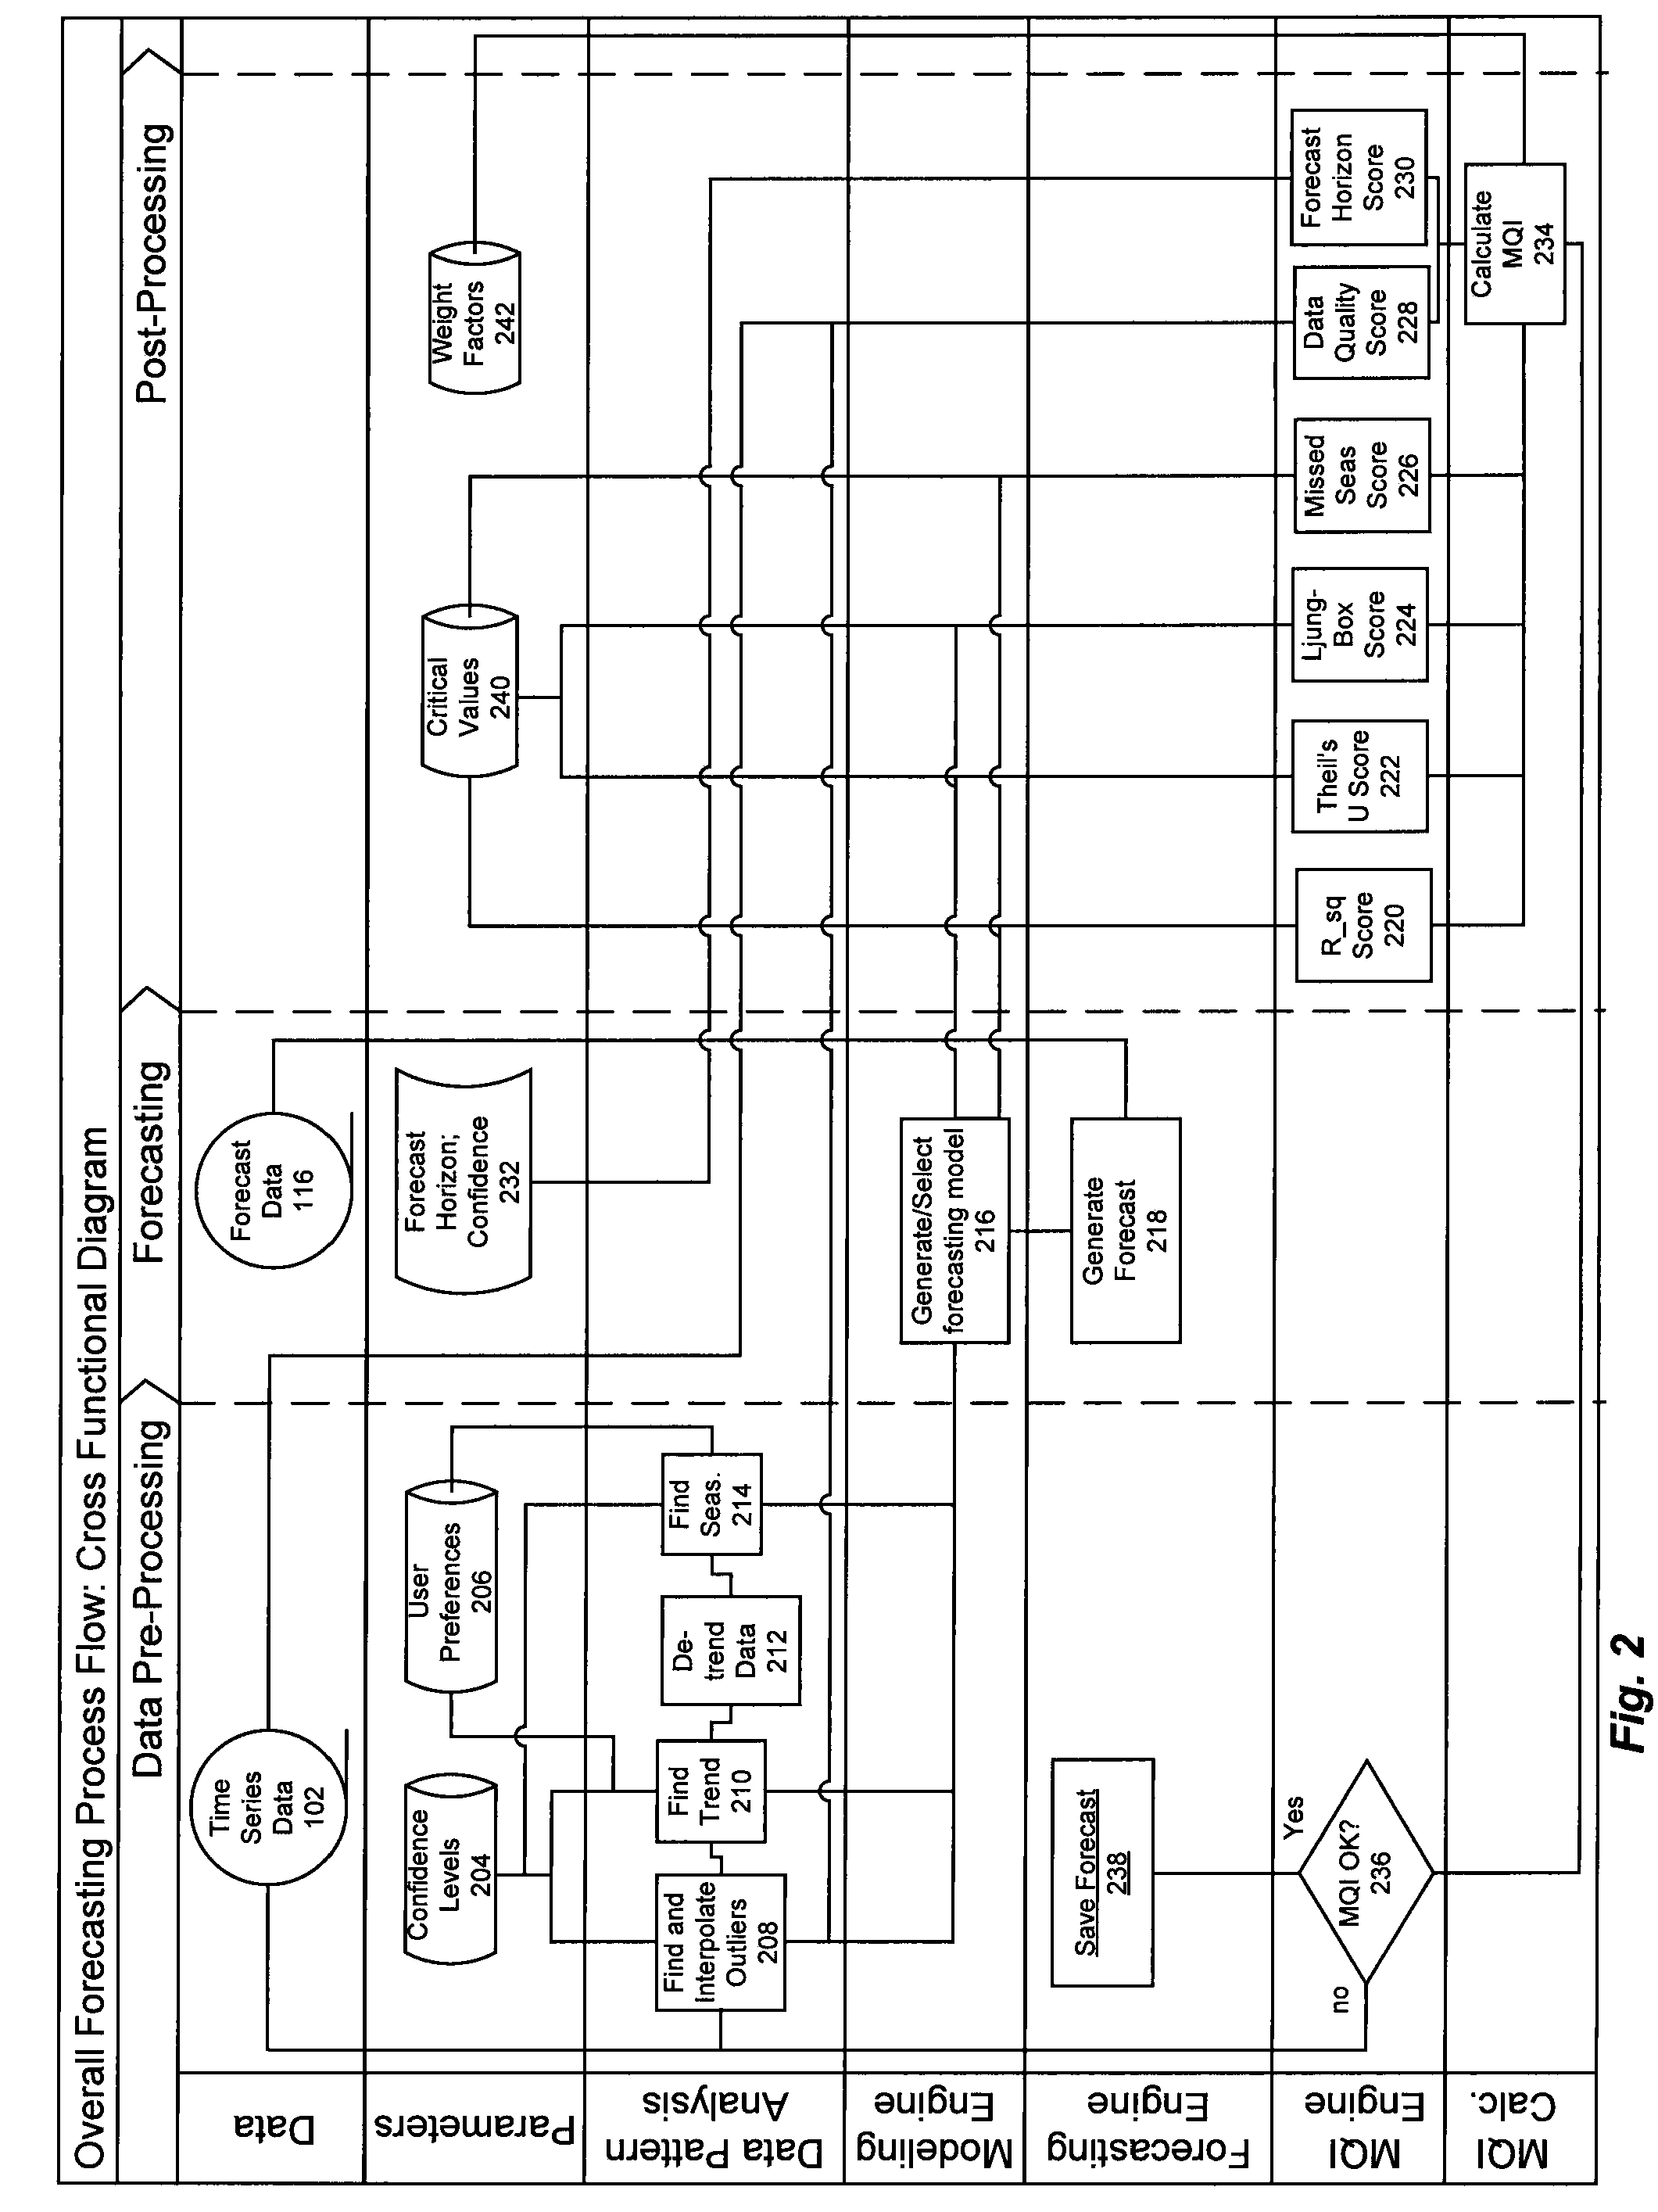
[0022]System 100 receives as input time-series data 102, i.e. a sequence of numbers corresponding to data collected from a system of interest during a time period. Data pattern analysis engine (DPA) 104 analyzes this historical data 102 in order to find and interpolate outliers, identify trends in the data, de-trend the data, and find seasonality in the data. DPA 104 then provides this information to modeling engine 108, which in turn generates a forecasting model based on the provided data from DPA engine 104. The model is then provided to forecasting engine 110, in orde...


PUM


Abstract

A robust, simple, application-specific way to evaluate data models and forecasts is provided for evaluating whether a forecast is trustworthy. An approach for formulating a single, summary indication of data / model / forecast quality relevant for the task at hand is described. This approach includes generating a forecast model from collected data, combining multiple model-quality parameters based on the model, computing an indication based on the combination of parameters, and evaluating the model and forecast quality based on the indication. This indication, in the form of a Model Quality Index, can also be used to compare different types of models produced by different types of analysis approaches.

Description

CROSS-REFERENCE TO RELATED APPLICATIONS[0001]This application claims the benefit of U.S. provisional applications 60 / 805,728, filed on Jun. 23, 2006; 60 / 805,729, filed on Jun. 23, 2006; and 60 / 945,546, filed on Jun. 21, 2007. Each of the above applications is incorporated by reference herein in its entirety.[0002]This application is also related to U.S. patent application Ser. No. 11 / 823,108, titled “Data Pattern Analysis,” filed on Jun. 25, 2007, and incorporated by reference herein in its entirety.BACKGROUND[0003]1. Field of the Invention[0004]The present invention pertains in general to modeling and forecasting of data. In particular, the present invention is directed to evaluating the quality of models designed to forecast data usage and storage requirements.[0005]2. Background of the Invention[0006]A conventional approach to statistical modeling and forecasting is to use a variety of statistics to evaluate model quality and to pick the one statistic that best serves the purpose...

Claims


Application Information

Patent Timeline
Patent Type & Authority Patents(United States)
IPC IPC(8): G06F17/50
CPCG06Q10/00G06Q10/06315G06Q30/0202
Inventor GILGUR, ALEXANDERPERKA, MICHAEL F.
Owner LIGHTHOUSE CAPITAL PARTNERS V LP
Learn More