Graphical user interface for prototyping early instance density

a prototype density and graphical user interface technology, applied in the field of design tools, can solve the problems of little means by which to display the available information, the current electronic circuit design tool generally only displays limited information using the graphical user interface of the tool, and the designers cannot visually identify

Inactive Publication Date: 2010-10-05
CADENCE DESIGN SYST INC
View PDF6 Cites 20 Cited by
  • Summary
  • Abstract
  • Description
  • Claims
  • Application Information

AI Technical Summary

Benefits of technology

[0007]According to an embodiment of the invention, the visual indicator can be a color and the relative distance can be indicated by brightness, hue or saturation. For example, the viability of a design can, in one embodiment, be determined by the color of an instance. This graphical information can provide a designer with a display that graphically shows, e.g., relative timing, area, distance, relative power consumption, etc. Thi...

Problems solved by technology

Currently circuit design tools do not allow designers to visually identify the relative impact of cell placement density and timing.
Even after analysis tools are run, there is very little means by which to display the available information.
Current electronic circuit design tools generally only display limited information using the tools graphical user interface.
Further, even after the post routing and...

Method used


Image

  • Graphical user interface for prototyping early instance density
  • Graphical user interface for prototyping early instance density
  • Graphical user interface for prototyping early instance density

Examples


Embodiment Construction

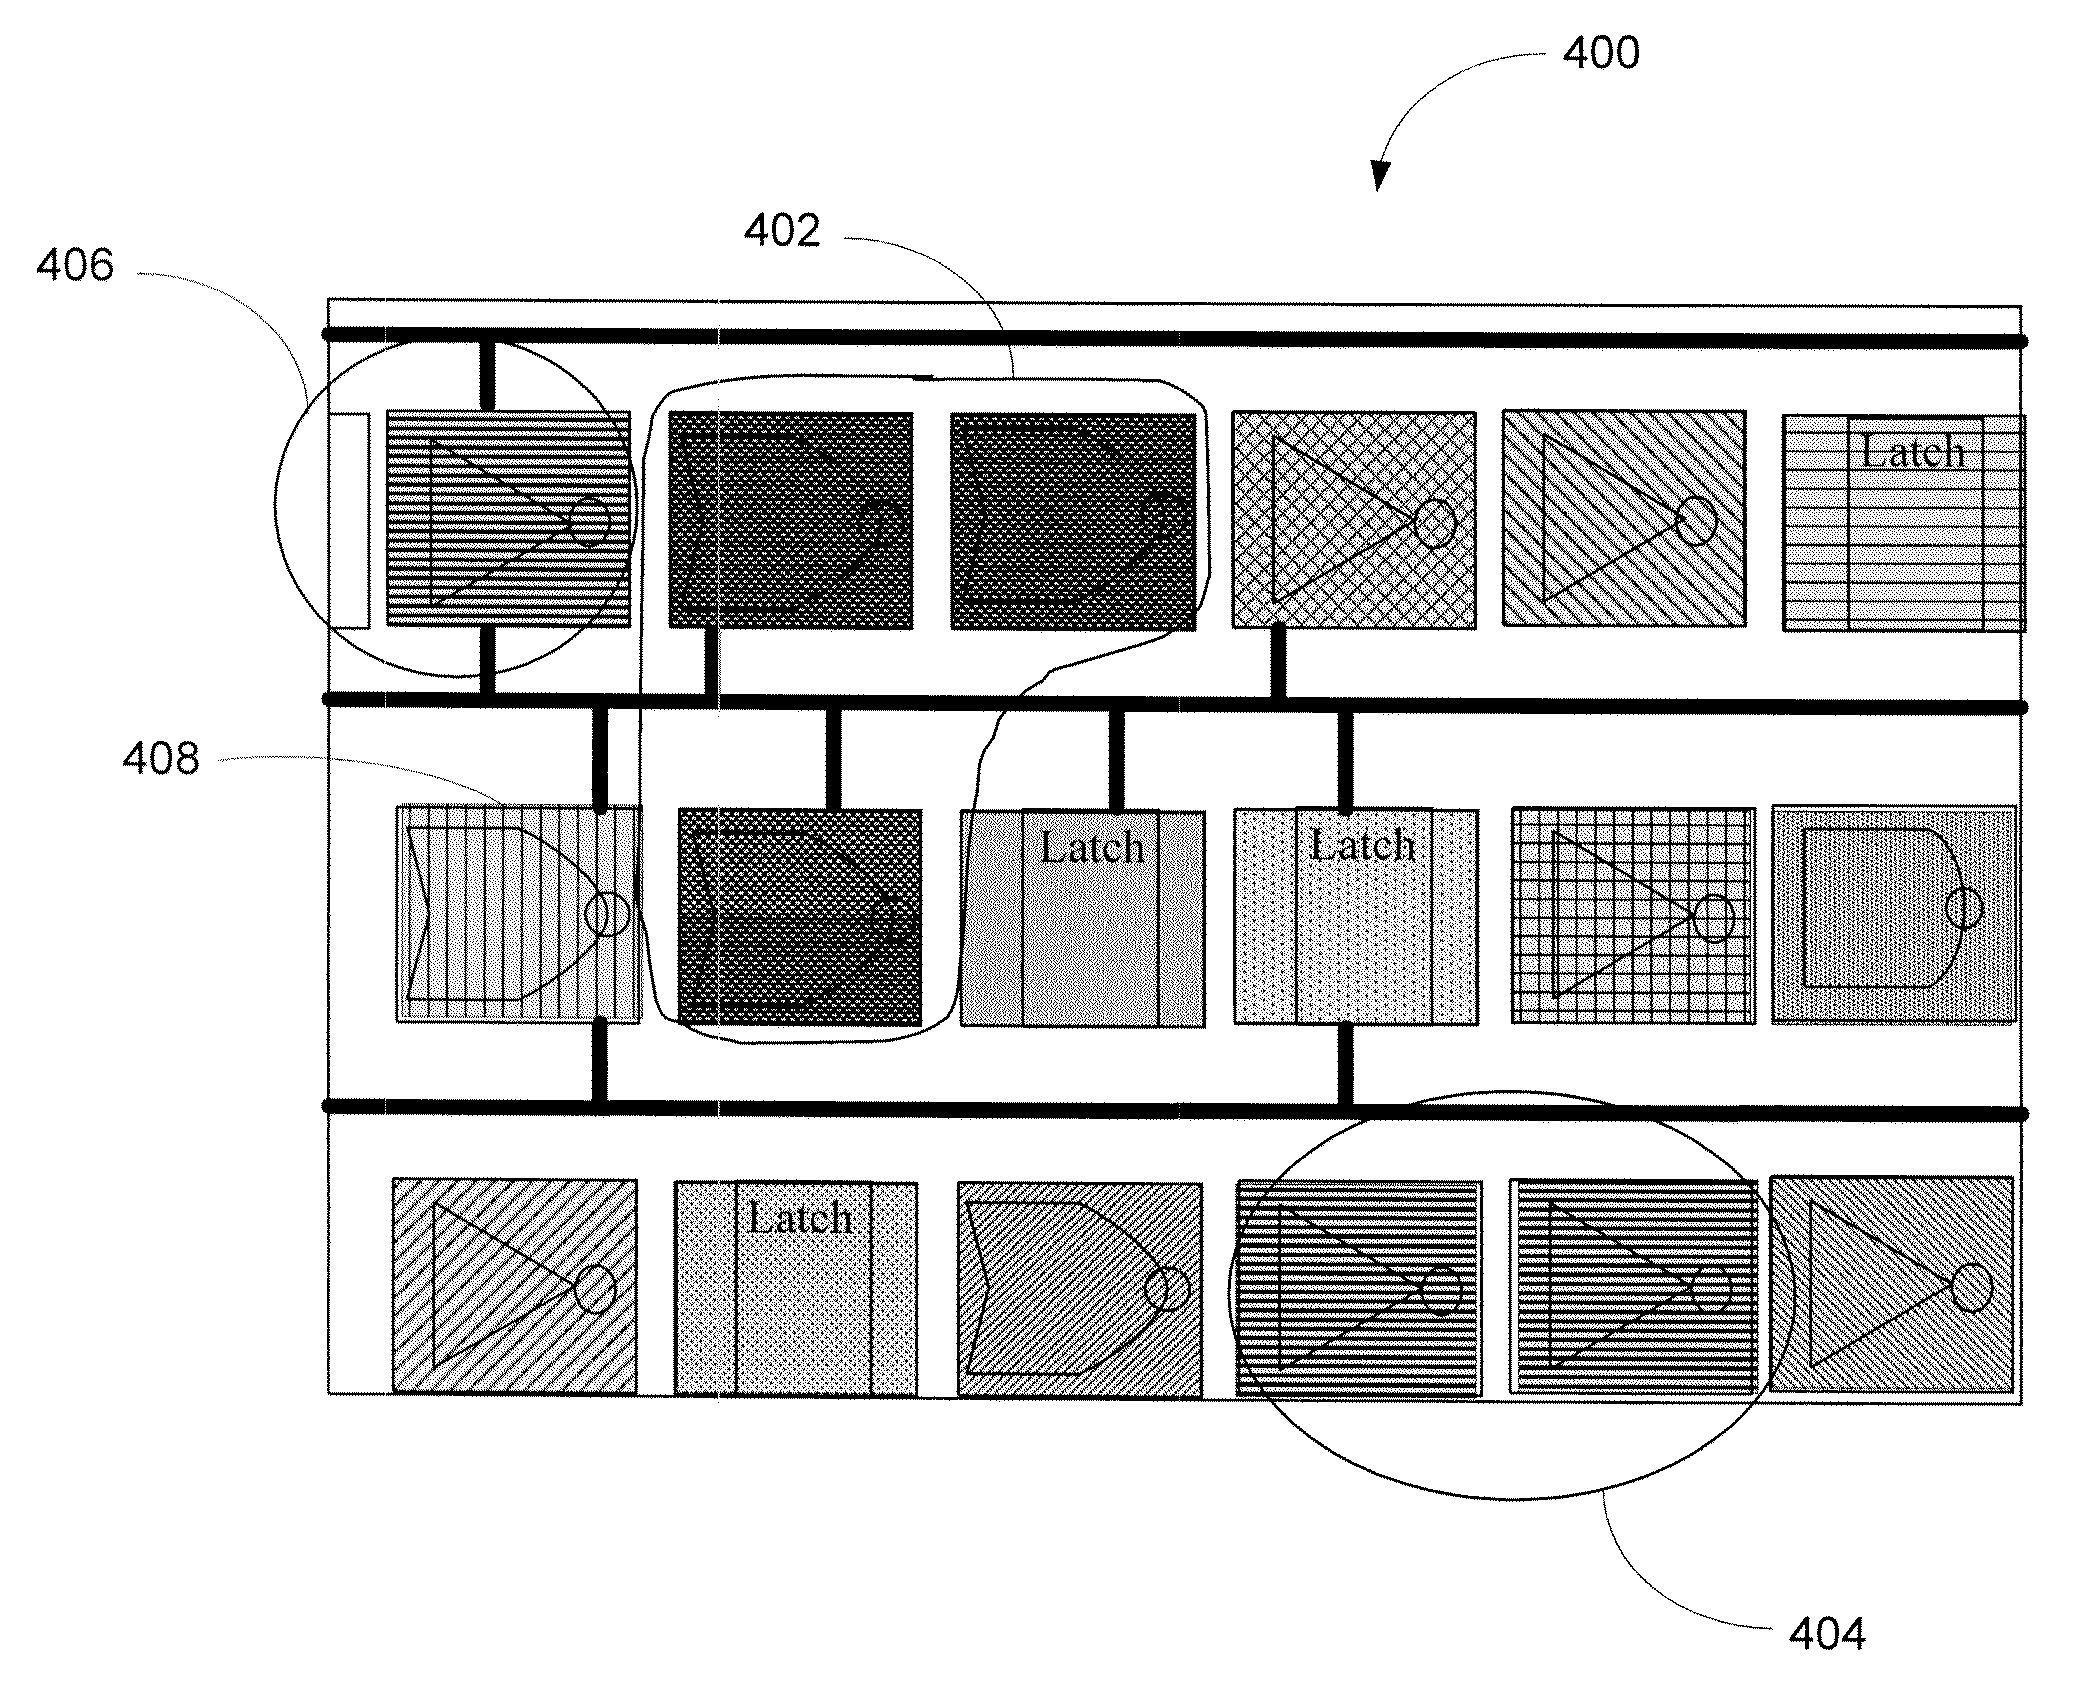
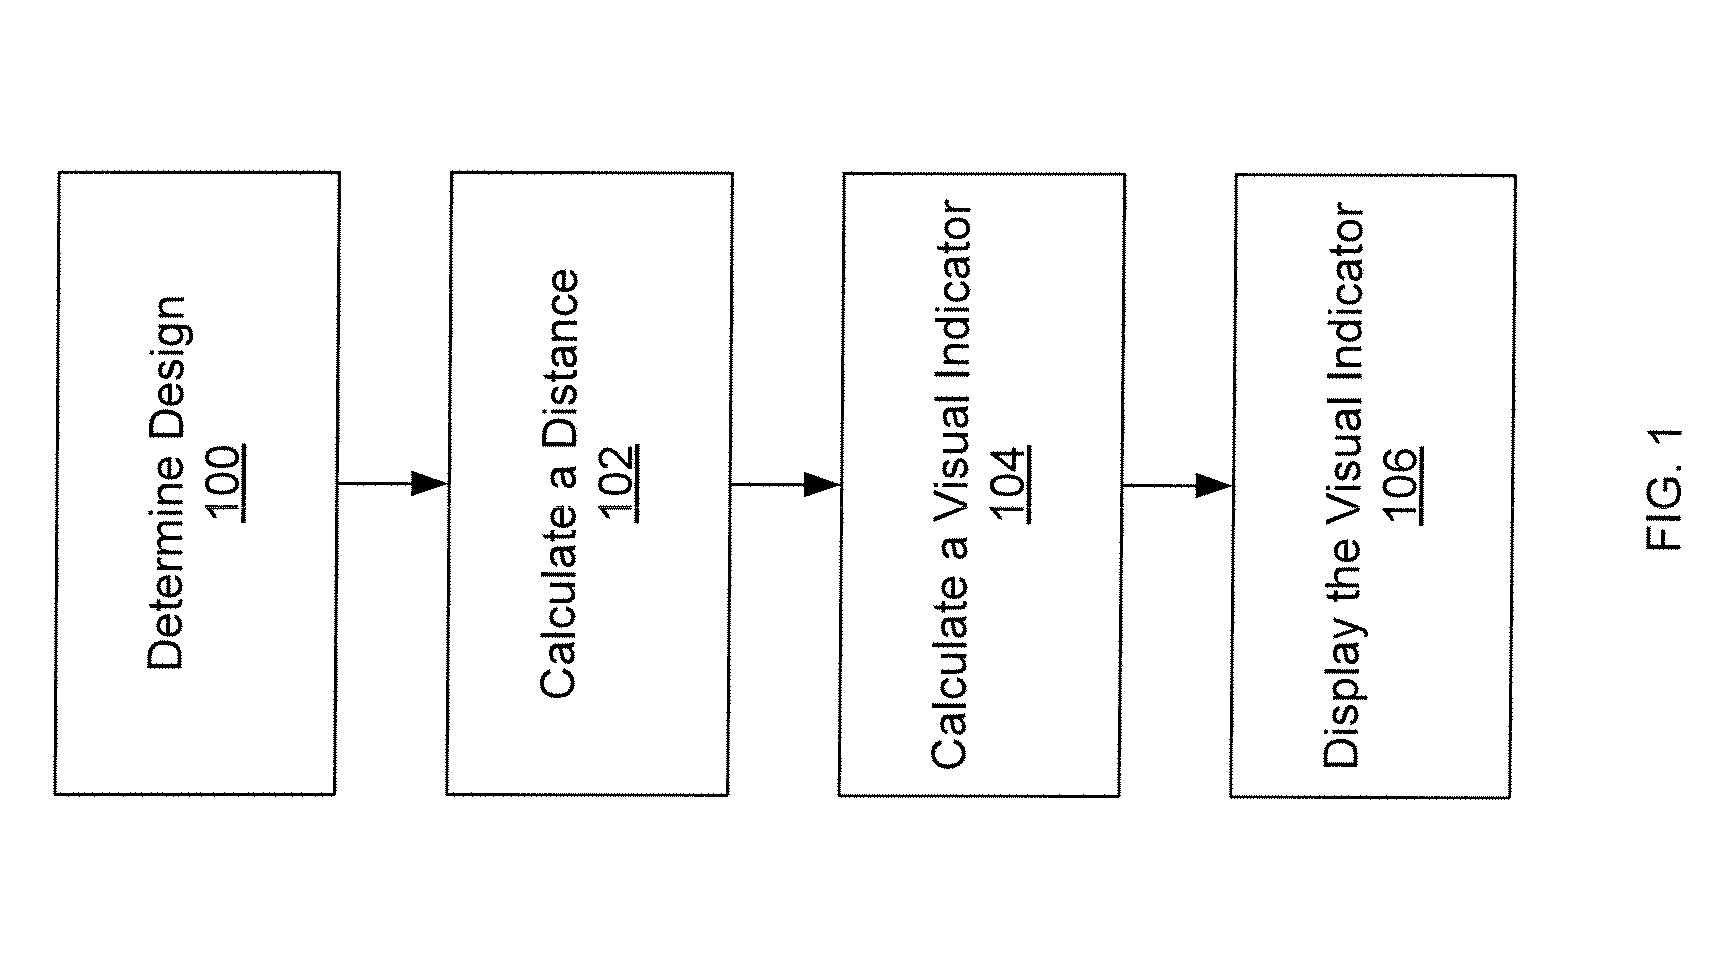
[0006]According to various embodiments of the invention, electronic circuit design information can be presented to a designer by evaluating an electronic circuit. The design can comprise at least two gates. These gates can be a stage in a timing path of the design. A distance from one gate relative to another gate in the stage can be calculated and a visual indicator for the stage can be calculated based on the distances between at least two gates in the stage. The visual indicator can then be displayed.

[0007]According to an embodiment of the invention, the visual indicator can be a color and the relative distance can be indicated by brightness, hue or saturation. For example, the viability of a design can, in one embodiment, be determined by the color of an instance. This graphical information can provide a designer with a display that graphically shows, e.g., relative timing, area, distance, relative power consumption, etc. This information is provided during the prototyping stage...


PUM


Abstract

According to various embodiments of the invention electronic circuit design information can be presented to a designer by determining an electronic circuit comprising at least two gates and by determining a distance of one gate relative to another gate in a stage. A visual indicator for the stage can be calculated based on the distances between at least two gates in the stage. The visual indicator can then be displayed. The visual indicator can be a color and the relative distance can be indicated by brightness, hue or saturation, etc. Alternatively, the visual indicator can be a pattern and the relative distance between at least two gates can be indicated by darkness of the pattern.

Description

TECHNICAL FIELD[0001]The present invention relates to design tools, and more particularly, some embodiments relate to graphical presentation within design tools.DESCRIPTION OF THE RELATED ART[0002]Currently circuit design tools do not allow designers to visually identify the relative impact of cell placement density and timing. For example, peak power demand can be based on various variables that are not generally available until later stages of the design flow using current tools. Even after analysis tools are run, there is very little means by which to display the available information. For example, the information is not made available in a graphical form that can, in some cases, be more quickly interpreted by a designer. Generally, in current circuit design tools, the information may be made available in the form of text based reports, if at all.[0003]Current electronic circuit design tools generally only display limited information using the tools graphical user interface. For ...

Claims


Application Information

Patent Timeline
IPC IPC(8): G06F17/50
CPCG06F17/5045G06F2217/74G06F30/30G06F2111/12
Inventor SHARMA, HARSH DEVLEE, PO-CHIANG ALBERTSRIVASTAVA, RAJEEVKOMMOORI, SRINIVAS R.BHUSHAN, BHARATPARUI, MITHUNJOY
Owner CADENCE DESIGN SYST INC
Why Eureka
Try Eureka