Peak visualization enhancement display system for use with a compressed waveform display on a non-destructive inspection instrument

a display system and compressed waveform technology, applied in the direction of instruments, digital computer details, code conversion, etc., can solve the problems of affecting the performance affecting the quality of the display system, so as to reduce the likelihood of a noise spike or the like, prevent the noise spike, and reduce the noise level of the uncompressed waveform

Active Publication Date: 2013-04-16
OLYMPUS NDT
View PDF8 Cites 4 Cited by
  • Summary
  • Abstract
  • Description
  • Claims
  • Application Information

AI Technical Summary

Benefits of technology

[0015]Controls are provided within the algorithm to prevent noise spikes and the like from becoming displayed as false peaks on the digitally displayed waveform. These include minimum values for determining valid waveform slopes around apparent zero slope points and a desample control, which allows the PVE peak detection algorithm to decimate the raw waveform data by a set factor during peak detection. These controls are shown in FIG. 5 and described in detail in the Detailed Description section of the present disclosure.
[0016]In one embodiment of the present disclosure, uncompressed waveform data is passed through a digital filter prior to the PVE peak detection algorithm. This filter can be used to reduce the noise level of the uncompressed waveform prior to its analysis within the PVE algorithm without affecting the waveform as displayed. In certain applications, the use of a filter in this way can significantly reduce the likelihood of a noise spike or the like resulting in a false peak.
[0017]In the preferred embodiment of the present disclosure, the PVE display system is used within a so-called acquire / playback system. That is, a measurement waveform is fully acquired, digitized, and stored in a temporary memory space in a first operation. In a second operation the digitized waveform is played back from the temporary memory space, processed through any number of DSP algorithms (digital filtering, time varied gain, digital compression, and the like), and displayed to an operator on a digital display. In state of the art NDI instruments, both these operations can be completed within a desired repetition rate (that is, the number of waveforms acquired per second), allowing an acquire / playback system to provide real time, processed waveform data to a digital display. Within this type of system, the PVE algorithm can be run continuously on the entire digitized waveform, ensuring that no peak information is missed.
[0022]Accordingly it is the object of the present disclosure to provide a Peak Visualization Enhancement (PVE) system for use with an NDI instrument which replicates the haloing effect of an analog CRT display.
[0024]It is further an object of the present disclosure that this algorithm include valid slope identification and desampling controls such that the possibility of identifying a noise spike or the like as a valid peak is reduced.

Problems solved by technology

While digital waveform displays, making use of intelligently compressed waveform data displayed at high resolution, offer significant improvements over prior art analog CRT displays, one aspect of analog CRT systems is lost in the move to digital display systems.
Similarly, operators performing intergranular stress corrosion cracking (IGSCC) inspections often encounter complex, so-called spindle cracks which propagate in multiple directions along the grain of a course material.
As the haloing effect does not exist in digital displays, many operators who rely on it are reluctant or unable to use the more advanced NDI instruments offered in the marketplace today.
This prevents such operators from benefiting from the many advantages of digital NDI systems and limits the effectiveness and accuracy of their inspection operations.
Some attempts have been made to mimic the haloing effect in digital NDI instruments (most notably the so-called “Sparkle” feature offered in some portable instruments offered by GE Inspection Technologies, located in Billerica, Mass.) by simply highlighting the maximum value of each compression zone, but this technique is lacking.
It does not accurately represent peak values in highly compressed data, and it does not preserve peak information when multiple peaks are displayed in very close vicinity on a display.

Method used


Image

  • Peak visualization enhancement display system for use with a compressed waveform display on a non-destructive inspection instrument
  • Peak visualization enhancement display system for use with a compressed waveform display on a non-destructive inspection instrument
  • Peak visualization enhancement display system for use with a compressed waveform display on a non-destructive inspection instrument

Examples


Embodiment Construction

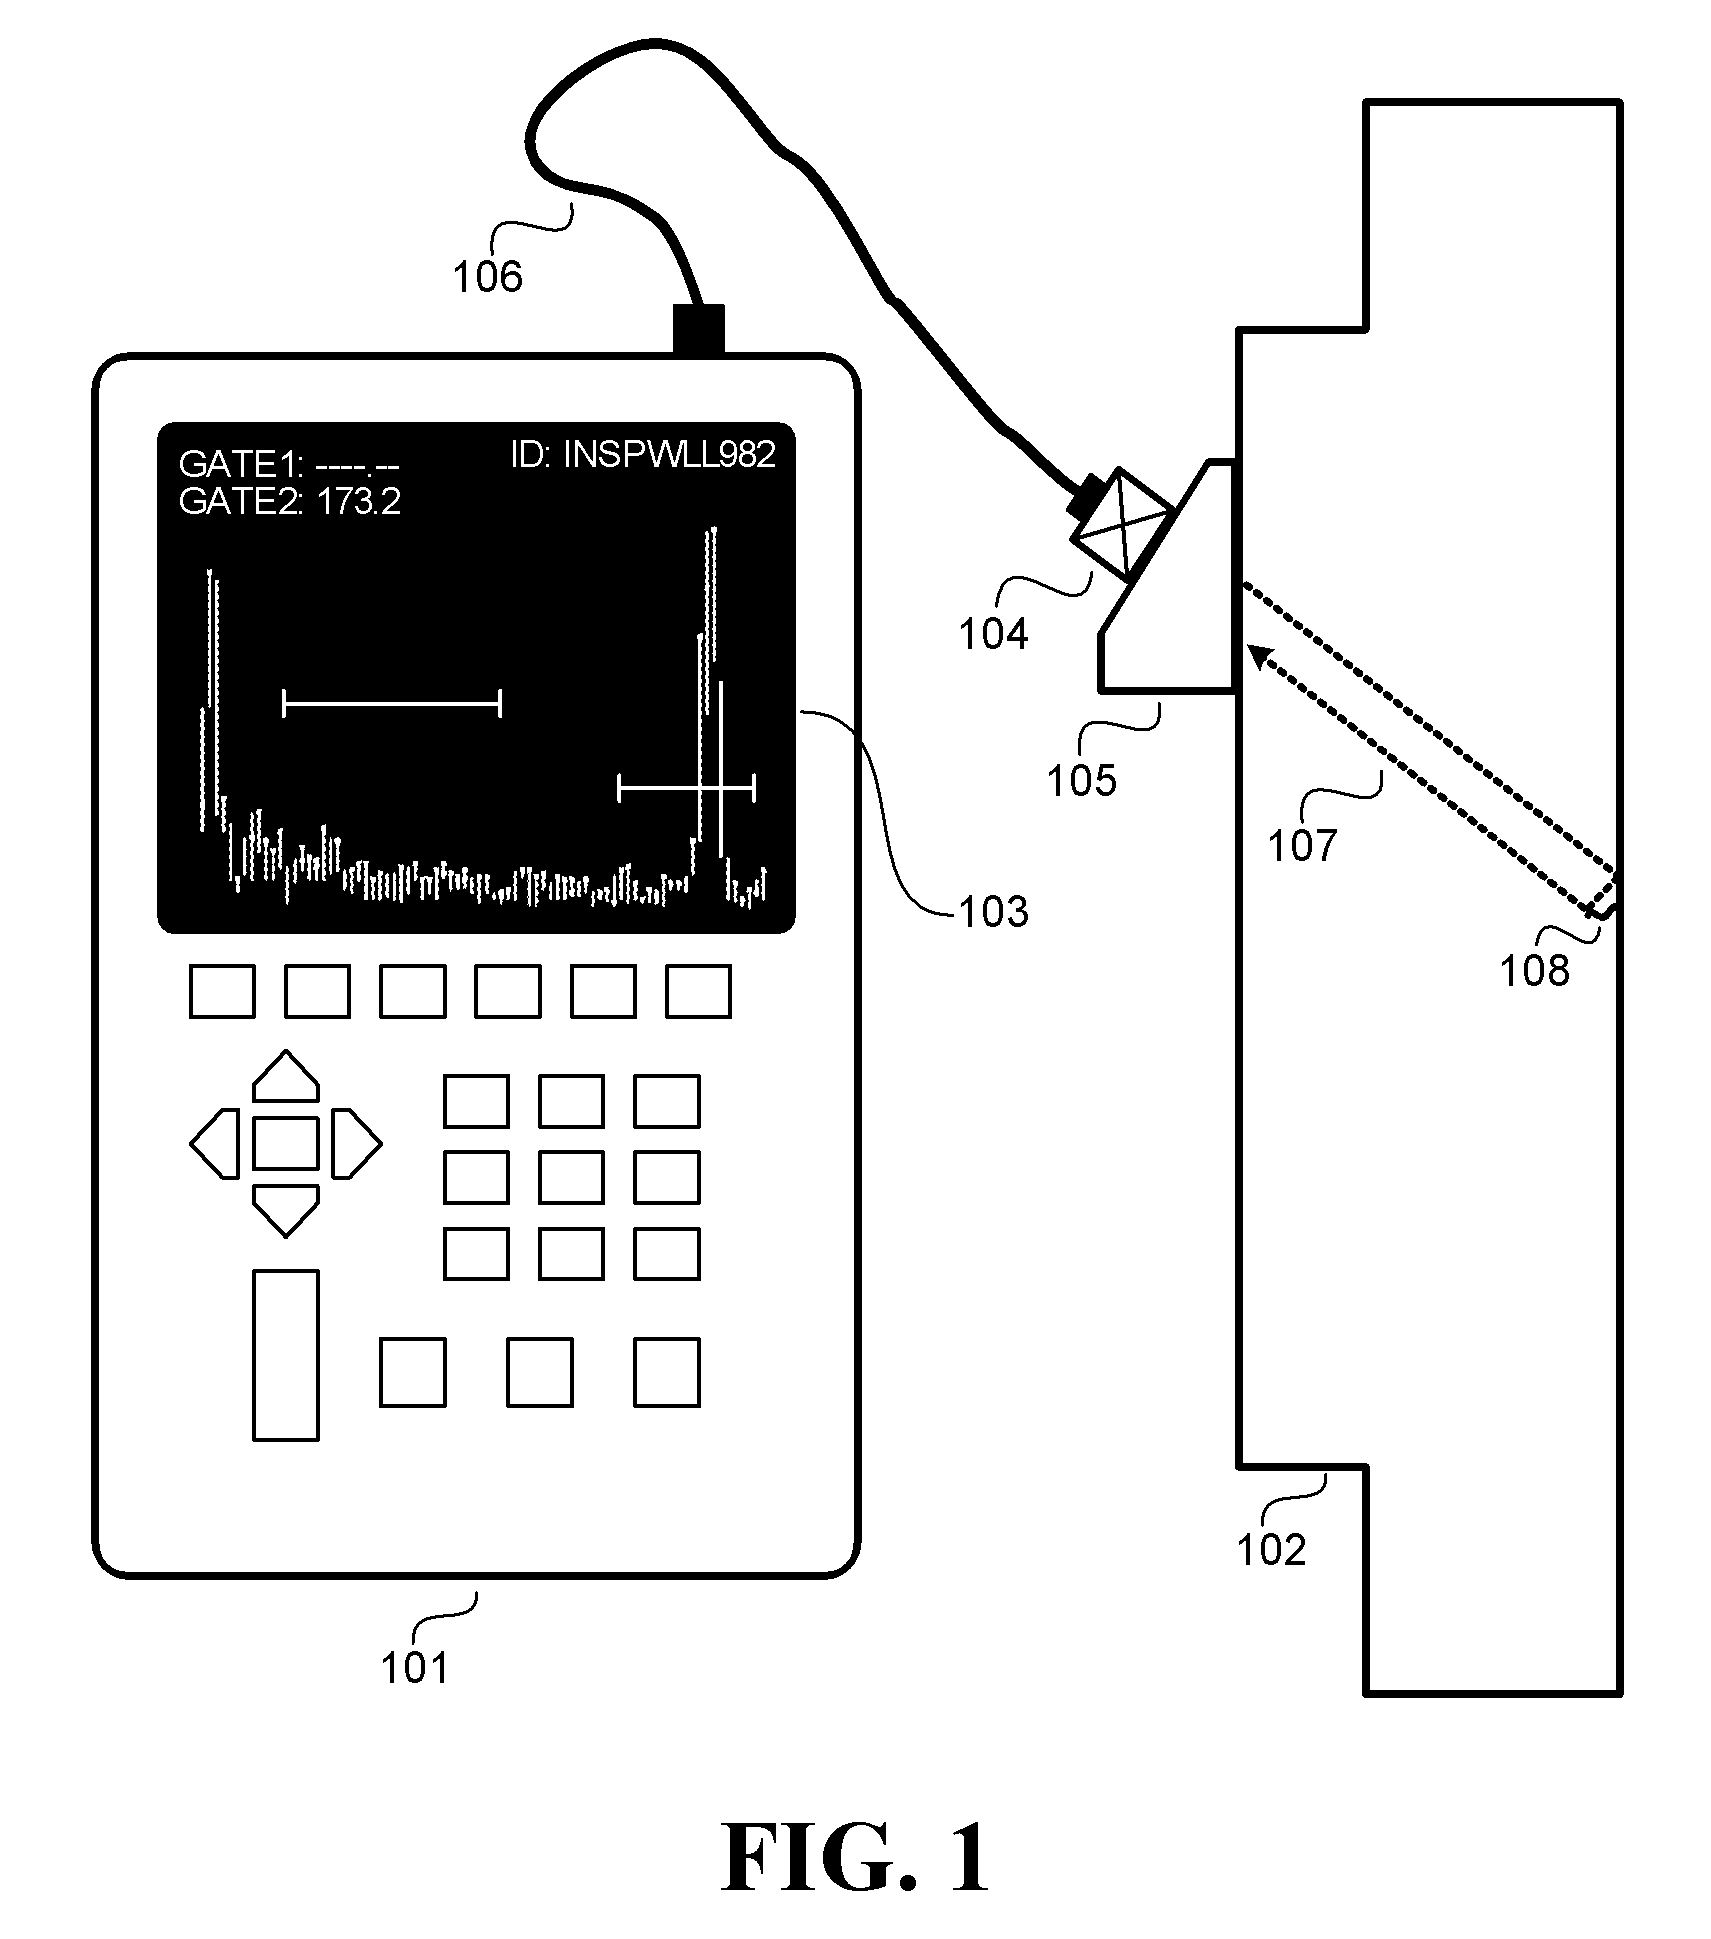
[0042]FIG. 1 illustrates a typical non-destructive inspection (NDI) instrument 101, specifically an ultrasonic flaw detector, using the Peak Visualization Enhancement (PVE) system of the present disclosure to inspect a flaw 108 within an object under inspection 102. The details and methods of flaw detection with such an instrument should be well known to those skilled in the art, but are presented in brief herein for reference.

[0043]The transducer element 104 is acoustically coupled to a wedge element 105 which is, in turn, acoustically coupled to the object under inspection 102. The ultrasonic flaw detector 101 excites transducer element 104 through transducer cable 106. Responsive to said excitation, the transducer element 104 emits an ultrasonic pulse which propagates through the wedge element 105. The wedge element 105 further transmits said ultrasonic pulse into the object under inspection 102 at a particular angle, said angle selected to meet the needs of the inspection operat...


PUM


Abstract

A peak visualization enhancement system for use with a non-destructive inspection (NDI) instrument using a digital display which replicates the haloing effect of analog cathode ray tube (CRT) displays. A peak detection algorithm is provided which intelligently selects the peak values from within the uncompressed digitized waveform while taking measures to prevent noise spikes and the like from being identified as valid waveform peaks. The digital display then highlights the identified peaks, or a subset of the identified peaks, on the compressed waveform display. In this way the effect of bright spots (halos) about the zero slope points on a waveform displayed on an analog CRT is replicated in a digitally compressed waveform display.

Description

CROSS REFERENCE TO RELATED APPLICATIONS[0001]This application claims the benefit and priority of U.S. Provisional patent application Ser. No. 61 / 034,566, filed Mar. 7, 2008 entitled A PEAK VISUALIZATION ENHANCEMENT DISPLAY SYSTEM FOR USE WITH A COMPRESSED WAVEFORM DISPLAY ON A NON-DESTRUCTIVE INSPECTION INSTRUMENT, the entire disclosure of which is incorporated herein by reference.BACKGROUND OF THE INVENTION[0002]The present invention relates to non-destructive inspection (NDI) instruments, and more particularly to a peak visualization enhancement display system for said instruments which replicates the so-called haloing effect of analog cathode ray tube (CRT) displays.[0003]Any discussion of the related art throughout this specification should in no way be considered as an admission that such art is widely known or forms a part of the common general knowledge in the field.[0004]As digital signal processing methods and techniques have increased in power, speed, and availability in r...

Claims


Application Information

Patent Timeline
Patent Type & Authority Patents(United States)
IPC IPC(8): G06T11/20H04B15/00H03F1/26H03M1/00
CPCG01R13/02G01R13/029G06K9/00543G06F2218/14
Inventor THOMAS, ANDREW R.BESSER, STEVENKASS, DANIELHENJES, ERICHGHABOUR, EHABDULAC, MARCDEANGELO, PAUL J.
Owner OLYMPUS NDT
Why Eureka
Try Eureka