Graphical models for cyber security analysis in enterprise networks

a cyber security analysis and network design technology, applied in the direction of unauthorized memory use protection, instruments, error detection/correction, etc., can solve the problems of inability to achieve such goals, lack of “action” related systems to effectively deal with enterprise network intrusion, and inconvenient use, so as to reduce redundancy and reduce redundancy. , the effect of minimizing the loss of semantic power

Active Publication Date: 2014-11-04
INTELLIGENT AUTOMATION LLC
View PDF4 Cites 184 Cited by
  • Summary
  • Abstract
  • Description
  • Claims
  • Application Information

AI Technical Summary

Benefits of technology

[0021]It should further be appreciated that given the user application requirements, the actual design of the attack graph is limited by the availability of the informational sources. Such informational sources include, for example, network reachability and vulnerability details. Most of the prior art assumes the availability of network reachability information; however, this assumption creates a significant burden on operators who need to provide such information. Accordingly, it is a further object of the invention to provide a useful tool by automatically computing the reachabillity information in a more accurate and efficient manner.
[0022]It is also believed that an attack graph that captures all possible sequences of attacks on all aspects of network resources leads to a state explosion and ruins scalability. Therefore, it is an object of the present invention to alleviate the need for full graphing, which inherently includes extensive redundancy embedded in such full graphs. In full graphs, the same sequence of attacks can appear multiple times. Accordingly, it is an additional object of the invention to reduce and compress redundancy while minimizing a loss of semantics power. As such, a further object of the subject invention is to generate attack graphs with rich semantics that exploit a compressed format for better scalability.

Problems solved by technology

The design and management of enterprise networks can be very complex and may include several different types of networks and computer systems from different vendors.
However, it is believed that technology currently available is incapable of achieving such goals.
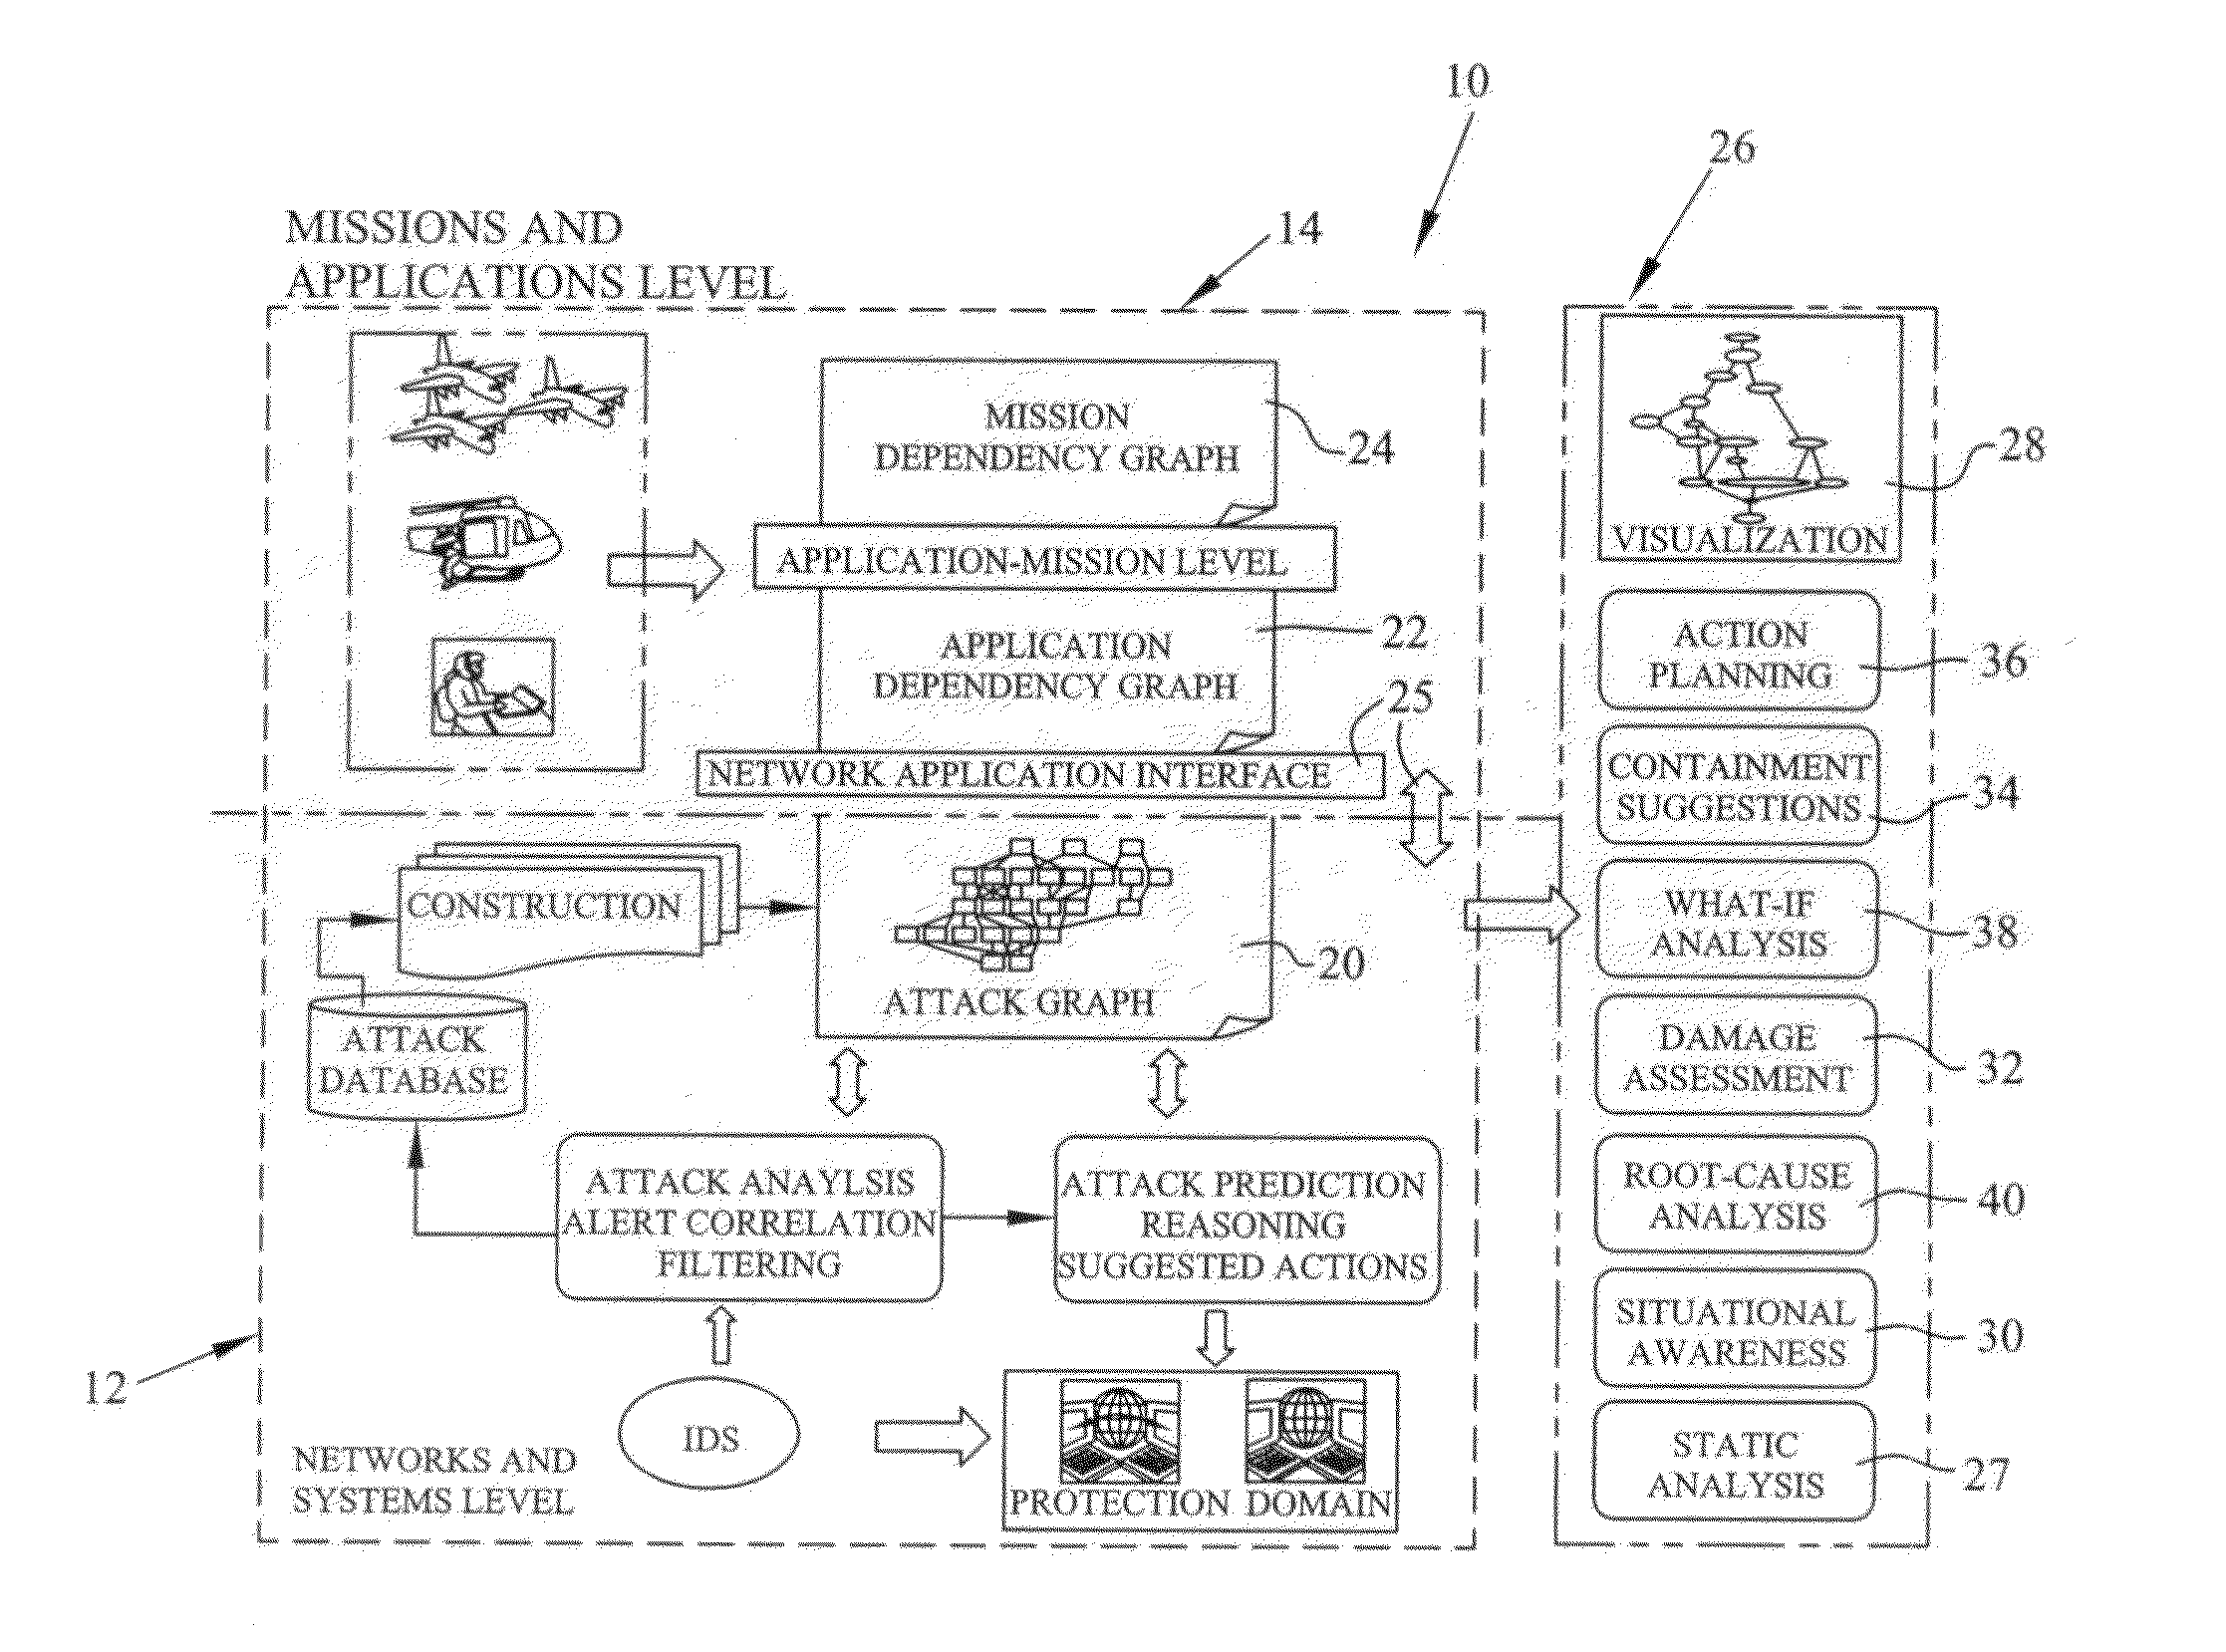
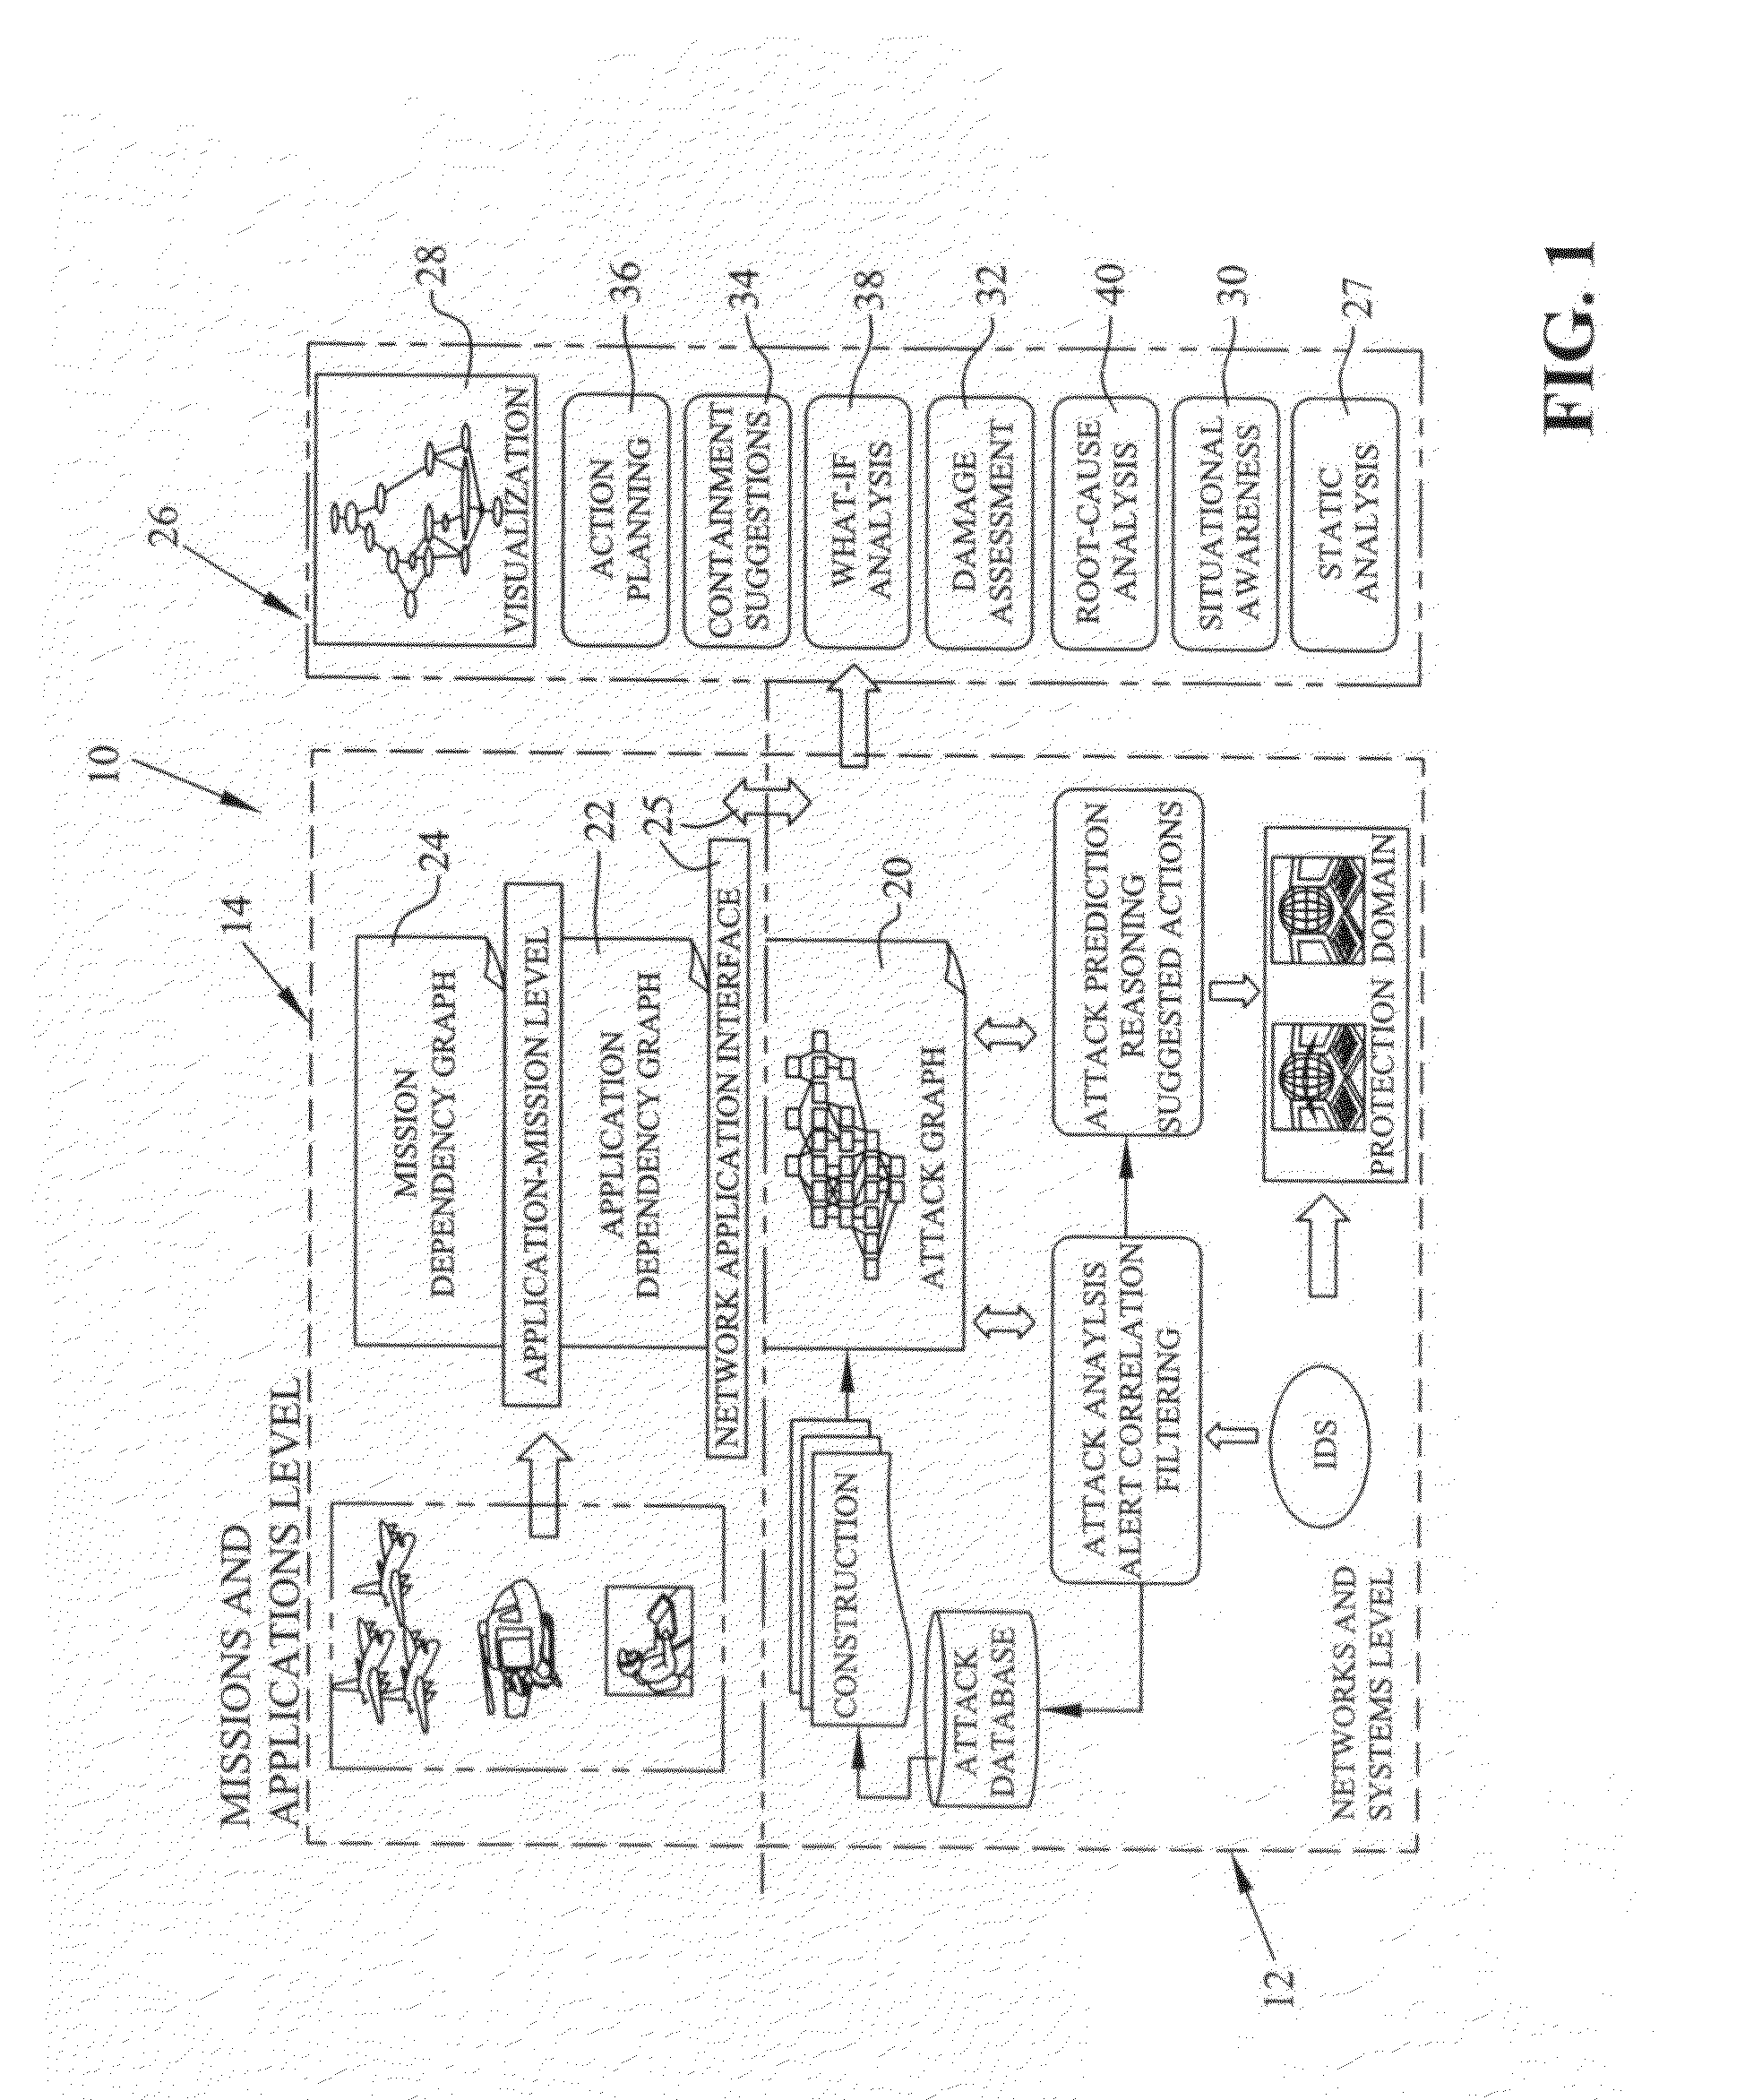
However, there is a lack of “action” related systems to effectively deal with enterprise network intrusion.
However, the complexity and dynamic nature of the networks and systems that comprise the information enterprise can make it difficult for operators to interpret and manage.
Therefore, during cyber attacks, human operators can be inundated by a large number of alarms without being able to correlate, understand, evaluate, or act upon them.
Current systems for transforming information to intelligence (i.e., situational awareness and action planning) are significantly lacking, and useful software tools for such purposes are not currently available.
Such graphs cannot execute application and mission-level damage assessment.
However, such models are insufficient to render network-specific security analysis due to their simplistic semantics and limited scalability.
Thus, one of the biggest impediments to achieving scalability is state explosion.
As such, most available prior art only supports static analysis to answer questions, such as, “Given the current network configurations, which are the weakest spots that need immediate attention?” While static analysis is useful, it is not sufficient if the goal is to achieve real-time situational awareness and responsive action planning.
Attack graphs that provide poor scalability, inefficient analysis, and that require various manual efforts are impractical; however, various kinds of attack graphs have been proposed for analyzing network security.
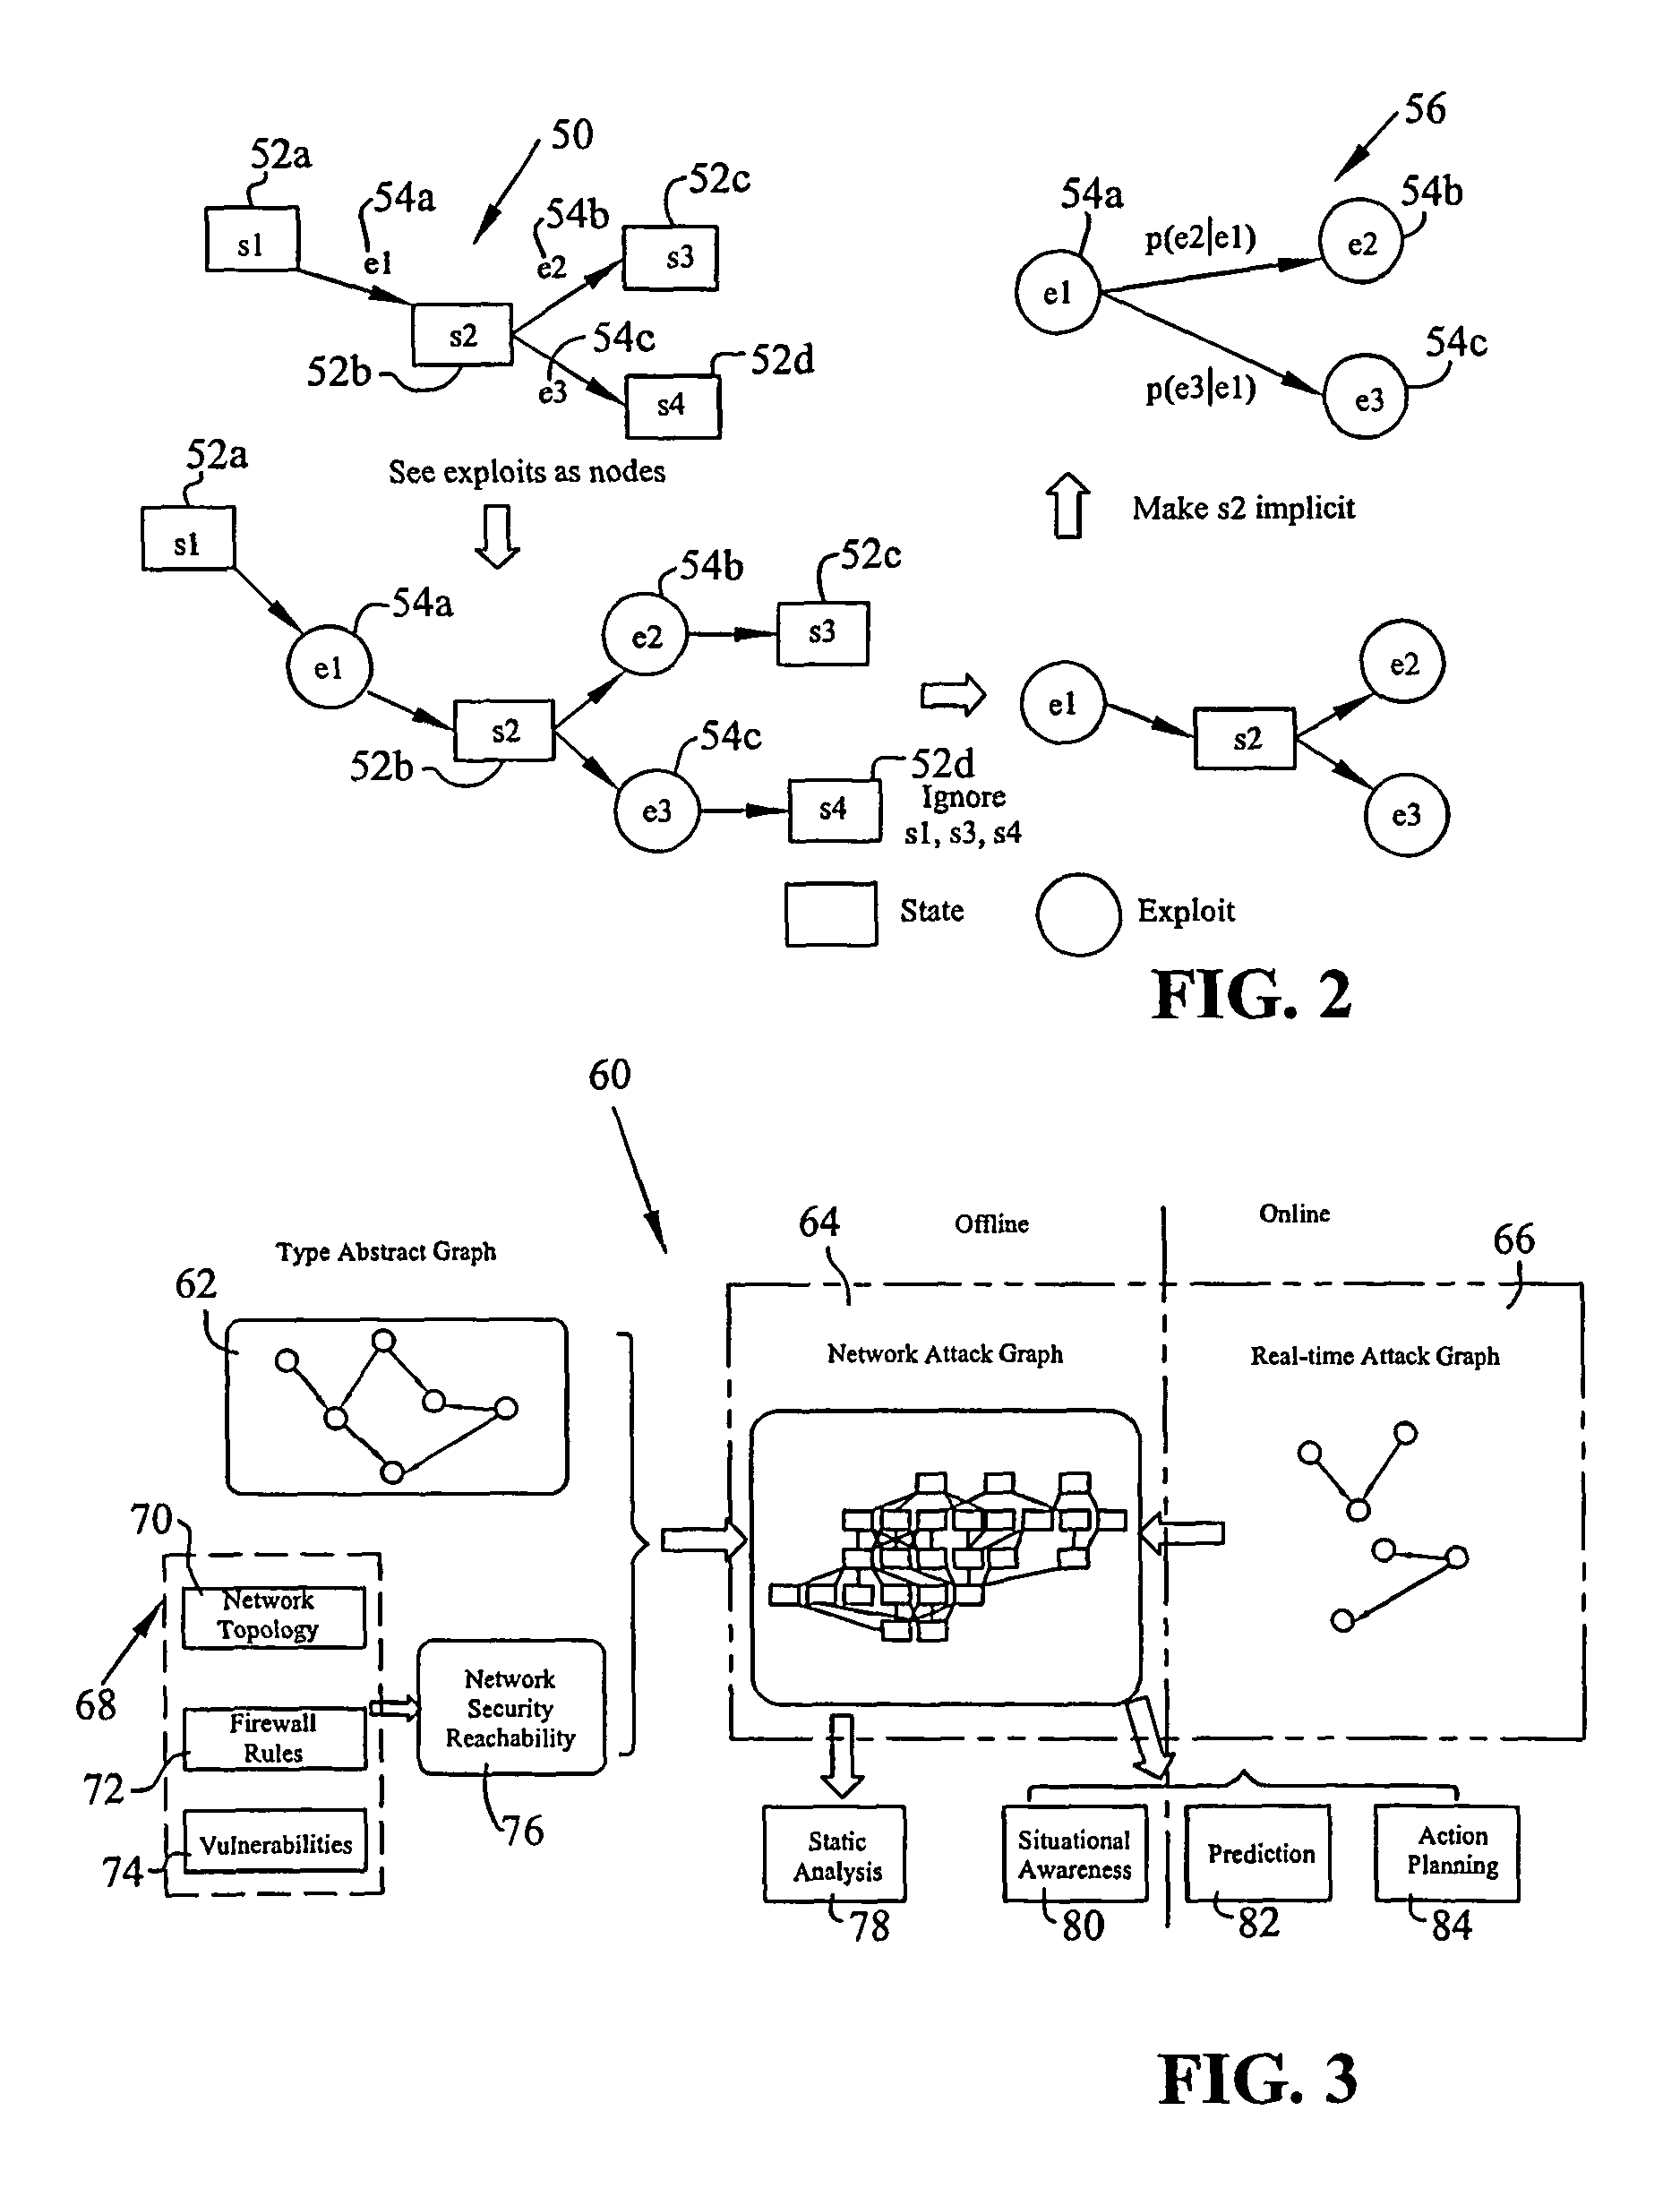
It should be noted that the term “attack graph” is commonly used; however, the definition of an attack graph is not uniform and different uses may associate unique semantics with nodes (endpoints of graphical elements) and edges in models.
As a result, the scalability of this attack graph is extremely poor, as the possible number of states is exponential.
The poor scalability makes overall analysis capability unfeasible except for very small networks.
This inhibits the practical use, and due to the scalability problems, tremendous manual efforts are required.
However, the scalability of the George Mason attack graph is still less than would be desired for large networks.
Similar to the Carnegie Mellon attack graph, it is believed that this kind of attack graph is not practical for enterprise networks, unless further reduction of the graph size is achieved.
A major limitation of the Kansas State attack graph is its analysis capability.
The regeneration requirement and lack of inference capability severely limit the Kansas State attack graph usability in enterprise networks.
Such factorial complexity clearly reduces the scalability of this type of graph, which we believe makes it unsuitable for practical usage in enterprise networks.
Therefore, its analytic capability is restricted, which severely limits its power and practicality as a useful tool in enterprise networks.
In other words, the Host Compromise Graph is scalable, but not really practical for enterprise networks.
As such, its scalability is uncertain, though it does offer some promise.
However, the Predictive Attack Graph does not support real-time situational awareness or answer predictive “what-if” questions, such as, “What will be the impact on security if I do X and Y, given the current evidence of attacks?” For large-scale enterprise networks, and military networks in particular, such situational awareness and dynamic response capability is extremely important.
For example, the Carnegie Mellon University attack graph captures all aspects of network states and exploits; however, the attack graph size is often prohibitive, and the poor scalability makes it impractical for enterprise networks.
At the other end of the spectrum, if an attack graph only captures what hosts can be compromised, such as the MIT Host Compromise Graph, then weak semantics limit the analysis capability.
It should further be appreciated that given the user application requirements, the actual design of the attack graph is limited by the availability of the informational sources.
Most of the prior art assumes the availability of network reachability information; however, this assumption creates a significant burden on operators who need to provide such information.
It is also believed that an attack graph that captures all possible sequences of attacks on all aspects of network resources leads to a state explosion and ruins scalability.

Method used


Image

  • Graphical models for cyber security analysis in enterprise networks
  • Graphical models for cyber security analysis in enterprise networks
  • Graphical models for cyber security analysis in enterprise networks

Examples


Embodiment Construction

[0037]For the purposes of promoting an understanding of the principles of the invention, reference will now be made to the embodiments illustrated in the drawings, which are described below. It will nevertheless be understood that no limitation of the scope of the invention is thereby intended. The invention includes any alterations and further modifications in the illustrated devices and described methods and further applications of the principles of the invention, which would normally occur to one skilled in the art to which the invention relates.

[0038]Instead of using full-scale attack graphs, such as the Carnegie Mellon University attack graph, or deterministic semantics, the subject invention captures the inherent uncertainties among exploit dependencies to provide compact and scalable attack graph models rich in semantics and efficient in computation. The subject invention goes beyond static analysis of attack graphs (which the system is capable of performing), in order to mat...


PUM


Abstract

A method of generating graphical models for providing security analysis in computer networks that in one embodiment includes the steps of generating a type abstract graph independent of particular networks that models abstract dependency relationships among attributes and exploits; generating network-specific attack graphs by combining the type abstract graph with specific network information; monitoring an intruder alert; and generating a real-time attack graph by correlating the intruder alert with the network-specific attack graph. The real-time attack graph can be generated using reachability checking, bridging, and exploit prediction based on consequence alerts and may further include the step of calculating the likelihood of queries using a Bayesian network model. The method may also include the steps of inferring unobserved attacks that may have been missed by intrusion detection sensors, and projecting on which hosts and using what exploits additional intruder attacks may occur. The method may further include the step of comparing alternate actions by computation, wherein the alternate actions include the step of patching some vulnerabilities, and wherein the specific network information includes network topology. The specific network information may also include firewall rules.

Description

[0001]This application claims the benefit of U.S. Provisional Patent Application Ser. No. 61 / 108,883 filed Oct. 28, 2008, the complete disclosure of which is hereby expressly incorporated by reference.[0002]This invention was made with government support under Contract No. W911NF-07-C-0101, awarded by the U.S. Army Research Office, and Contract Nos. FA8750-07-C-0090 and FA8750-08-C-0137, awarded by the U.S. Air Force Research Laboratory. The government has certain rights in the invention.BACKGROUND OF THE INVENTION[0003]This invention relates to the design of graphical models for cyber security, and in particular, to a separation and integration approach of graphical models to protect enterprise networks against intruder attacks.[0004]In enterprise networks, the critical importance of network security and information assurance is a major concern. An enterprise network is a network for a large business or enterprise. It may comprise a number of local area networks that have to interf...

Claims


Application Information

Patent Timeline
Patent Type & Authority Patents(United States)
IPC IPC(8): G06F21/57G06F21/00H04L29/06
CPCH04L63/1408G06F21/577H04L63/1433
Inventor LEVY, RENATOLI, HONGJUNLIU, PENGLYELL, MARGARET
Owner INTELLIGENT AUTOMATION LLC
Why Eureka
Try Eureka