Method for analyzing continuous glucose monitoring data

a monitoring data and data technology, applied in the field of continuous glucose monitoring data analysis, can solve the problems of lack of useful cgms data indicators, inability to easily aggregate data to facilitate treatment group comparisons, and lack of data for analyzing continuous glucose monitoring data, so as to increase determine the susceptibility to symptomatic hypoglycemia

Active Publication Date: 2010-08-03
SANOFI SA
View PDF4 Cites 13 Cited by
  • Summary
  • Abstract
  • Description
  • Claims
  • Application Information

AI Technical Summary

Benefits of technology

[0010]Another aspect of the invention is a method for determining susceptibility to symptomatic hypoglycemia in a patient comprising the steps of: measuring the patient's blood glucose levels continuously for a period of time to obtain blood glucose level data; applying a Fourier approximation to develop a continuous oscillating blood glucose curve approximately representing the blood glucose level data; identifying areas of the curve having steepest descent, the areas of steepest descent corresponding to relative minima of a first derivative of the curve; calculating an arithmetic average of the relative minima; and correlating a high arithmetic average of the relative minima with an increased susceptibility to symptomatic hypoglycemia. This method may further comprise selectively recommending a medication-based therapy on the basis of the arithmetic average of the relative minima.

Problems solved by technology

One problem with the blood glucose level data obtained from continuous glucose monitoring systems is that there is a lot of variability in the data.
Because of the lack of accurate diary data from patients and the lack of mealtime synchronization, another problem with CGMS data is the inability to aggregate the data easily to facilitate treatment group comparisons and to visualize the average treatment group curves.
As a result of the problems indicated above, a further problem is the lack of CGMS data indicators that would be useful for diagnosing and treating hypoglycemia and diabetes.

Method used


Image

  • Method for analyzing continuous glucose monitoring data
  • Method for analyzing continuous glucose monitoring data
  • Method for analyzing continuous glucose monitoring data

Examples


example 1

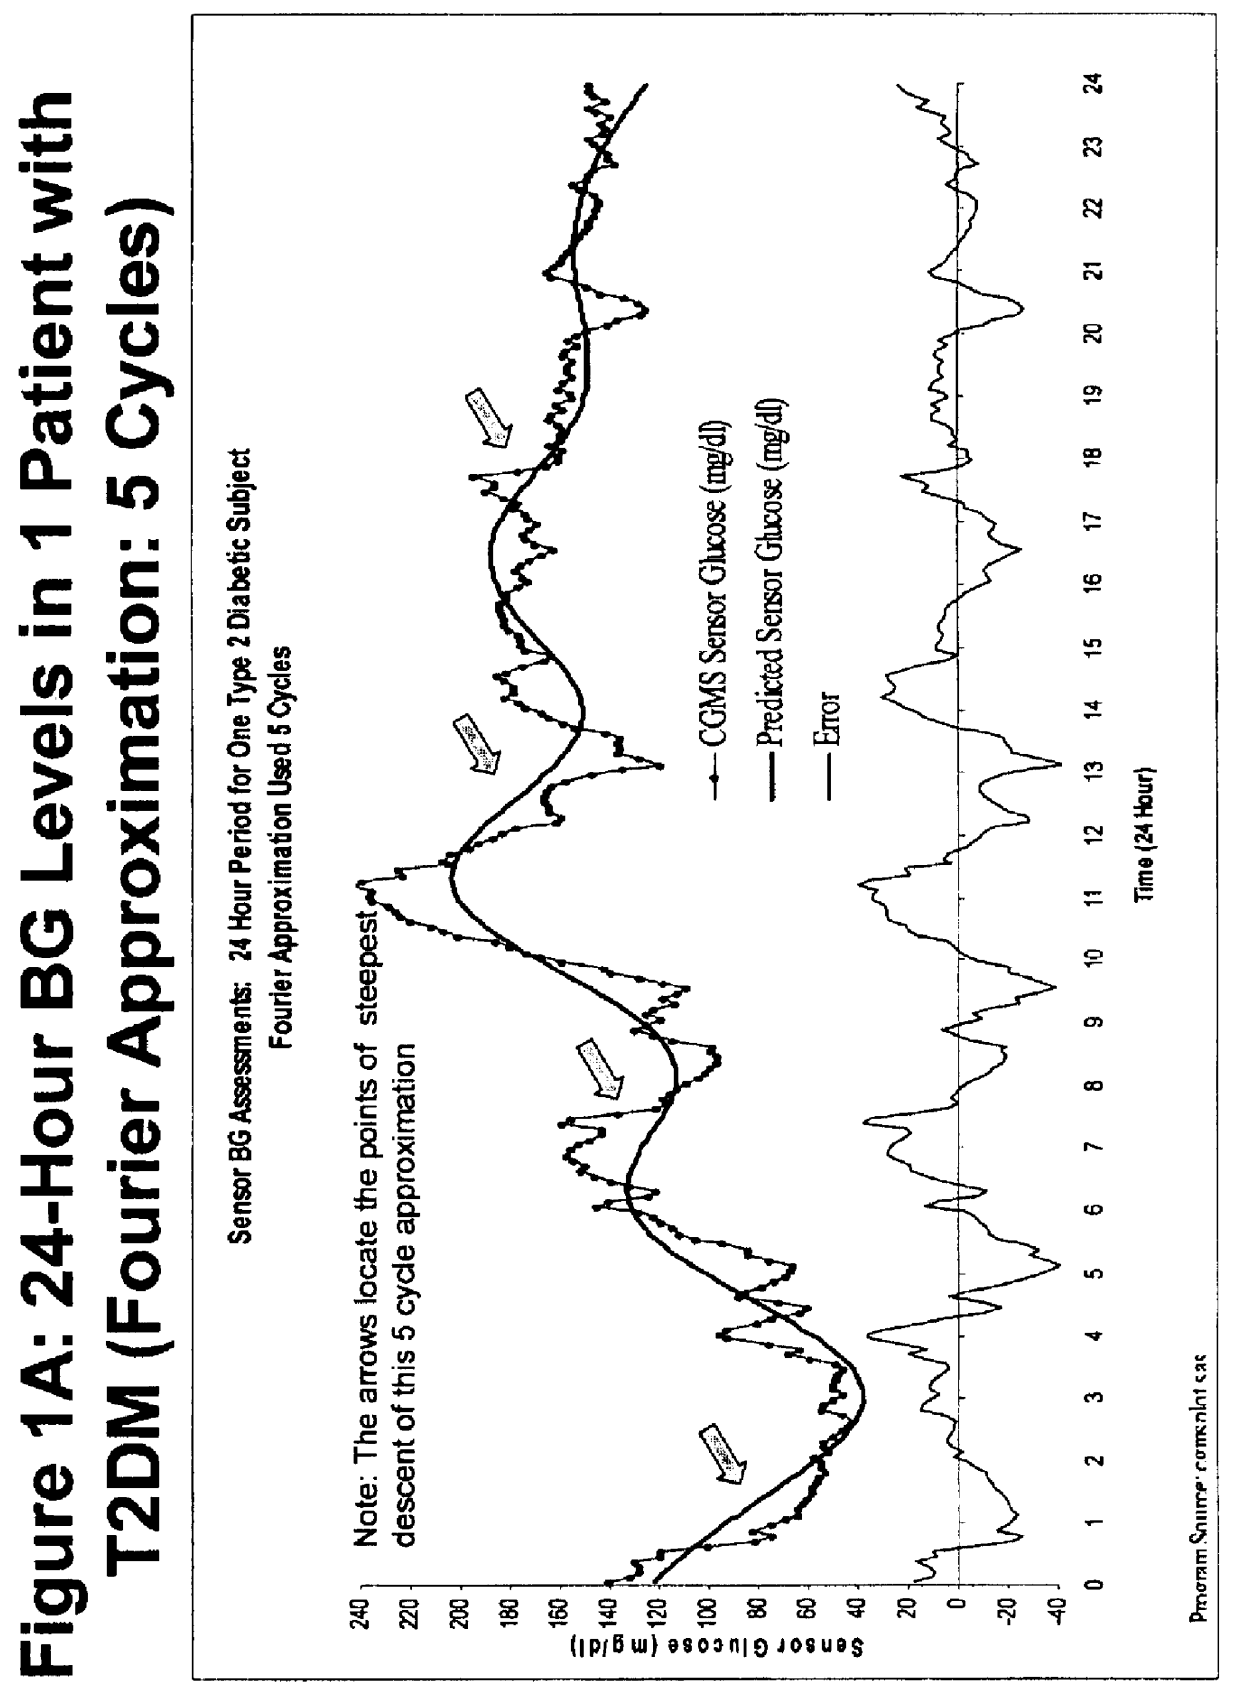
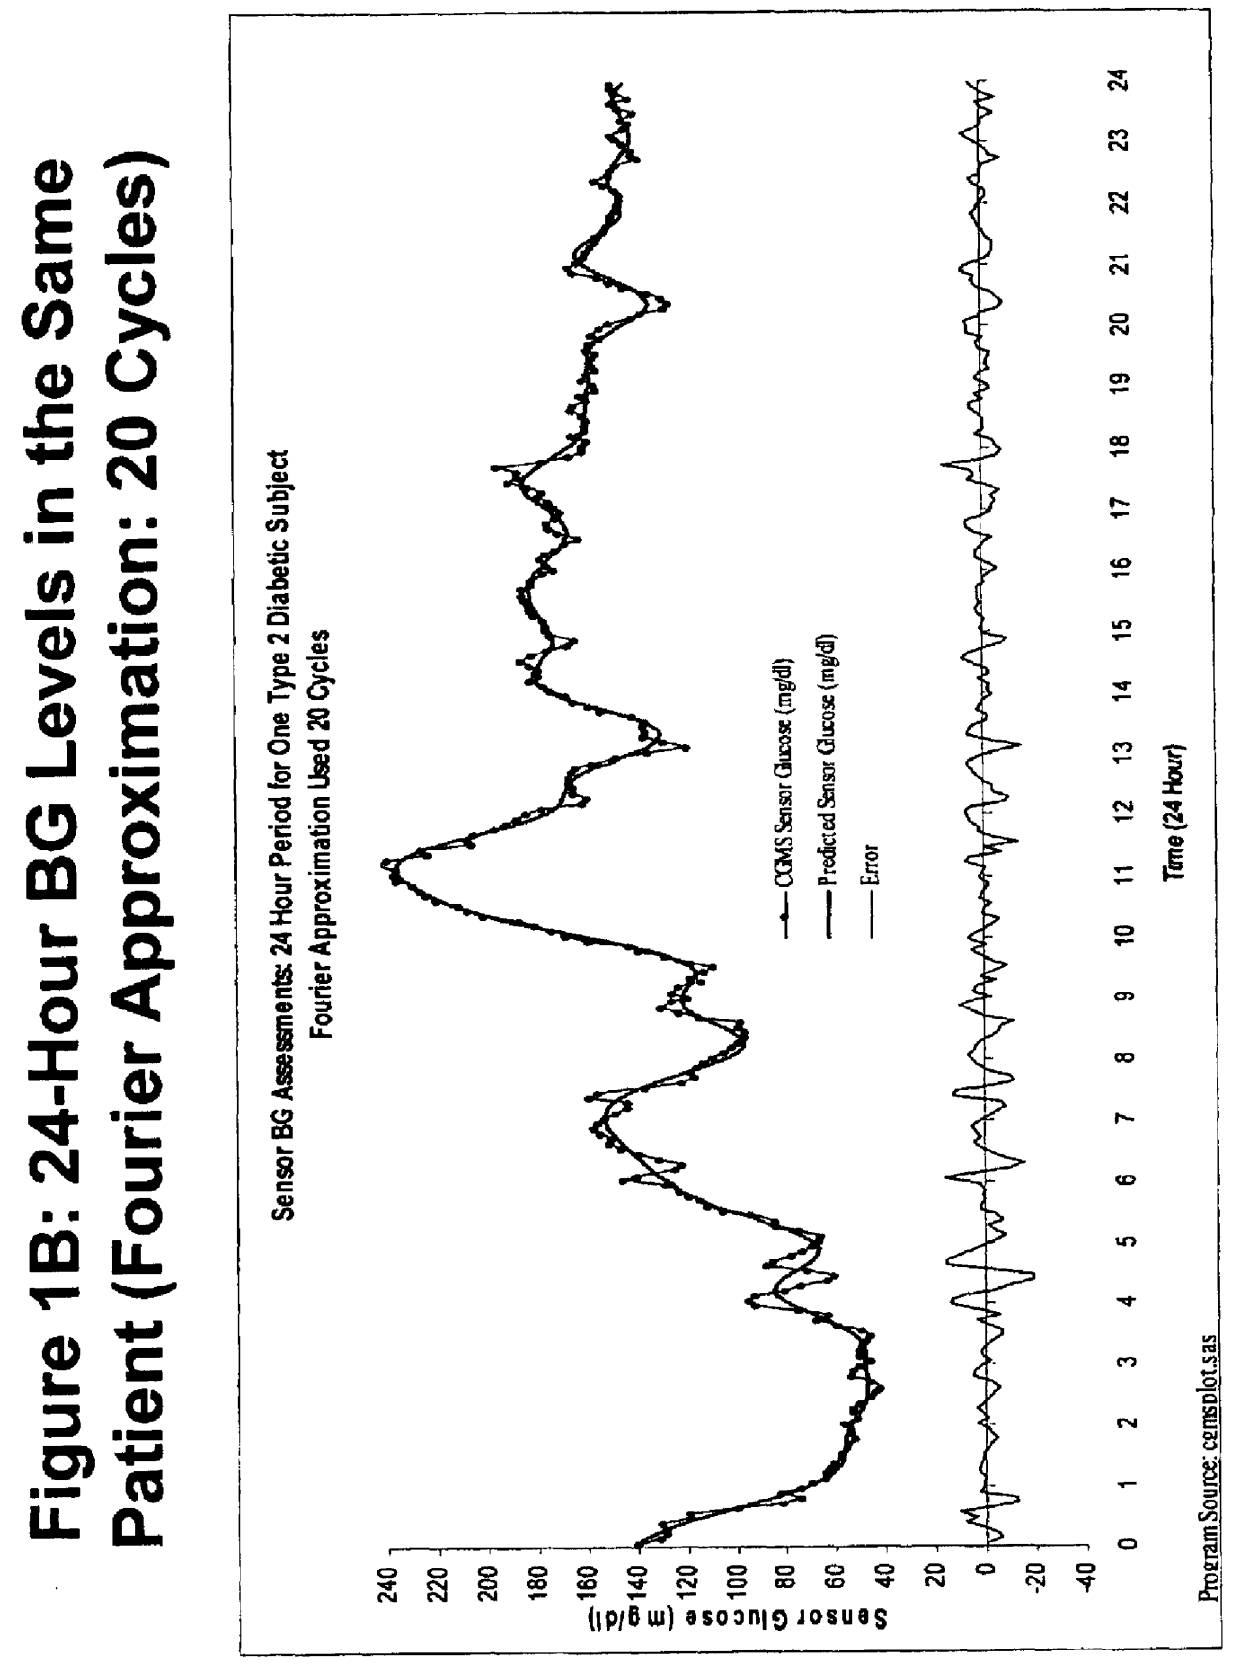
[0023]A Fourier approximation is applied to the observed CGMS blood glucose data for one patient with type 2 diabetes mellitus. FIG. 1A shows a Fourier approximation of the CGMS data using five cycles calculated as described above. FIG. 1B shows a Fourier approximation of the same data using twenty cycles. As seen in the FIGS. 1A and 1B, the Fourier approximations tend to smooth out the high-frequency noise observed in the raw CGMS data. As one increases the number of cycles, the Fourier approximation does a better job of approximating the actual CGMS data as shown by the decrease in the fluctuation of the error graph in FIG. 1B as compared to FIG. 1A. As one increases the number of cycles, however, the smoothness of the Fourier approximation curve is decreased, resulting in a curve that is less likely to be useful in identifying prognostic indicators.

example 2

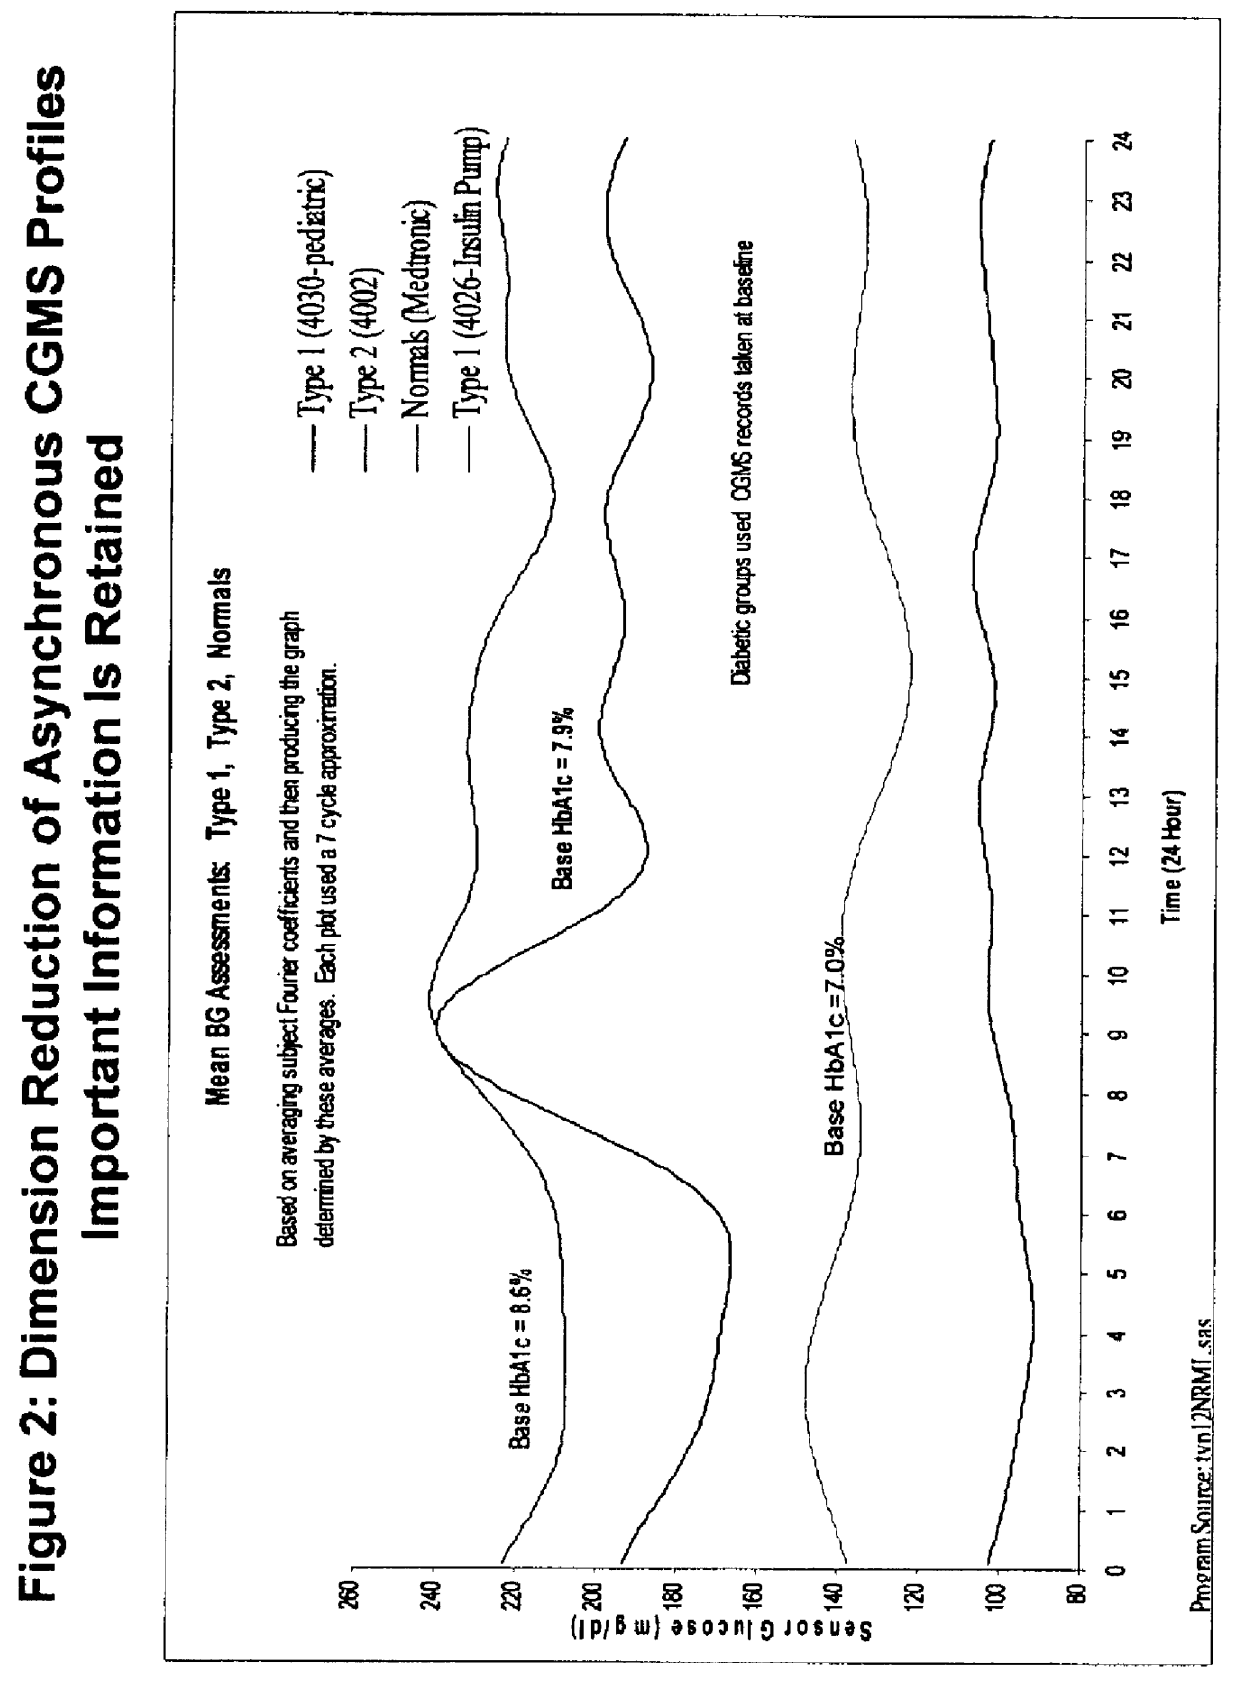
[0024]This study employs CGMS 24-hour blood glucose profiles from the following patient populations:[0025]pediatric patients with type 1 diabetes mellitus (T1DM), N=90;[0026]adult patients with type 2 diabetes mellitus (T2DM), N=34;[0027]normal subjects, N=15; and[0028]patients with T1DM using an insulin pump, N=37.

[0029]For each subject, a seven cycle Fourier approximation is applied to twenty-four hour CGMS data. An aggregate curve is created for each patient population by averaging the subject Fourier coefficients and producing a graph determined by these averages. FIG. 2 shows the resulting graphs for each patient population. An interesting observation is that insulin-pump therapy not only reduces the average blood glucose levels but also reduces the amplitude of the resulting aggregate Fourier approximation. This indicates that type 1 patients using the insulin pump are less likely to experience hypoglycemic and hyperglycemic events.

example 3

[0030]This study employs CGMS 24-hour blood glucose profiles from the pediatric patients with type 1 diabetes mellitus (T1DM), N=90; half of the patients are on a typical insulin therapy regimen while half of the patients are using Lantus®. For each subject, a Fourier approximation is applied to twenty-four hour CGMS data. An aggregate curve is created for the patient population by averaging the subject Fourier coefficients and producing a graph determined by these averages. The Fourier approximation is decomposed into its component harmonics. FIG. 3 shows the resulting graph of the mean blood glucose levels from the patient population along with the first, the sum of the second and third, and the sum of the fourth and higher harmonic functions of the aggregate Fourier approximation.

[0031]FIG. 4 shows a graph of week twenty-four HbA1c levels versus the mean baseline amplitude of the sum of the second and third harmonic functions of a Fourier approximation. HbA1c is a specific subtyp...


PUM


Abstract

A method for predicting the effectiveness of medication-based therapy in lowering average blood glucose levels in a diabetic patient is provided. This method may further comprise selectively recommending a medication-based therapy on the basis of the arithmetic average of the relative minima. A method for determining susceptibility to symptomatic hypoglycemia in a patient is provided. This method may further comprise selectively recommending a medication-based therapy on the basis of the arithmetic average of the relative minima. Provided also is a device for continuously monitoring blood glucose levels in a patient. The methods and device involve applying a Fourier approximation to blood glucose level data.

Description

CROSS REFERENCE TO RELATED APPLICATIONS[0001]This application is related to U.S. application Ser. No. 60 / 863,673, filed Oct. 31, 2006, the entire disclosure of which is hereby incorporated herein by reference.FIELD OF INVENTION[0002]The present invention relates, generally, to methods for analyzing continuous glucose monitoring data. More specifically, the invention relates to methods for determining a patient's susceptibility to hypoglycemic events and methods for predicting the effectiveness of insulin therapy in lowering average blood glucose levels in a diabetic patient.BACKGROUND OF INVENTION[0003]Diabetics must monitor their own blood glucose levels, often several times a day, to determine how far above or below a normal level their glucose level is and to determine what oral medications or insulin(s) they may need. This is often done by placing a drop of blood from a skin prick onto a glucose strip and then inserting the strip into a glucose meter, which is a small machine th...

Claims


Application Information

Patent Timeline
Patent Type & Authority Patents(United States)
IPC IPC(8): A61B5/00
CPCA61B5/14532A61B5/4848A61B5/7275G16H50/50
Inventor MILLER, MICHAEL FRANKLINSTRANGE, POUL
Owner SANOFI SA
Why Eureka
Try Eureka