
Multi-behavior process monitoring method based on pivot analysis and vectorial data description support
A data description, support vector technology, applied in the direction of comprehensive factory control, comprehensive factory control, electrical program control, etc., can solve the problems of false alarms and omissions in the transition part of working conditions, large amount of calculation, decreased sensitivity of process changes, etc. The effect of tightening statistical limits, troubleshooting, and increasing sensitivity
- Summary
- Abstract
- Description
- Claims
- Application Information
AI Technical Summary
Problems solved by technology
Method used
Image

Examples
Embodiment Construction
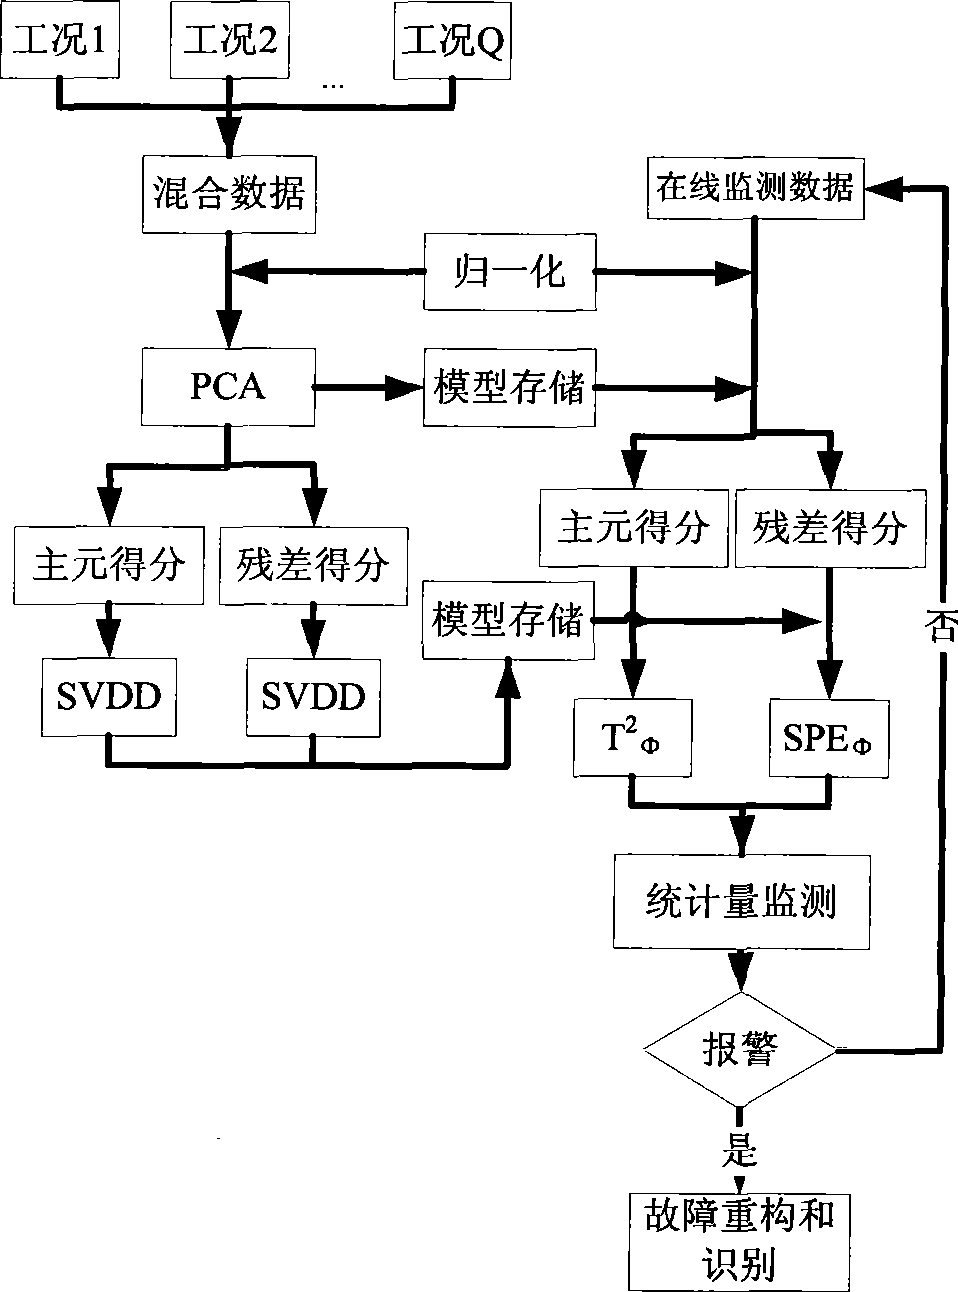
[0018] The present invention aims at the problem of multi-working conditions in industrial process monitoring. First, a unified principal component analysis (PCA) statistical monitoring model is established by using all normal working condition data, which is used for information extraction and dimensionality reduction of process data, and the PCA statistical model structured as X = TP T + T ~ P ~ T = TP T + E , where X is the process data matrix, T, P are the principal component score and loading matrices, is the residual score and loading matrix, E is the residual matrix, and the number of principal components of PCA can be selected by cross-validation method or cumulative variance contribution rate (CPV) method. The principal compo...
PUM
 Abstract
Description
Claims
Application Information