Digital graphic technology-based method and device for analyzing leaf area

A technology of blade area and analysis method, which is applied in the direction of measuring device, optical device, instrument, etc., can solve the problems that the measurement result is easily affected by the external environment, the measuring instrument is expensive, and the maintenance is difficult, etc., so as to achieve simple structure and low workload. Small, easy-to-collect effects

Inactive Publication Date: 2010-05-26
SHANXI AGRI UNIV +1
View PDF0 Cites 16 Cited by
  • Summary
  • Abstract
  • Description
  • Claims
  • Application Information

AI Technical Summary

Problems solved by technology

[0018] Although the measurement is relatively fast, the measurement results are easily affected by the external environment, the stability is poor, and the photoelectric leaf area measuring instrument is expensive and difficult to maintain

Method used


Image

  • Digital graphic technology-based method and device for analyzing leaf area
  • Digital graphic technology-based method and device for analyzing leaf area
  • Digital graphic technology-based method and device for analyzing leaf area

Examples


Embodiment 1

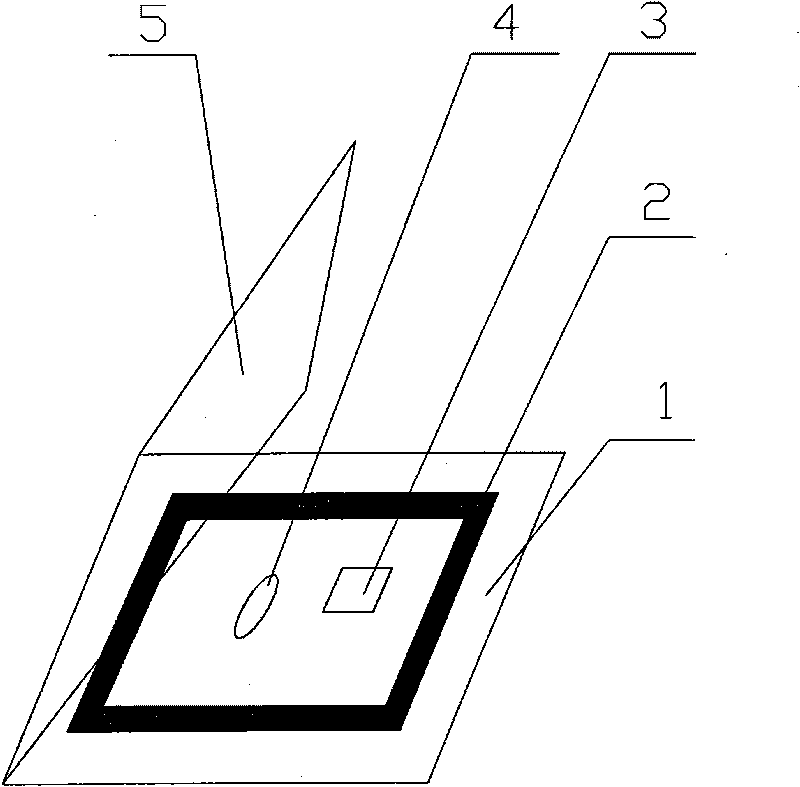
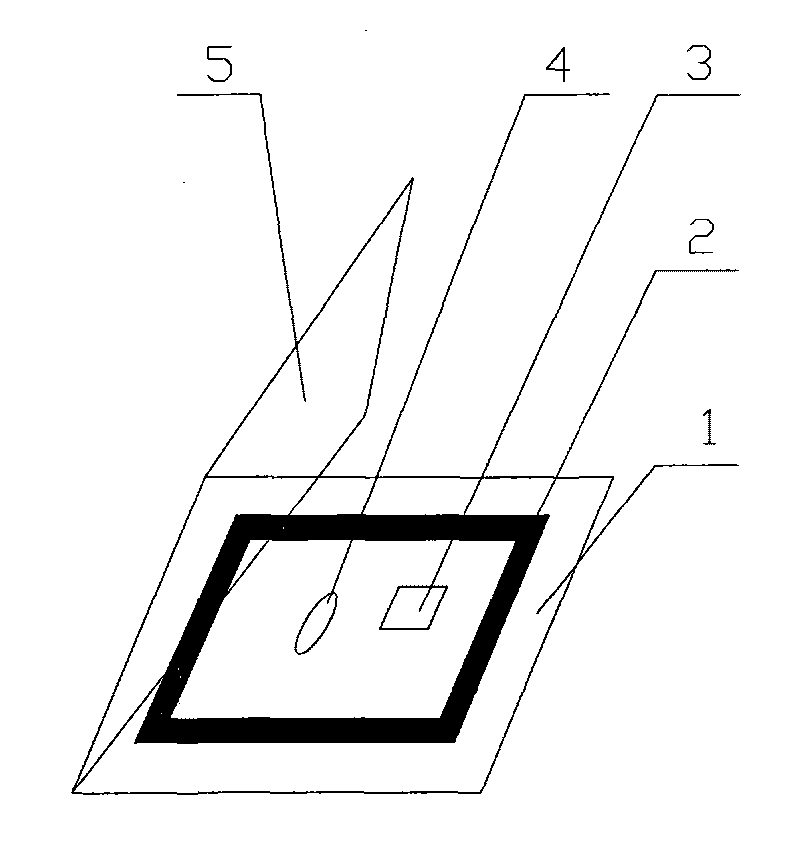
[0042] A blade area analysis device based on digital image technology such as figure 1 As shown, it includes a measuring plate 1 with a size of 10 cm×10 cm, and a transparent plastic sheet 5 with a size of 10 cm×10 cm that is movably connected to one side of the measuring plate.

[0043] There is a circular red measuring band 2 with a diameter of 8 cm on the measuring plate 1; a yellow calibration object 3 with an area of ​​2 cm × 2 cm is arranged in the measuring band 2, and the area of ​​the calibration object 3 is the same as the measured area. Alfalfa leaves are similar in size.

[0044] The measured alfalfa leaf 4 is placed at a position adjacent to the calibration object 3 in the measurement zone 2 for imaging, and a h×w digital photo including the measured alfalfa leaf is obtained.

[0045] Read the RGB value of the color mode for measuring the reddish color, the RGB value of the color mode for the yellow color of the calibration object, and the RGB value of the color ...

Embodiment 2

[0053] The leaf area analysis device comprises a measurement board 1 with a size of 15cm×15cm, and a transparent plastic sheet 5 with a size of 15cm×15cm movably connected to one side of the measurement board.

[0054] On the measurement plate 1, there is a square yellow measuring band 2 with a side length of 13 cm; a blue calibration object 3 with an area of ​​5 cm × 5 cm is arranged in the measurement band 2, and the area of ​​the calibration object 3 is the same as the measured area. Soybean leaves are similar in size.

[0055] The measured soybean leaf 4 is placed at a position adjacent to the calibration object 3 in the measurement zone 2 for imaging, and a digital photo including h×w of the measured soybean leaf is acquired.

[0056] Read the color mode RGB value of the measured yellowish color mode, the color mode RGB value of the blue color of the calibration object, and the color mode RGB value of the green color of the measured soybean leaf, and assign it to the imag...

Embodiment 3

[0063] The leaf area analysis device comprises a measurement board 1 with a size of 35cm×35cm, and a transparent plastic sheet 5 with a size of 35cm×35cm movably connected to one side of the measurement board.

[0064] There is a square blue color measurement band 2 with a side length of 33 cm on the measurement plate 1; a purple color calibration object 3 with an area of ​​10 cm × 10 cm is arranged in the measurement band 2, and the area of ​​the calibration object 3 is the same as the measured area. Grape leaves are similar in size.

[0065] Place the grape leaf 4 under test at a position adjacent to the calibration object 3 in the measurement zone 2 for imaging, and obtain a digital photo including h×w of the grape leaf under test.

[0066] Read the color mode RGB value of the measured bluish color, the color mode RGB value of the purple color of the calibration object, and the color mode RGB value of the green color of the grape leaf under test, and assign it to the image ...


PUM


Abstract

The invention discloses a digital graphic technology-based method and a digital graphic technology-based device for analyzing a leaf area. The method comprises the following steps: circling an enclosed measurement area with a color on a measurement plate, and taking the region in the measurement area as a measurement region; marking a calibration object with known area in the measurement region; distinguishing the color of the measurement area, the color of the calibration object and the color of a leaf to be measured; putting the leaf to be measured near the calibration object in the measurement region for imaging to acquire a complete digital photo of the measurement region; reading RGB values of color models of the color of the measurement area, the color of the calibration object and the color of the leaf to be measured; and traversing the digital photo image, and according to the calibration object and the leaf to be measured marked by the RGB values, counting pixels occupied by the calibration object and the leaf to be measured in the digital photo and calculating the area of the leaf to be measured. The leaf area analysis method can quickly complete image analysis of a plurality of leaves to be measured at one time; and the measurement accuracy is high and the subsequent workload is small.

Description

technical field [0001] The invention relates to a method for analyzing blade area, in particular to a method for analyzing blade area based on digital image technology. The invention also relates to a blade area analysis device used in the analysis method. Background technique [0002] Leaf is an important organ for photosynthesis and synthesis of organic matter in vegetation. The size of leaf area is an important indicator to measure the growth status of plant population and light energy utilization rate. Appropriate leaf area index provides a theoretical basis for reasonable dense planting and high yield. Accurate measurement of leaf Area is also a prerequisite for establishing a plant growth model. Therefore, how to measure leaf area easily, quickly, accurately, and non-destructively is of great significance in modern agricultural production practice and in establishing digital growth models of plants. There are mainly two methods for measuring leaf area: destructive an...

Claims


Application Information

Patent Timeline
Patent Type & Authority Applications(China)
IPC IPC(8): G01B11/28
Inventor 张吴平刘建宁石永红端允
Owner SHANXI AGRI UNIV
Why Eureka
Try Eureka