Method for displaying evaluation data of nuclear radiation aftermath

A technology of data display and consequences, applied in electrical digital data processing, special data processing applications, measuring devices, etc., can solve the problems of slow display speed, unrealistic effect, lack of dynamic display of meteorological data and radiation monitoring data around the power station, etc. Achieve fast, realistic results

Active Publication Date: 2010-06-09
CHINA TECHENERGY
View PDF0 Cites 33 Cited by
  • Summary
  • Abstract
  • Description
  • Claims
  • Application Information

AI Technical Summary

Problems solved by technology

[0005] However, the functions realized by the Tianwan rapid evaluation system are relatively simple. The rapid evaluation calculation is only carried out for the Tianwan Nuclear Power Plant, and it can only display atmospheric diffusion, dose and intervention actions.
Atmospheric diffusion is mainly used to display the air time-integrated concentration, ground dry deposition concentration and ground wet deposition concentration of the selected nuclide during calculation; the dose is displayed for the inhalation dose results of the two effective organs and the thyroid gland; intervention actions It is used to display the evacuation area, concealment area and deterministic effect area; the display method is to use gradient colors to indicate the numerical value on the 41×41 grid around the nuclear power plant. The above display system can only display the geographic information and accident consequences around a certain nuclear power plant Information; the data is only displayed in the form of a grid diagram, the effect is not realistic, and the display speed is slow; there is a lack of visual display of wind speed and direction of the wind field data around the power station; there is a lack of dynamic display of meteorological data and radiation monitoring data around the power station

Method used


Image

  • Method for displaying evaluation data of nuclear radiation aftermath
  • Method for displaying evaluation data of nuclear radiation aftermath

Examples


Embodiment Construction

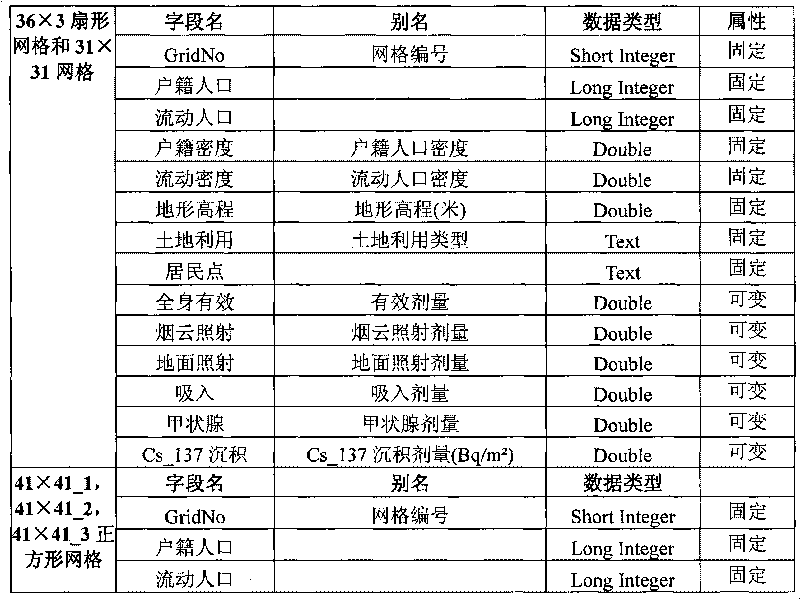
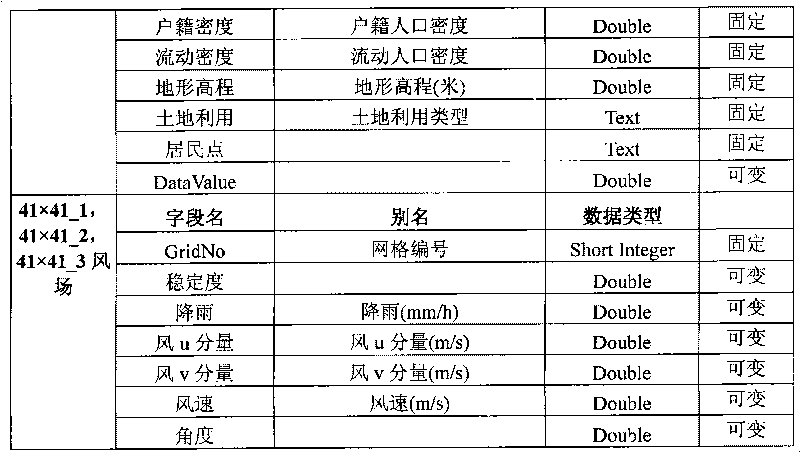
[0020] The invention relates to a method for displaying nuclear radiation consequence evaluation data, which analyzes and calculates the radioactive release source item according to the power plant state of the nuclear power plant, and analyzes the possible accident consequences after the nuclear power plant accident according to the rapid evaluation mode, single module mode and fine evaluation mode Carry out prediction calculations, and write the calculated consequence evaluation results into text files; then classify these text data according to the three modes of rapid evaluation mode, single module mode and fine evaluation mode, and switch at least one of the modes by selecting to switch. The data is written to the grid layer corresponding to the pattern, which is displayed in the form of different colors and / or changing arrows to reflect the possible consequences of an accident at the nuclear power plant.

[0021] According to the method of the present invention, the meteo...


PUM


Abstract

The invention discloses a method for displaying the evaluation data of a nuclear radiation aftermath. A radioactive release source item is analyzed and calculated according to the state of the power plant of a nuclear power station, an accident aftermath which is possibly generated after an accident occurs to the nuclear power station is forecasted and calculated according to a quick evaluation mode, a single-module mode and a fine evaluation mode, and the calculated aftermath evaluation result is written into a text file; then, these text data are respectively classified according to three modes of the quick evaluation mode, the single-module mode and the fine evaluation mode, are written on a corresponding grid chart layer of a selected mode by selecting and switching at least one mode in the three modes and are represented in the form of arrowheads with different colors and/or changes. The invention combines the parameter information of the geography, the population, the weather and the like around the nuclear power station and intuitively reflects the aftermath which is possibly caused after the accident occurs to the nuclear power station.

Description

technical field [0001] The invention relates to a method for evaluating consequences of emergency accidents, in particular to a method for displaying nuclear radiation consequence evaluation data. Background technique [0002] With the rapid development of nuclear energy and nuclear technology applications in China, my country currently has 11 nuclear power units in operation, 17 civilian research reactors in service, and nuclear facilities supporting nuclear power are also at the peak of construction. Nuclear energy occupies an increasingly important position in my country's economy and energy production, and the tasks of nuclear safety and radiation environmental safety management are becoming increasingly heavy. Therefore, it is increasingly urgent to strengthen the emergency management of nuclear accidents, grasp the emergency situation and related information of nuclear accidents in a timely, accurate and comprehensive manner, so as to organize and coordinate the requir...

Claims


Application Information

Patent Timeline
Patent Type & Authority Applications(China)
IPC IPC(8): G01T1/02G01W1/10G06F19/00
Inventor 傅春霞石桂连张宓左新白涛
Owner CHINA TECHENERGY
Why Eureka
Try Eureka