Terahertz polarization real-time imaging method
A real-time imaging, terahertz technology, applied in polarization spectrum, instrument, polarization influence characteristics, etc., can solve the problems of narrow application range and insufficient detection accuracy, and achieve the effect of high-precision identification and wide application range
- Summary
- Abstract
- Description
- Claims
- Application Information
AI Technical Summary
Problems solved by technology
Method used
Image
Examples
Embodiment 1
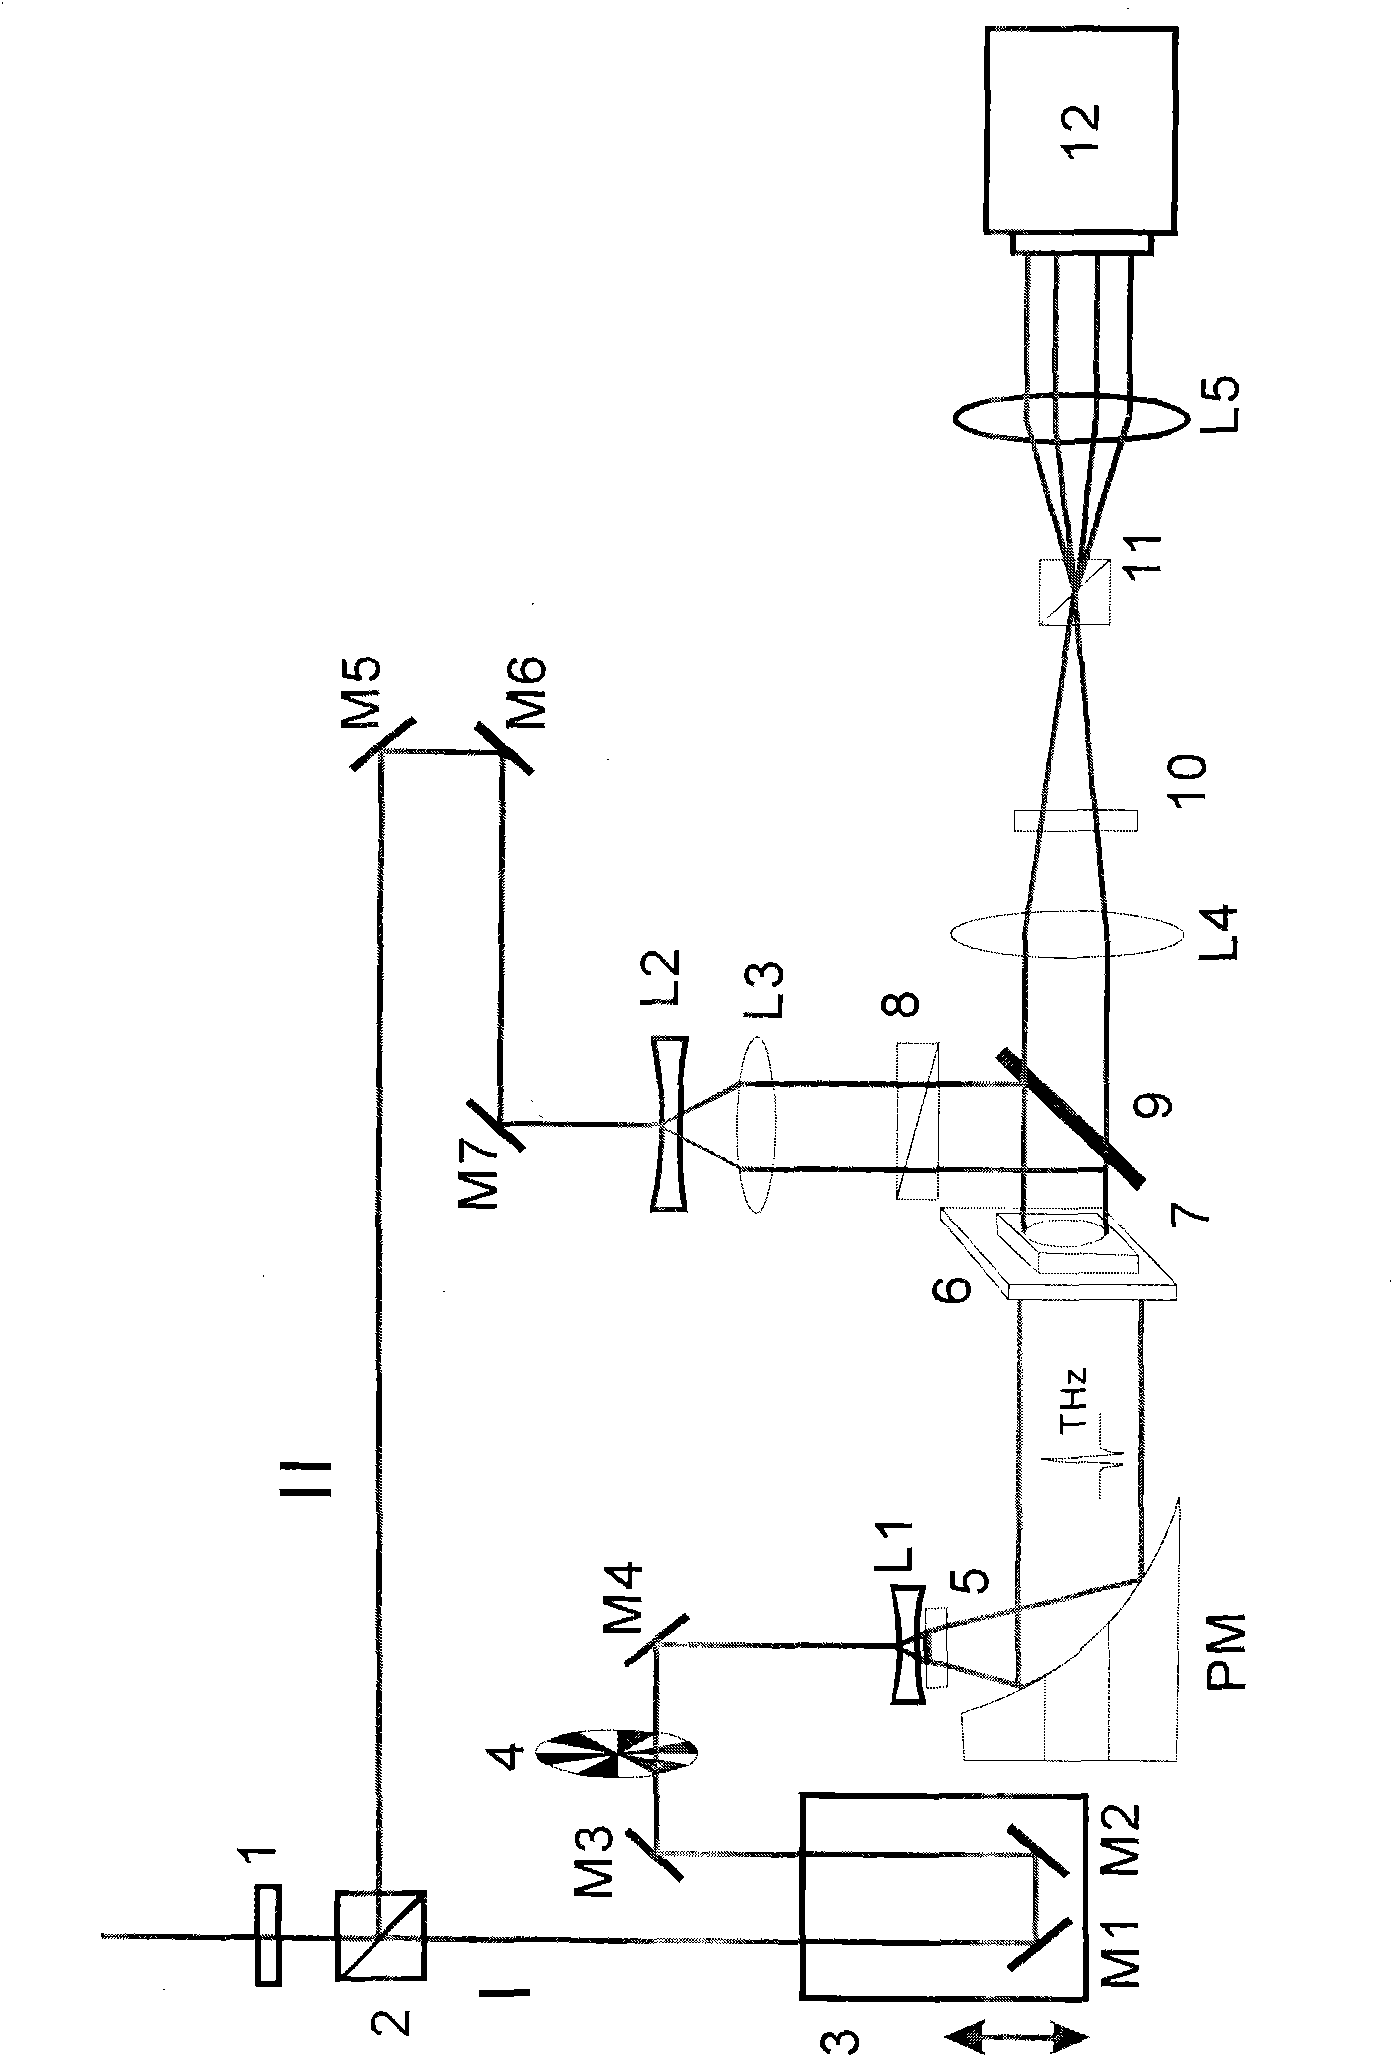
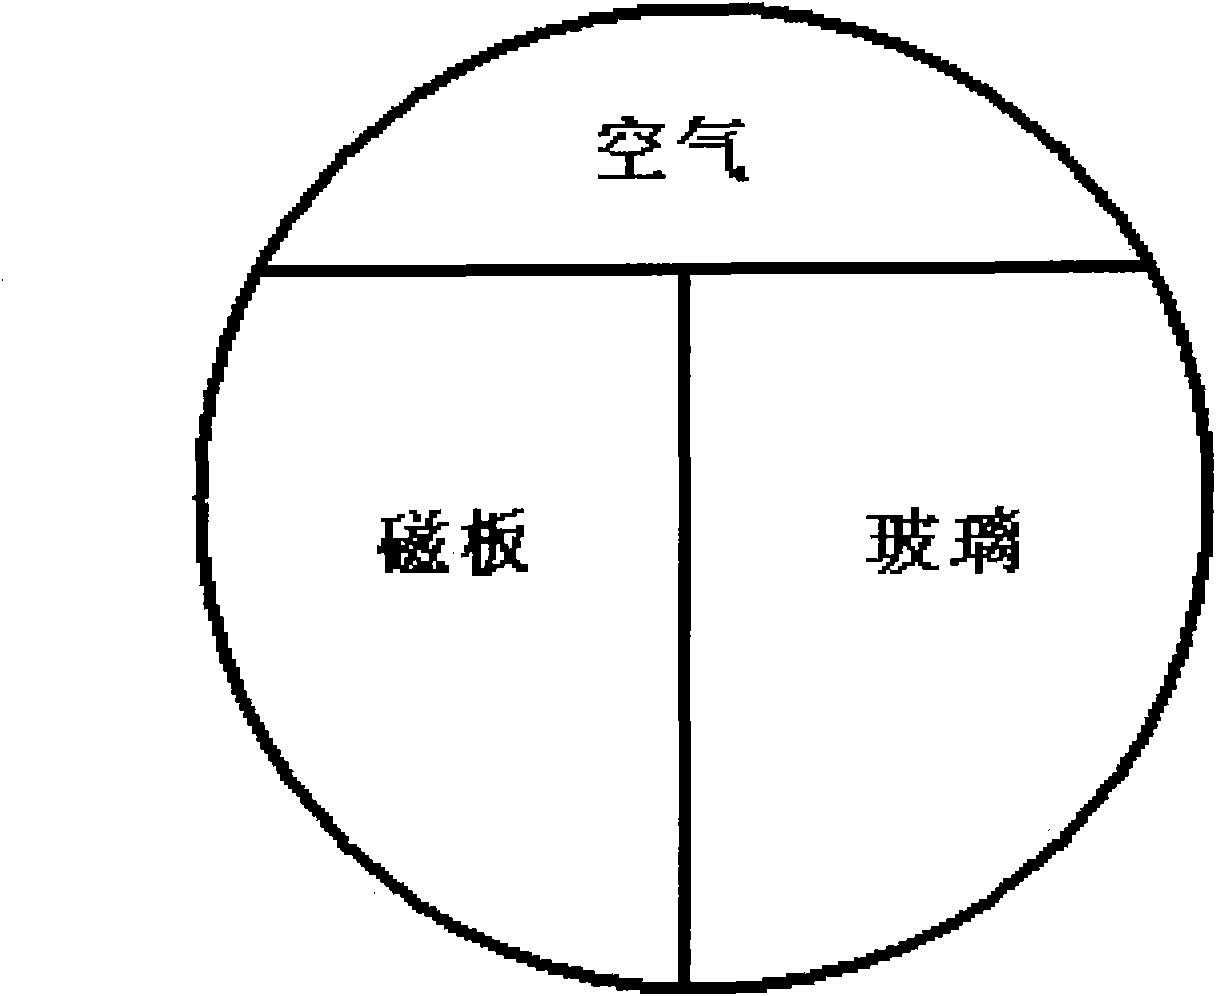
[0072] Select a magnetic plate (thickness is about 2mm) and a glass (thickness is about 2mm) to form a sample, the sample includes magnetic plate part, glass part and air part (such as figure 2 shown). Put the sample into the imaging device, adjust the polarization angle of the probe light by adjusting the half-wave plate 9, measure the horizontal and vertical polarization components of the terahertz pulse respectively, and obtain two sets of time-domain image data sets of the sample.
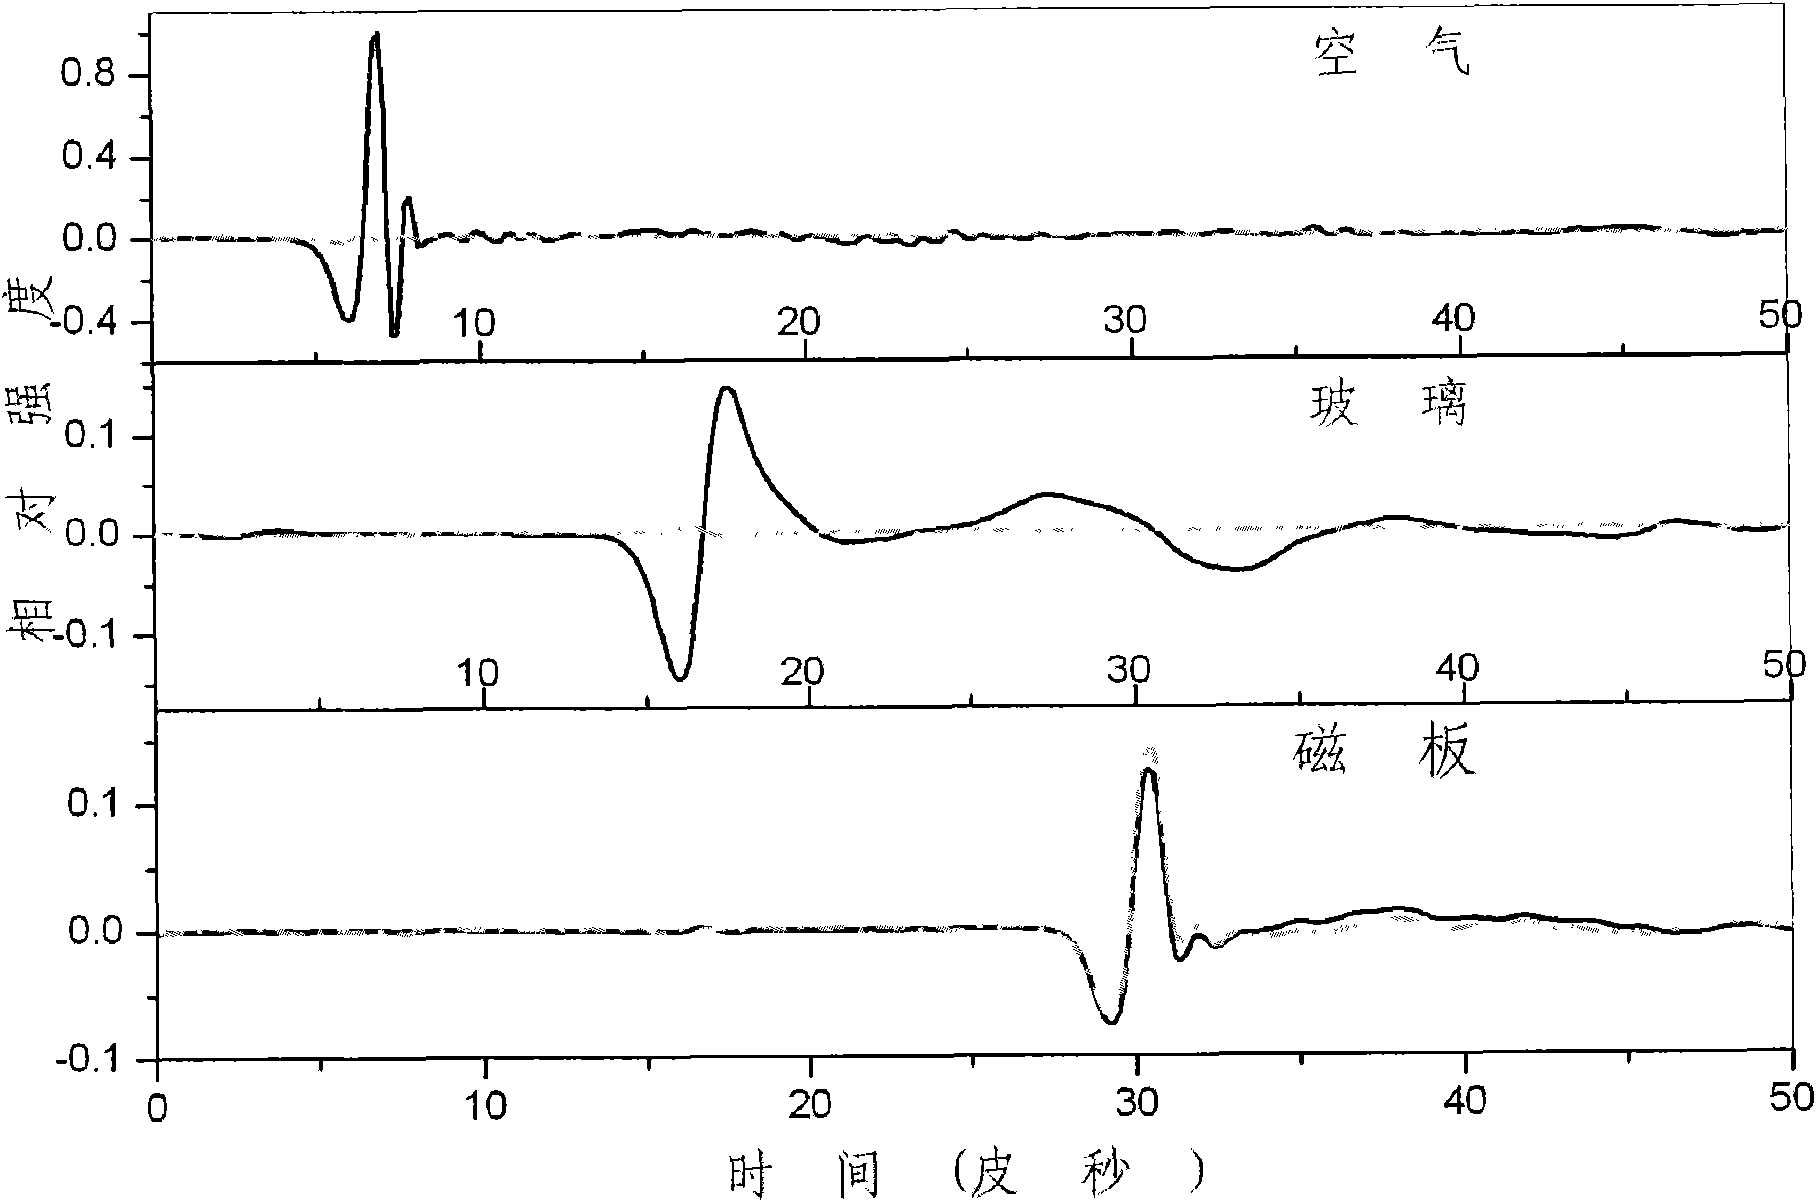
[0073] The corresponding time-domain signal is extracted from each pixel. Such as image 3 As shown, from top to bottom are the spectral line diagrams of air, glass and magnetic plate. The dark solid line represents the horizontal polarization component, and the light dotted line represents the vertical polarization component. The horizontal axis is the time difference obtained by dividing the optical path difference between the pump light and the probe light by the speed of light; the vert...
Embodiment 2
[0077] Choose a quartz crystal (thickness is about 1.7mm) and a quartz glass (thickness is about 1mm), form a sample with the glass in embodiment 1, sample comprises quartz crystal, quartz glass, glass and air part (as Image 6 shown). Put it into the imaging device, measure the horizontal and vertical polarization components of the terahertz pulse respectively, Figure 7 The dark solid line represents the horizontal polarization component, and the light dotted line represents the vertical polarization component. The horizontal axis is the time difference between the pump light and the probe light, and the vertical axis is the relative intensity of the signal.
[0078] Figure 8a with Figure 8b Shown in are the horizontally polarized terahertz image Ex and the vertically polarized terahertz image Ey, respectively. The horizontal axis is the position coordinate, and the vertical axis is the position coordinate. The relative intensity image of the sample is calculated by (...
PUM
| Property | Measurement | Unit |
|---|---|---|
| power | aaaaa | aaaaa |
| thickness | aaaaa | aaaaa |
Abstract
Description
Claims
Application Information
 - R&D
- Intellectual Property
- Life Sciences
- Materials
- Tech Scout
- Unparalleled Data Quality
- Higher Quality Content
- 60% Fewer Hallucinations
Browse by: Latest US Patents, China's latest patents, Technical Efficacy Thesaurus, Application Domain, Technology Topic, Popular Technical Reports.
© 2025 PatSnap. All rights reserved.Legal|Privacy policy|Modern Slavery Act Transparency Statement|Sitemap|About US| Contact US: help@patsnap.com


