Method for measuring small facula intensity distribution based on two-dimension subdivision method
A technology of intensity distribution and measurement method, which is applied in the field of measuring the intensity distribution of tiny light spots, can solve the problems of spot intensity distribution measurement, inability to distribute uneven energy, etc., and achieves the effect of a simple method.
- Summary
- Abstract
- Description
- Claims
- Application Information
AI Technical Summary
Problems solved by technology
Method used
Image
Examples
specific Embodiment approach 1
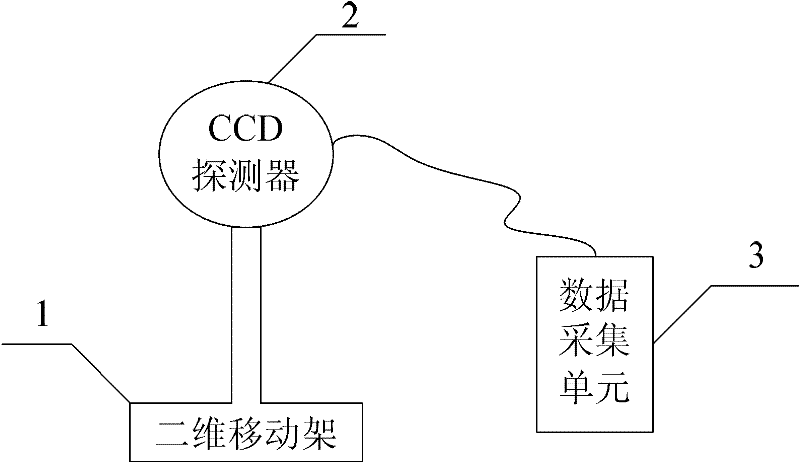
[0017] Specific embodiment one: the tiny spot intensity distribution measurement method based on the two-dimensional subdivision method of the present embodiment is realized based on a spot measuring device, and the spot measuring device is composed of a two-dimensional moving frame 1, a CCD detector 2 and a data acquisition device. Composed of unit 3, the CCD detector 2 is installed on the two-dimensional mobile frame 1, and the electrical signal output end of the CCD detector 2 is connected to the signal input end of the data acquisition unit;
[0018] The specific process of the tiny spot intensity distribution measurement method based on the two-dimensional subdivision method is as follows:
[0019] Step 1. The incident light is incident on the photosensitive detection surface of the CCD detector 2, and the data acquisition unit 3 monitors and displays the grayscale image output by the CCD detector 2 in real time; adjusts the two-dimensional moving frame 1 to make the incid...
specific Embodiment approach 2
[0030] Specific implementation mode two: this implementation mode is a further description of implementation mode one, and the following process is also included in step one:
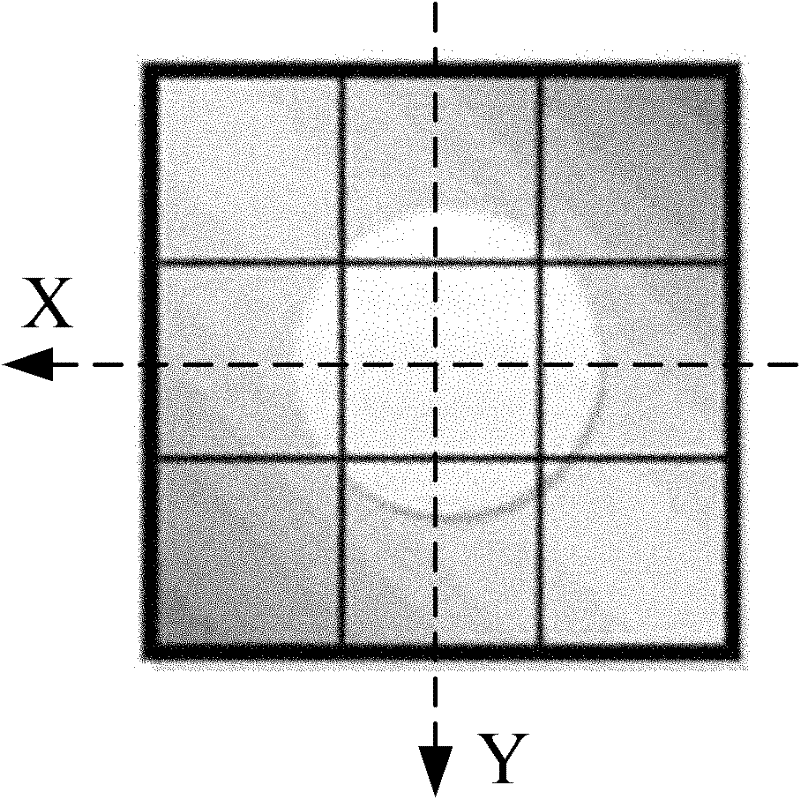
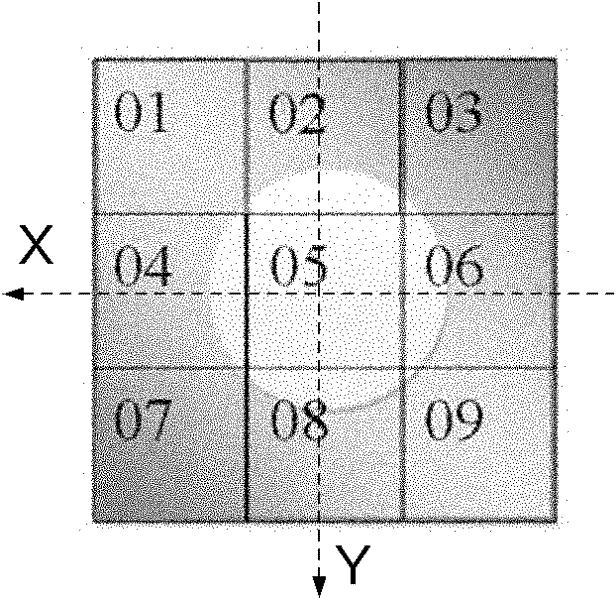
[0031] The photosensitive surface element is divided into M square small blocks along the X-Y direction, that is, the side length of each square small block is parallel to the X axis or the Y axis, and the side length of each small block is d 0 ,D 1 、D 2 Both are d 0 Integer multiples of , then the M square blocks form a matrix, and the number of rows of the matrix is D 2 / d 0 , the number of columns of the matrix is D 1 / d 0 , let Q(i, j) represent the square block in the i-th row and j-th column, where i=1, 2, ..., D 2 / d 0 , j=1,2,...,D 1 / d 0 ; at P 0 position, the gray value measured by the Q(i, j) small block is recorded as Z(i, j).
specific Embodiment approach 3
[0032] Specific implementation mode three: this implementation mode is a further description of implementation mode two, and the specific process of the content described in step eight is:
[0033] According to all the recorded positions and the grayscale images corresponding to each position, the calculation at P 0 The gray value Z(i, j) of each small block Q(i, j) at the position, i=1, 2,..., D 2 / d 0 , j=1,2,...,D 1 / d 0 ; By calibrating the CCD detector 2, the relationship between the gray value and the light intensity measured by the CCD detector 2 is obtained; combined with the obtained P 0 The intensity distribution of the entire spot can be obtained by the gray value Z(i, j) of each small block Q(i, j) at the position.
[0034] Below is a specific embodiment of the application of the present invention:
[0035] Using computer simulation to obtain a low-noise Gaussian distribution of the original spot, see Figure 12 , using the measurement method of the present i...
PUM
 Abstract
Description
Claims
Application Information
 - R&D
- Intellectual Property
- Life Sciences
- Materials
- Tech Scout
- Unparalleled Data Quality
- Higher Quality Content
- 60% Fewer Hallucinations
Browse by: Latest US Patents, China's latest patents, Technical Efficacy Thesaurus, Application Domain, Technology Topic, Popular Technical Reports.
© 2025 PatSnap. All rights reserved.Legal|Privacy policy|Modern Slavery Act Transparency Statement|Sitemap|About US| Contact US: help@patsnap.com


