Resource management method of data center based on statistic model in cloud computing environment
A cloud computing environment and statistical model technology, applied in the direction of resource allocation, multi-programming devices, etc., can solve problems that cannot represent the overall data, cannot handle workload, and resource management is inflexible, so as to ensure accuracy and improve resource supply Efficiency, cost-saving effects
- Summary
- Abstract
- Description
- Claims
- Application Information
AI Technical Summary
Problems solved by technology
Method used
Image

Examples
Embodiment Construction
[0030] In order to make the object, technical solution and advantages of the present invention more clearly, the present invention will be further described in detail below in conjunction with the accompanying drawings and specific embodiments.
[0031] In terms of hardware conditions, the present invention requires each node to support shared storage at the same time. In terms of software conditions, if the operating system uses Linux, its kernel version is required to be above 2.6.18 to avoid defects in power management of low-version kernels.
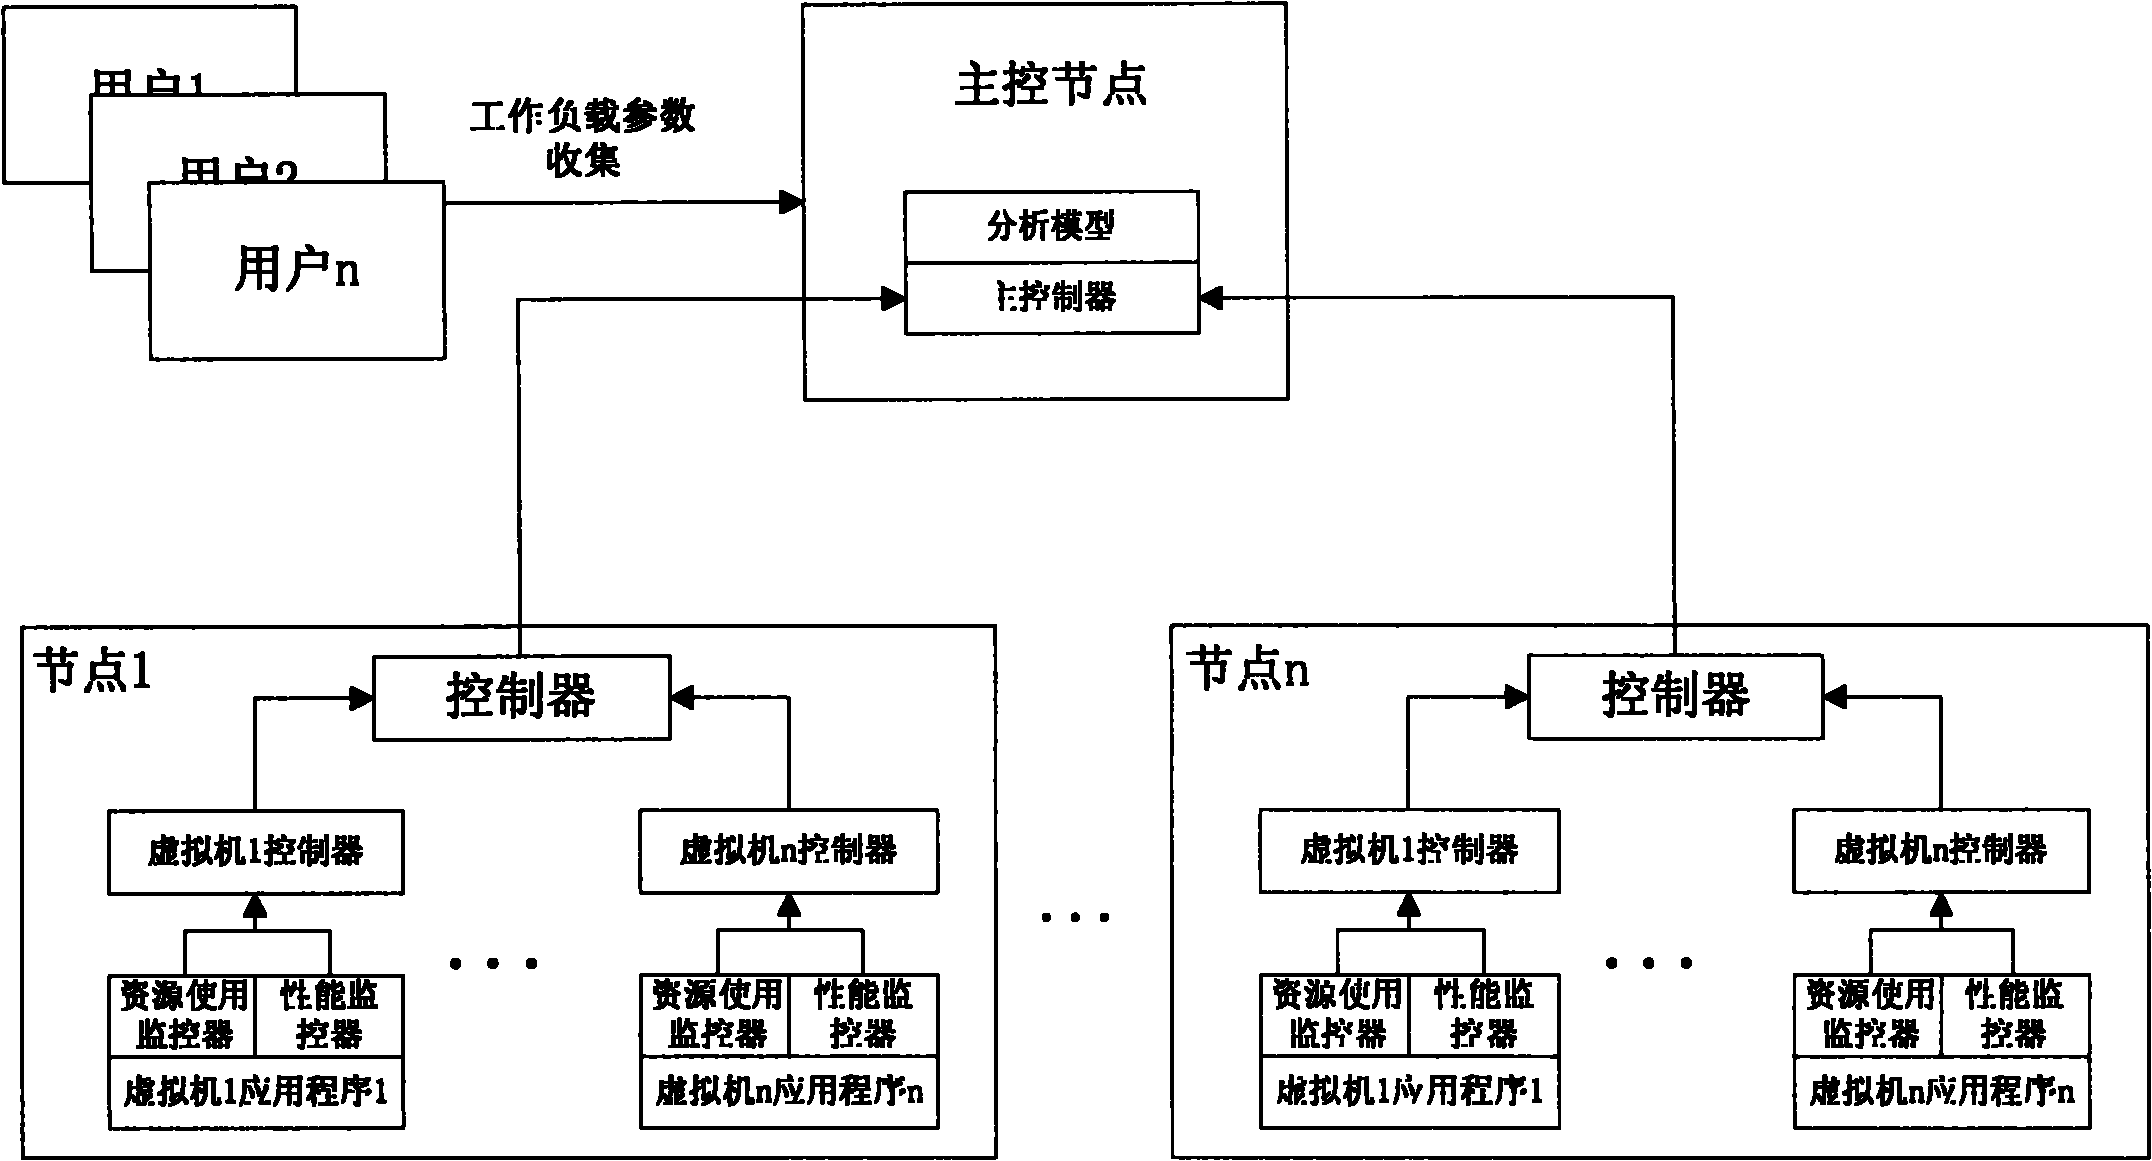
[0032] The equipment condition that the present invention needs to satisfy sees figure 1, the data center infrastructure includes: the master control node is interconnected with the data network through a network adapter, monitors and controls multiple nodes and multiple virtual machines in the node, and the master controller is responsible for unified deployment and management of downstream node controllers, including adding , Dele...
PUM
 Abstract
Description
Claims
Application Information
PatSnap Eureka turns technology decisions into work you can execute. Powered by our Innovation Knowledge Graph, it runs expert workflows across engineering, life sciences, materials and intellectual property. Get your review-ready output in minutes.


