Statistics and measurement method for dynamic quality control early warning coefficient and application thereof

A statistical measurement and quality technology, applied in the direction of data processing application, prediction, calculation, etc., can solve the problems of complicated parameter design and mathematical operation, unacceptable, difficult to overcome false alarms, etc.

Inactive Publication Date: 2012-06-27
吴福平
View PDF0 Cites 9 Cited by
  • Summary
  • Abstract
  • Description
  • Claims
  • Application Information

AI Technical Summary

Problems solved by technology

Since these studies have combined the sample mean and standard deviation on the "shallow surface", on the one hand, it is often difficult to overcome the situation of false alarms; Dragge

Method used


Image

  • Statistics and measurement method for dynamic quality control early warning coefficient and application thereof
  • Statistics and measurement method for dynamic quality control early warning coefficient and application thereof
  • Statistics and measurement method for dynamic quality control early warning coefficient and application thereof

Examples


Embodiment 1

[0062] Taking a steel plate with a thickness of 6±0.40 (mm) produced by a rolling mill as an example, the drawing steps for making a "CV dynamic quality control table" are as follows:

[0063] (1) Collect data. Collect recent production data (Table 2 extracts the statistical data of 5 samples of each of the 25 groups of products).

[0064] (2) Calculate the average value, standard deviation, coefficient of dispersion (CV), quality index (PQI), comparative quality index (C_PQI), etc. of each sample.

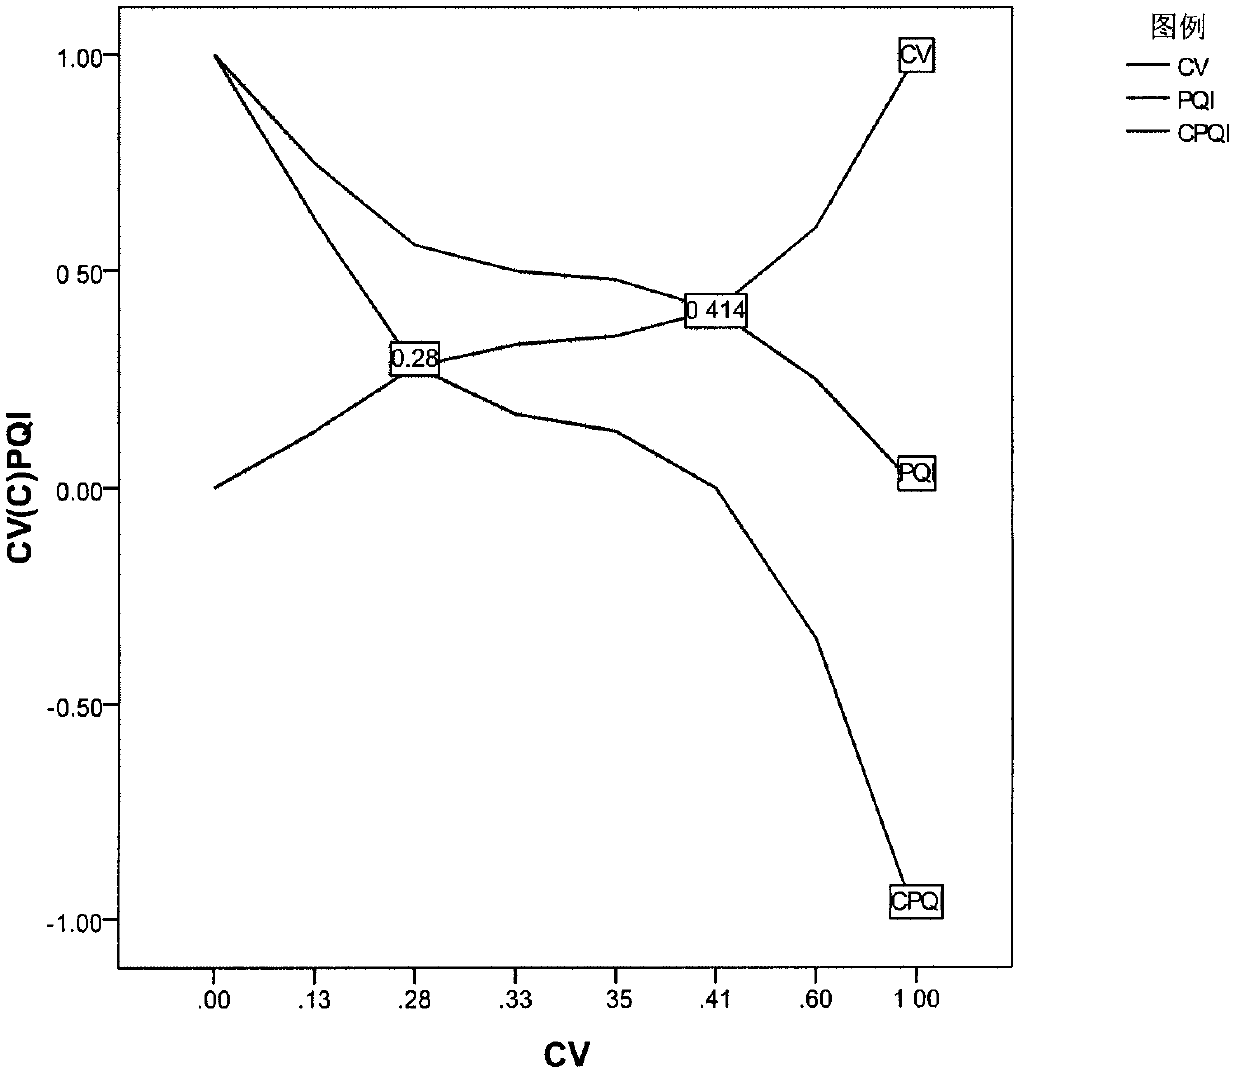
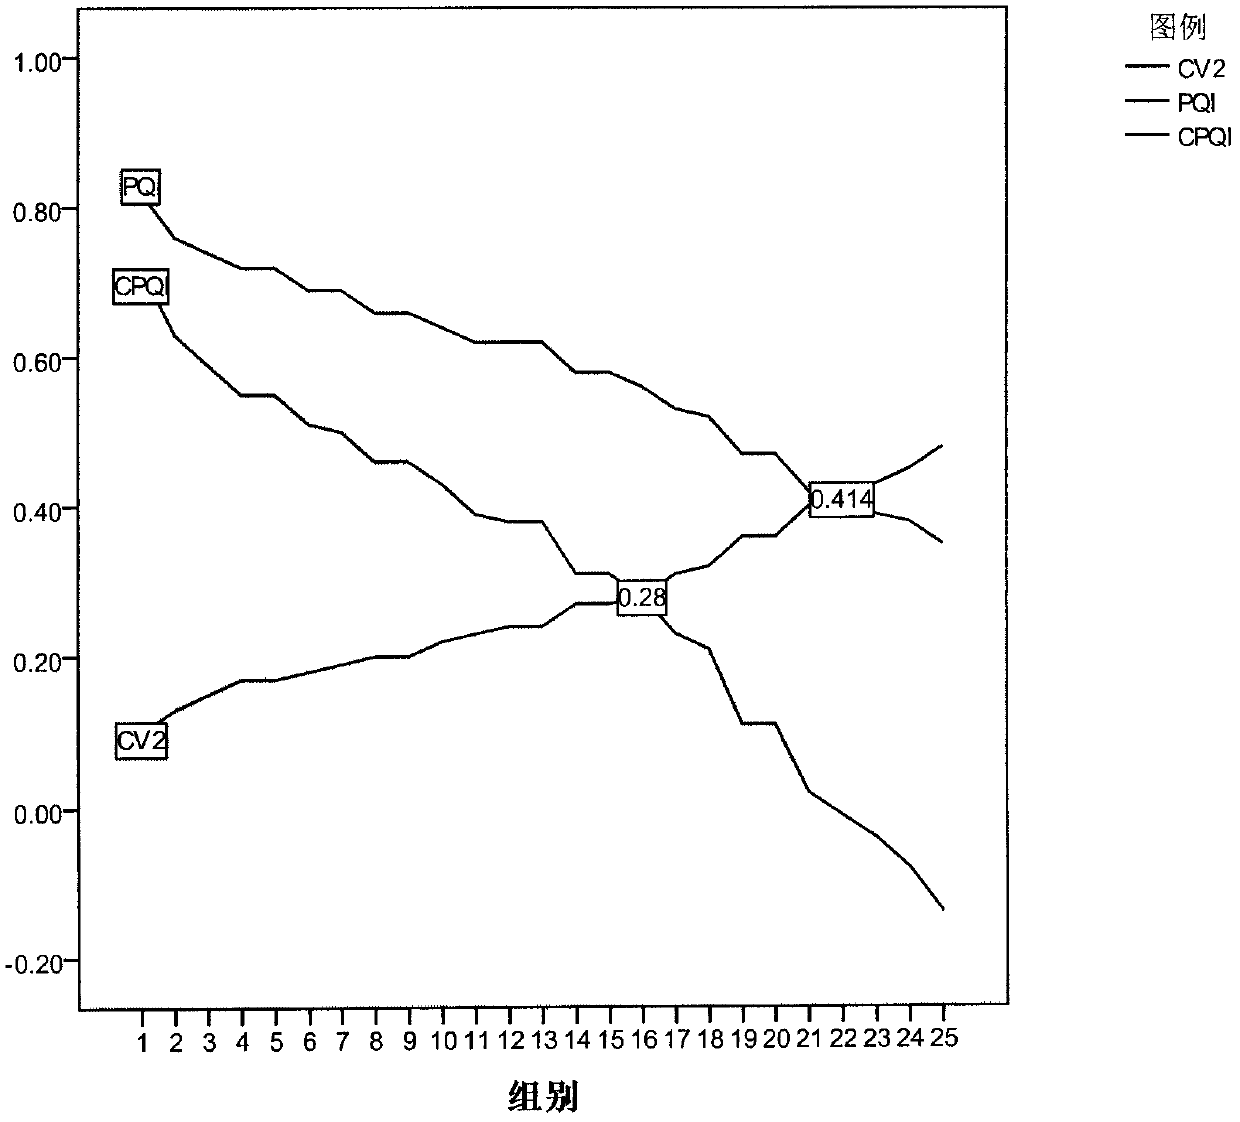
[0065](3) Draw a CV dynamic quality control table and a CV dynamic quality control curve.

[0066] (4) Analysis of CV dynamic quality control table and CV dynamic quality control curve.

[0067] Table 2 CV dynamic quality control data of a rolling mill

[0068]

[0069] Table 2 is based on the statistical results of 25 groups of product samples of steel plates with a thickness of 6±0.40 (mm) produced by a rolling mill, figure 2 is the CV dynamic quality control curve drawn...

Embodiment 2

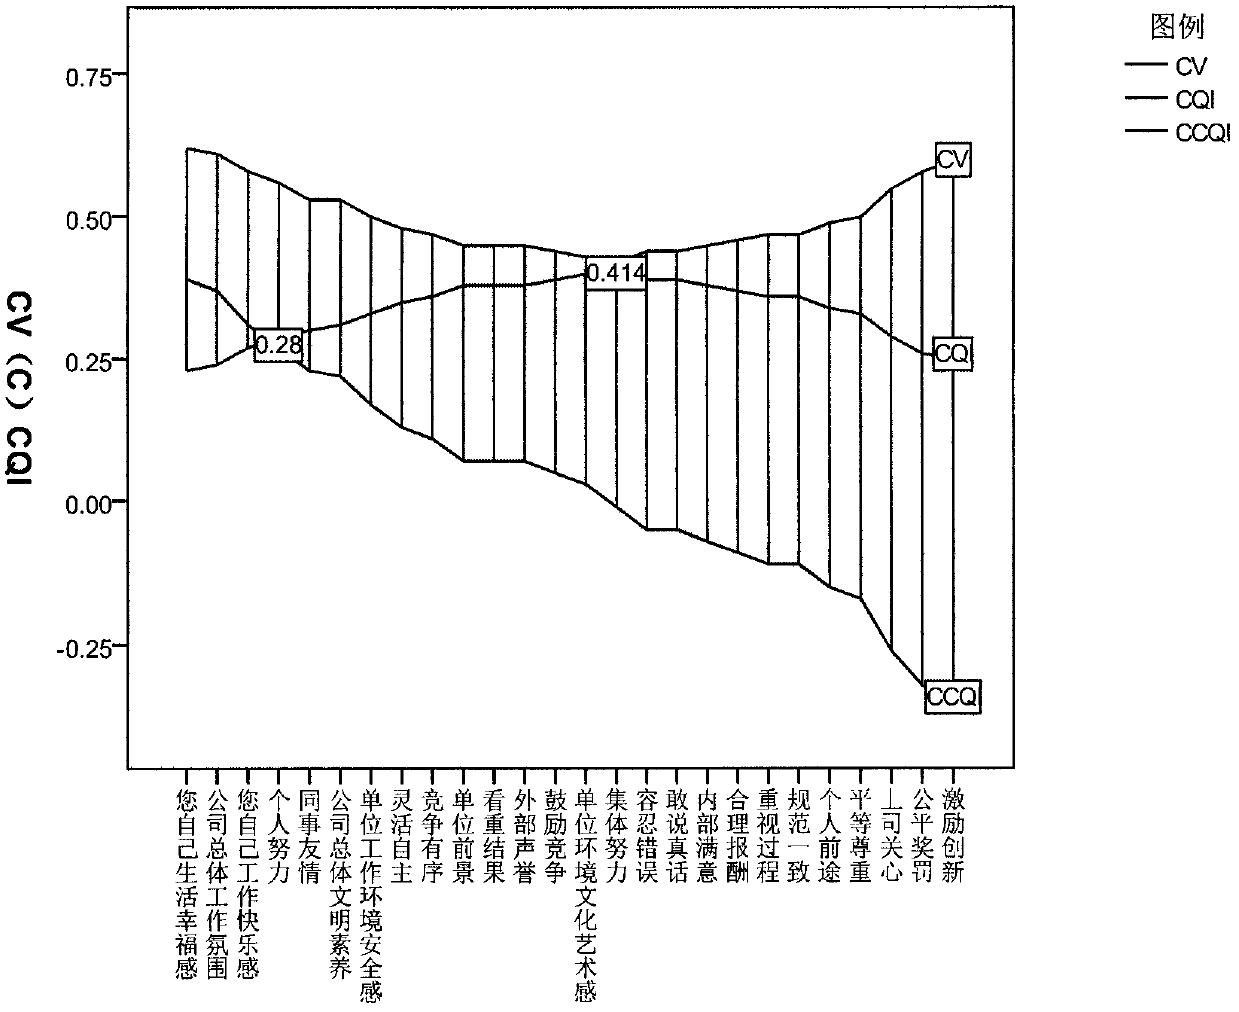
[0075] Taking the actual measurement of the cultural "quality" of the members of two companies, A and B, in the sense of value, concept dispersion, and degree of division as an example, the "CV dynamic quality control table" is made.

[0076] Company A is a professional enterprise that produces air conditioners, compressor wire harness components, fluorine-resistant polyester lead wires, balance weights, compressor plastic parts and other series of products. It covers an area of ​​10,000 square meters and has more than 500 employees. With world-class advanced equipment imported from the United States and Italy, the annual output of fluorine-resistant polyester leads is 20,000KM, and compressor wiring harness assemblies are 20 million sets. The domestic market share of the same industry is as high as 70%, and it occupies a certain international market share. In 2009, the total output value exceeded 60 million, and the profit and tax were 12%.

[0077] Company B was established...

Embodiment 3

[0097] Taking the happiness and sense of security measurement of urban and rural residents in a certain province as an example, the "CV dynamic quality control table" was made.

[0098] The drawing steps are as follows:

[0099] (1) Make or use ready-made questionnaires.

[0100](2) According to scientific sampling, conduct questionnaire survey and collect statistical data. The data in "Table 6: Summary of Measures of Sense of Happiness and Security of Urban and Rural Residents in a Province" are collected from 5 counties (cities), The district, 8 townships, 10 villages (neighborhoods), and 10 communities were used as questionnaire survey objects, and a set of survey statistics on the happiness and security of urban and rural residents were obtained. Since the survey geographically covers all cities in the province, it also takes into account counties (cities) with different economic development status and regional characteristics, such as urban and rural, economically devel...


PUM


Abstract

The invention aims to provide a statistics and measurement method for a dynamic quality control early warning coefficient, which is used for scientifically, accurately and dynamically monitoring the quality of a production process by a dispersion coefficient in a statistic value. The statistics and measurement method for the dynamic quality control early warning coefficient comprises the following steps: a) scientifically sampling according to the requirement, collecting a static data mean value mu capable of embodying a product quality characteristic and a standard difference sigma value, and carrying out a corresponding operation by the following computational formula; b) according to the result, manufacturing a product quality 'CV dynamic quality control table', obtaining a 'CV dynamic quality control curve' from the data in the 'CV dynamic quality control table'; c) on the 'CV dynamic quality control table', carrying out ascending sort according to a sampling product 'dispersion coefficient' CV value, and marking the upper control limit and the lower control limit of product quality; and d) according to the data obtained in the steps, carrying out early warning measurement to the aspects of the splitting degree and the dispersion degree of the cultures of various types of community organization comprising enterprises, and the value of members thereof.

Description

technical field [0001] The invention belongs to the technical field of statistical measurement and quality monitoring, and relates to a simple and convenient statistical measurement method for dynamic quality control early warning coefficients of production process quality and product quality and the application thereof. Background technique [0002] The research and construction of the production process quality control chart has a process from static control to dynamic control, from single variation source control to multiple variation source control research. The current research hotspots are mainly dynamic control methods such as "Double Sampling (DS) Mean-Standard Deviation Control Chart" and "Multiple Variation Source Mean Control Chart". So far, the research on this aspect has a common feature: they all try to set upper and lower limits for the sample mean and standard deviation, and monitor the quality of the production process through the combination of the two. Si...

Claims


Application Information

Patent Timeline
IPC IPC(8): G06Q10/04
Inventor 吴福平
Owner 吴福平
Why Eureka
Try Eureka