Detection method for neighbor abnormities of gas turbine
A gas turbine and anomaly detection technology, which is used in engine testing, machine/structural component testing, measurement devices, etc., and can solve the problems of large number of data gas turbines and low efficiency of health status analysis.
- Summary
- Abstract
- Description
- Claims
- Application Information
AI Technical Summary
Problems solved by technology
Method used
Image
Examples
specific Embodiment approach 1
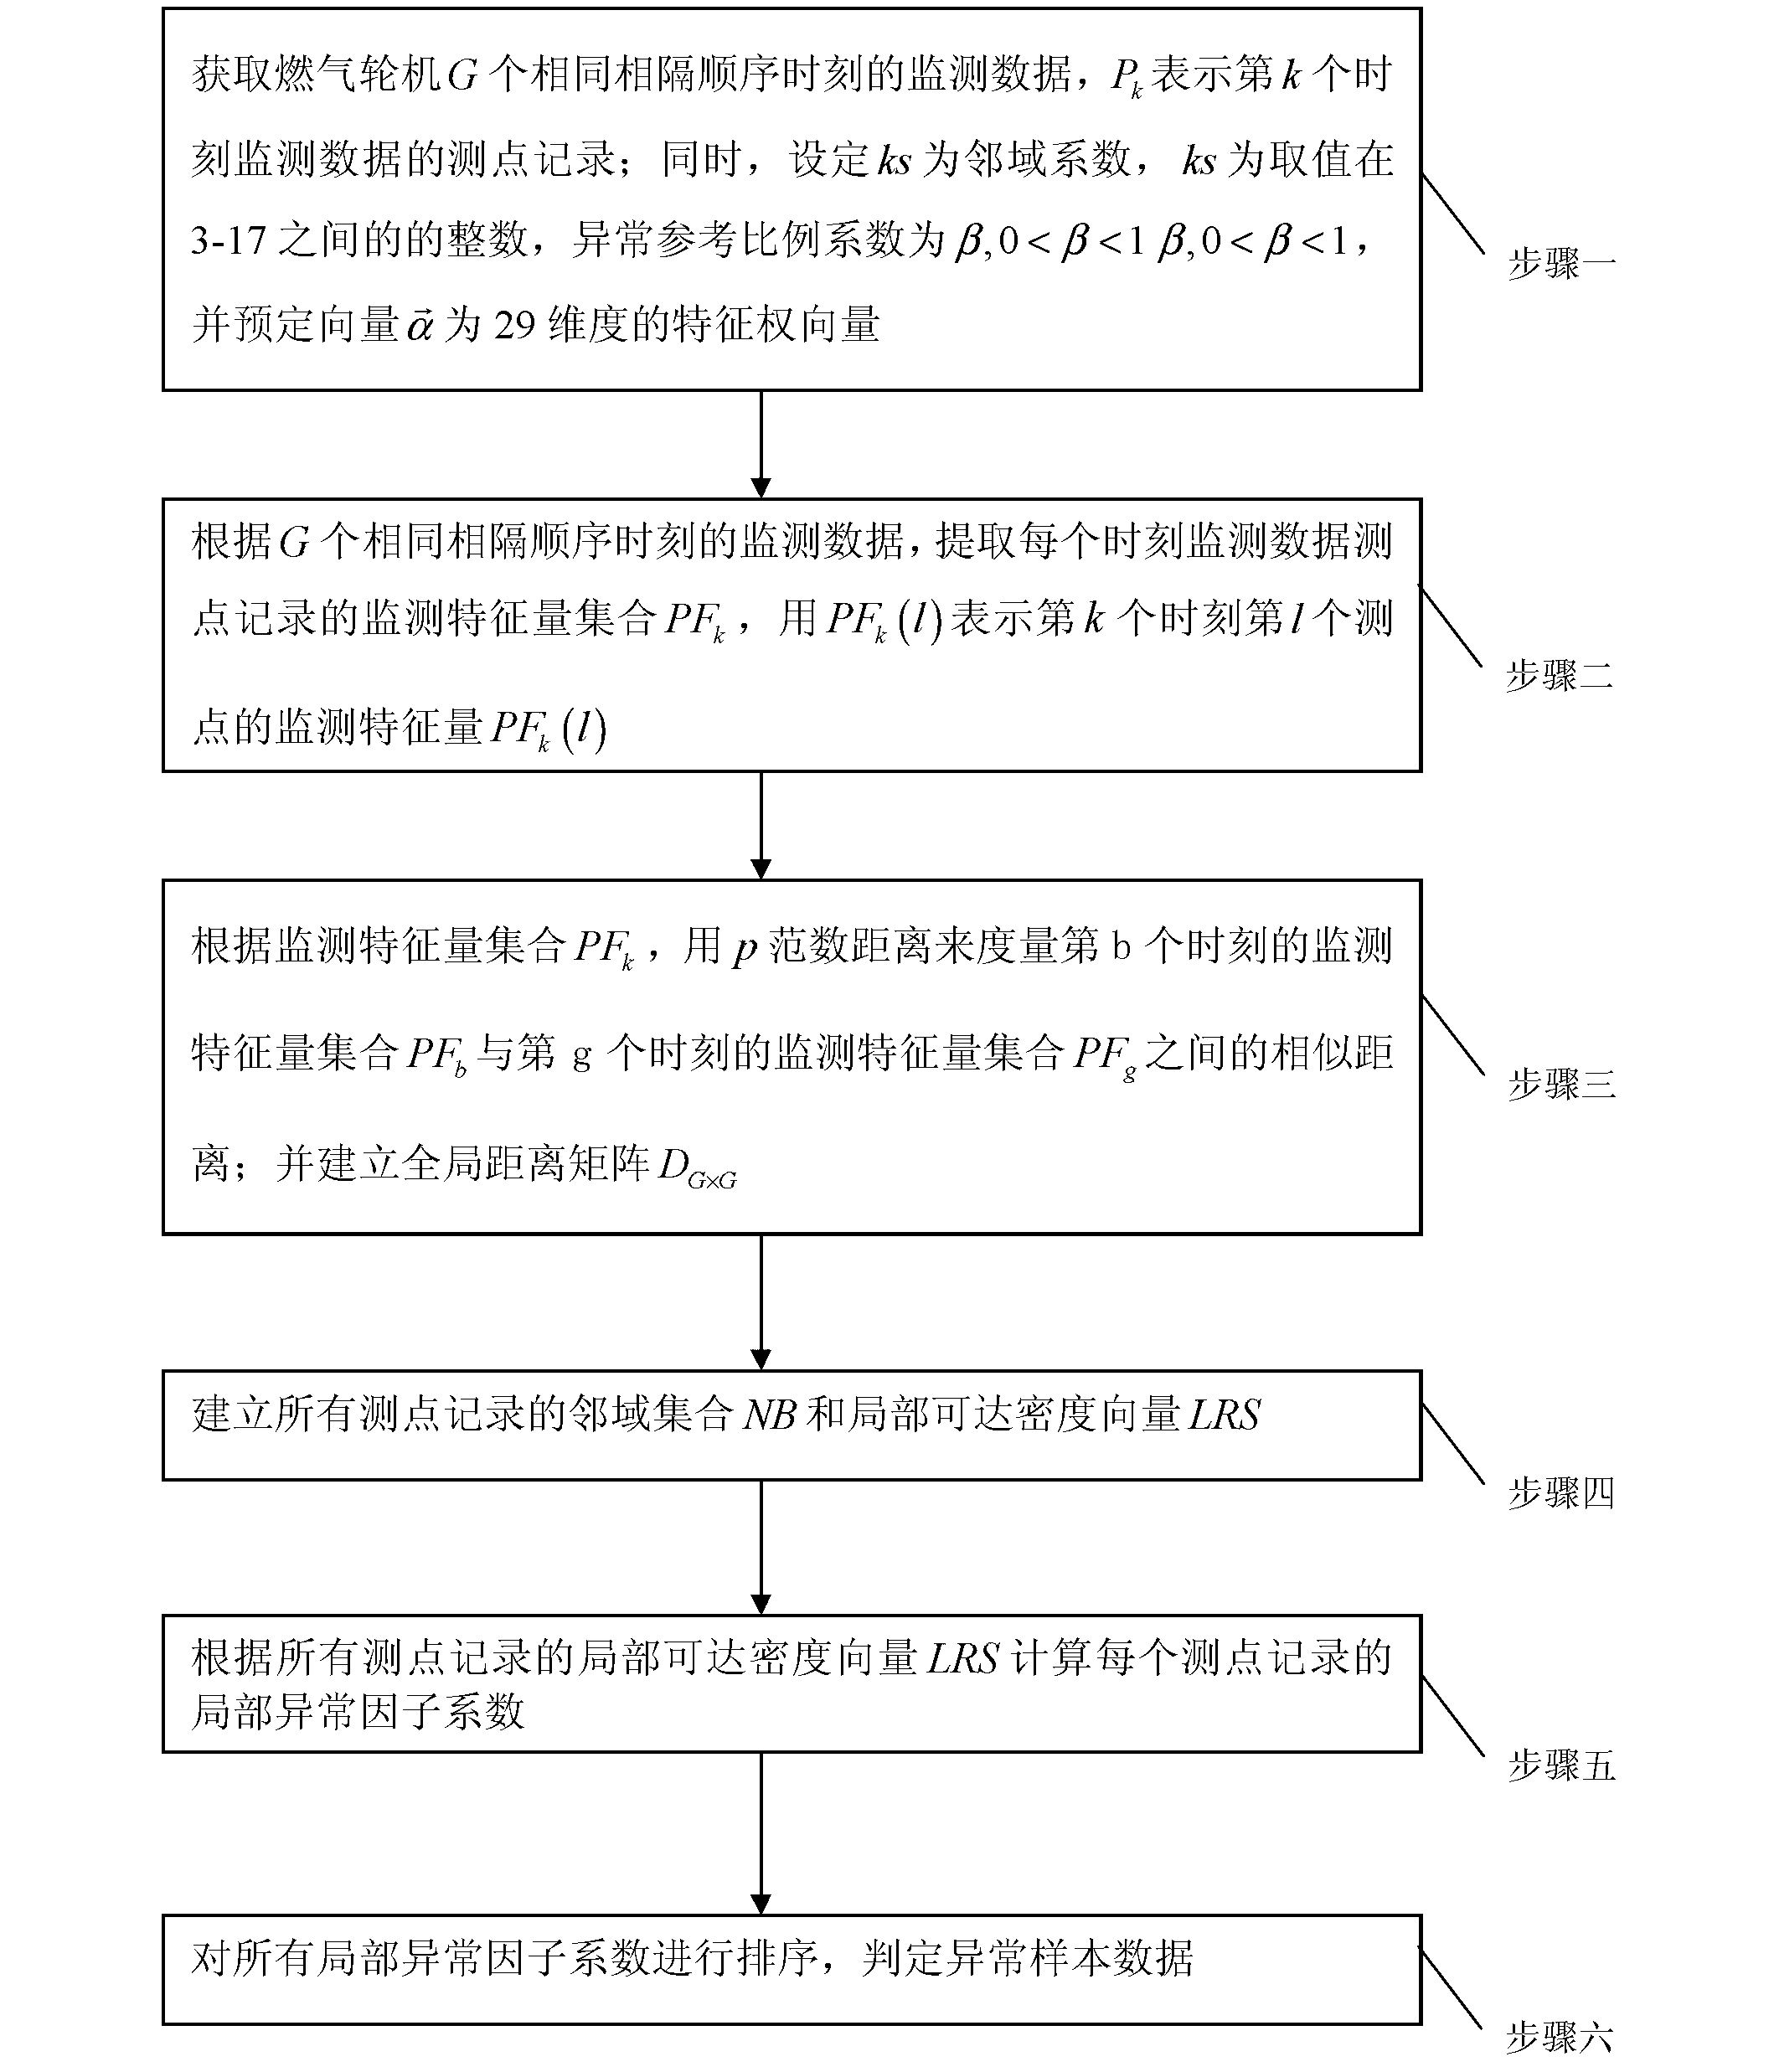
[0038] Specific implementation mode one: the following combination figure 1 Describe this embodiment, the neighbor anomaly detection method of the gas turbine described in this embodiment, it comprises the following steps:
[0039] Step 1: Obtain the monitoring data of G gas turbines at the same interval sequence time, P kIndicates the measurement point record of the monitoring data at the kth moment, G is an integer greater than or equal to 800, k=1, 2, 3...G; at the same time, set kS as the neighborhood coefficient, and kS is the value between 3-17 An integer between , the abnormal reference scale coefficient is β, 0 is a 29-dimensional feature weight vector;
[0040] Step 2: According to the monitoring data of G same interval sequence time, extract the monitoring feature quantity set PF recorded by the monitoring data measuring points at each time k , with PF k (l) Indicates the monitoring feature PF of the lth measuring point at the kth moment k (l), l=1, 2, 3...29;
...
specific Embodiment approach 2
[0054] Specific implementation mode two: this implementation mode is a further description of implementation mode one, and the measurement point record P in step four described in this implementation mode k The neighborhood set of is NB(k) and the local reachable density vector is LRS(k), the method of obtaining is:
[0055] Step 41: Obtain the kth measuring point record P k The ks-th shortest distance with other measuring point records is denoted as LD(k), that is, for
[0056] Dist(PF k , PF 1 ), Dist(PF k , PF 2 ),..., Dist(PF k , PF k-1 ), Dist(PF k , PF k+1 ),..., Dist(PF k , PF G ) are sorted in ascending order, and the distance corresponding to the ksth smallest is LD(k);
[0057] where and the measuring point record P k The nearest ks samples P ω (ω=1, 2, ..., k-1, k+1, ..., G) set is denoted as NB(k):
[0058] NB(k)={P ω , Dist(PF k , PF w )≤LD(k)};
[0059] Step 42: Measuring point record P k The local reachable density vector of LRS(k) is:
[006...
specific Embodiment approach 3
[0061] Specific embodiment three: This embodiment is a further description of embodiment two. The method for calculating the local anomaly factor coefficient recorded at each measuring point in step five of this embodiment is:
[0062] Obtain the local anomaly factor coefficients of all measuring point records, and use LOF(k) to represent the local anomaly factor coefficient of the kth measuring point record, and LOF(k) is expressed as:
[0063] LOF ( k ) = Σ P ω ∈ NB ( k ) LRS ( ω ) ks × LRS ( ...
PUM
 Abstract
Description
Claims
Application Information
 - R&D
- Intellectual Property
- Life Sciences
- Materials
- Tech Scout
- Unparalleled Data Quality
- Higher Quality Content
- 60% Fewer Hallucinations
Browse by: Latest US Patents, China's latest patents, Technical Efficacy Thesaurus, Application Domain, Technology Topic, Popular Technical Reports.
© 2025 PatSnap. All rights reserved.Legal|Privacy policy|Modern Slavery Act Transparency Statement|Sitemap|About US| Contact US: help@patsnap.com


