Method for drawing wind-rose chart based on ExtJs

A rose diagram, wind speed technology, applied in the field of meteorology, can solve the problems of large amount of statistical data, request failure, multiple network bandwidth, etc., to achieve the effect of strong scalability, convenient transplantation, and easy deployment

Active Publication Date: 2014-04-09
GUODIAN NANJING AUTOMATION
View PDF2 Cites 11 Cited by
  • Summary
  • Abstract
  • Description
  • Claims
  • Application Information

AI Technical Summary

Problems solved by technology

Therefore, when drawing a rose diagram in a web system, using the traditional method of requesting server-side scripts to obtain ...

Method used


Image

  • Method for drawing wind-rose chart based on ExtJs
  • Method for drawing wind-rose chart based on ExtJs
  • Method for drawing wind-rose chart based on ExtJs

Examples


Embodiment 1

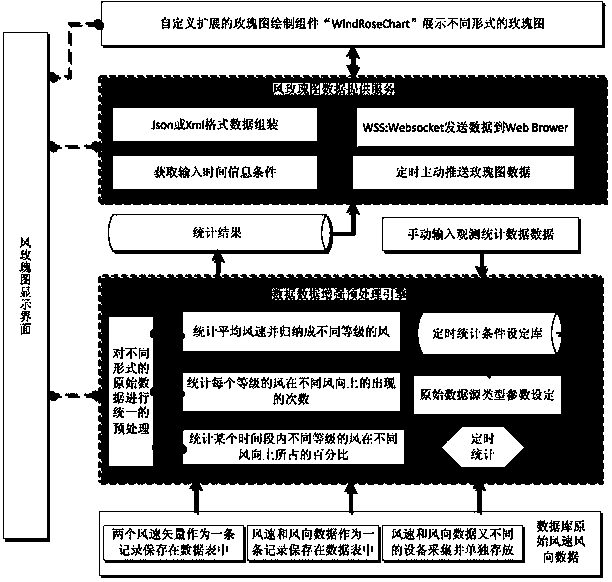
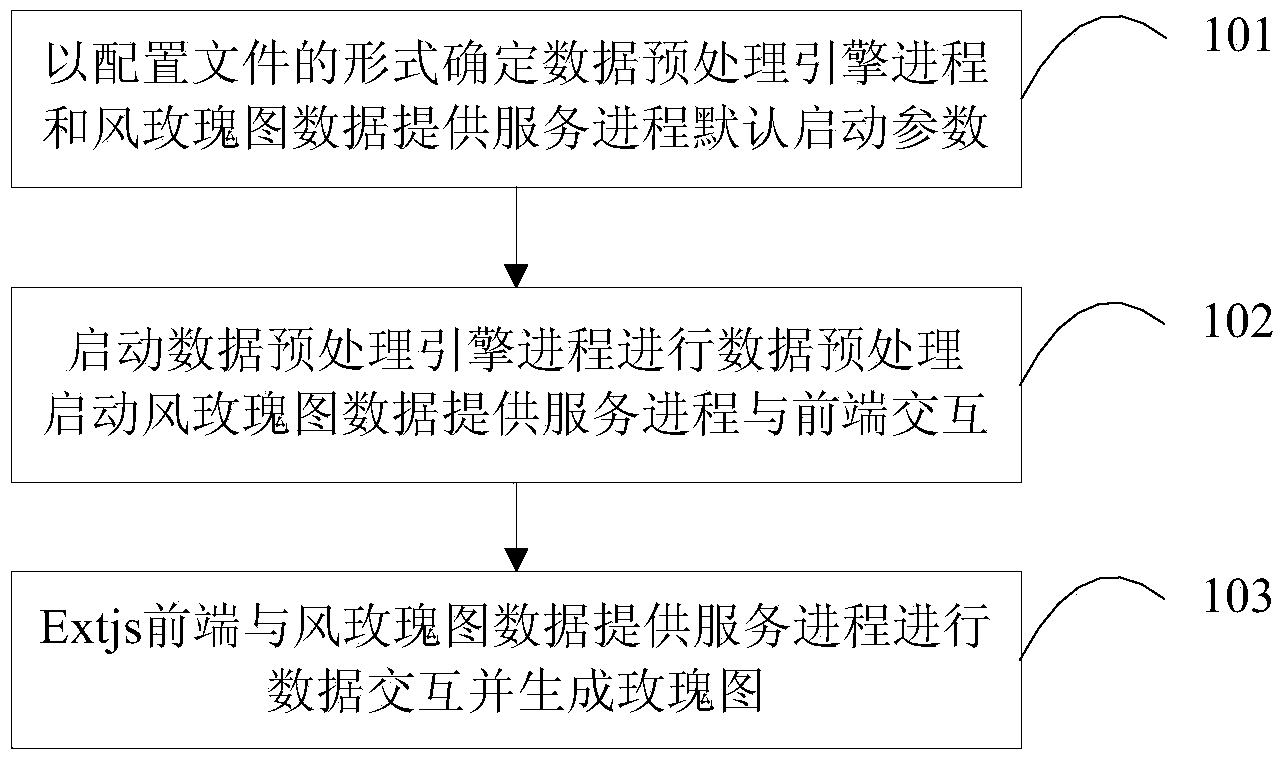
[0088] Step1: Refer to step 101, wherein the read data mode is set to the above-mentioned ReadDataModel:auto to represent that the original wind element data is automatically read from the database; the wind element type data parameter of the data preprocessing engine process is set to DataType:1 to represent the original database Two wind speed vectors are provided in ; the data analysis format of the wind rose diagram data provision service process is set to AnalysisType: 1, which means that the data is assembled into data in Json format.

[0089] Step2: Referring to step 102, first start the data preprocessing engine process for data preprocessing, and start the wind rose map data providing service process. These two background service processes will complete the interaction with the front end according to the parameters set in Step1.

[0090] Step3: Refer to step 103 to perform data interaction with the Extjs front-end configuration and the wind rose diagram data providing ...

Embodiment 2

[0093] Step1: With reference to step 101, wherein the read data mode is set to the above-mentioned ReadDataModel: auto means to automatically read the original wind element data from the database; the wind element type data parameter of the data preprocessing engine process is set to DataType: 3 in the original database The provided wind speed and wind direction data are collected by different collection devices; the data analysis format of the wind rose diagram data provision service process is set to AnalysisType: 1, which means that the data is assembled into data in Json format.

[0094] Step2: Referring to step 102, first start the data preprocessing engine process for data preprocessing, and start the wind rose map data providing service process. These two background service processes will complete the interaction with the front end according to the parameters set in Step1.

[0095] Step3: Set the timing push time parameters in the timing condition library (the default is...

Embodiment 3

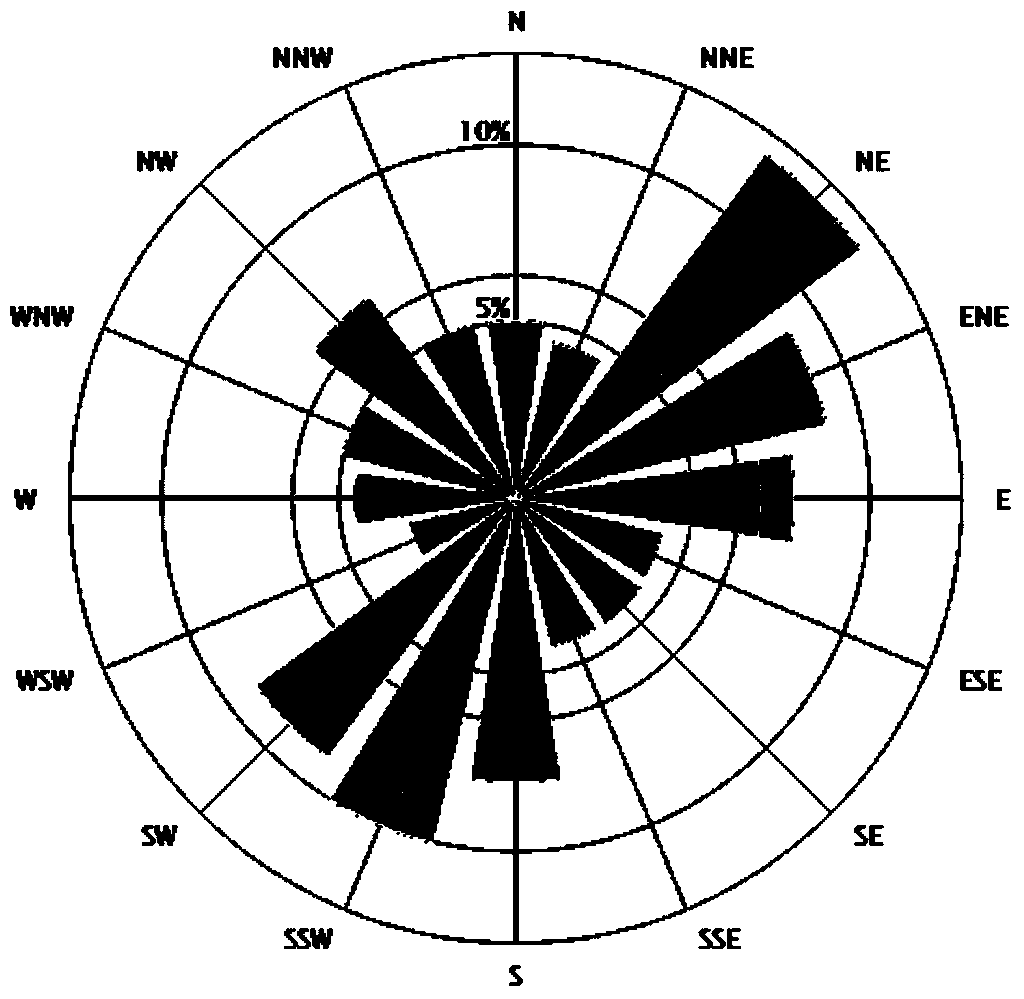
[0099] Step1: Referring to step 101, ReadDataModel:artificial means to read artificially counted wind element data from the specified directory. This embodiment supports file data in cvs format. The file format is not limited to this, and can be adjusted according to the storage format of specific file data File parser. Some screenshots of its raw data are as follows Figure 5 As shown, the original data needs to be simply processed into a certain format of statistical data of wind elements and stored in a file; DataType: 2 means that the original database directly provides the average wind speed and average wind direction information; the wind rose diagram data provides the data analysis format of the service process Setting it to AnalysisType: 1 means that the data is assembled into data in Json format.

[0100] Step2: Put the statistical data file in the specified directory.

[0101] Step3: Referring to step 102, first start the data preprocessing engine process for data ...


PUM


Abstract

The invention provides a method for drawing a wind-rose chart based on the ExtJx. The method comprises the steps that original wind factor data of different modes are processed in a unified mode and stored in a database through a data enhancing preprocessing engine process; data analysis and assembly are conducted on wind-rose chart data obtained from the database by a wind-rose chart data service providing process according to a timing condition and wind-rose statistical data are provided for a front platform; different display modes of the wind-rose chart are configured by a rose chart drawing assembly 'Wind Rose Chart', the display modes are configured to a Panel assembly of the ExtJs and are bound with a data set of the wind-rose chart; after an ExtJs event mechanism asynchronously judges that the data arrive, the rose chart is updated. The method is convenient to deploy and capable of rapidly and accurately conducting rendering at the front end and updating the wind-rose chart in time and providing full support for development of the rose chart at the front end of a Web information system, and can be conveniently and rapidly connected to the Web information system needing rose chart drawing.

Description

technical field [0001] The invention relates to a method for drawing a wind rose diagram based on ExtJs, which belongs to the field of meteorology. Background technique [0002] There are two types of wind rose diagrams: wind direction rose diagram and wind speed rose diagram. The wind speed rose diagram refers to the statistics of the average wind speed of different levels of wind in each wind direction at a given location for a period of time and then plotting it on eight or sixteen directions in polar coordinates. The wind direction rose diagram is mainly used to indicate the frequency of winds in different wind directions at a given location within a period of time, blowing from the outside to the center according to the wind direction, and using eight or sixteen directions. There are other forms of the wind rose diagram, where eight or sixteen compass positions in polar coordinates represent both wind frequency and speed. [0003] As a special chart for meteorological...

Claims


Application Information

Patent Timeline
IPC IPC(8): G06F17/50
Inventor 禇红健包德梅王媛媛王志心李佑文岳以洋罗存
Owner GUODIAN NANJING AUTOMATION
Why Eureka
Try Eureka