Graph visualization system used for electric system load flow and stability analysis

A stability analysis and power system technology, applied in the field of power grid visualization, can solve problems such as time-consuming and energy-consuming, unconvergent methods, difficulties, etc., and achieve the effect of improving production efficiency

Active Publication Date: 2014-04-09
DALIAN UNIV OF TECH +1
View PDF2 Cites 20 Cited by
  • Summary
  • Abstract
  • Description
  • Claims
  • Application Information

AI Technical Summary

Problems solved by technology

Due to the large scale of the power grid structure and the complex and changeable operation mode, it is very difficult to quickly and accurately locate the corresponding equipment parameters in the data file, and there is a possibility that the

Method used


Image

  • Graph visualization system used for electric system load flow and stability analysis
  • Graph visualization system used for electric system load flow and stability analysis
  • Graph visualization system used for electric system load flow and stability analysis

Examples


Embodiment Construction

[0024] The realization of a graphic visualization system for power system power flow and stability analysis of the present invention will be further described below in conjunction with the accompanying drawings.

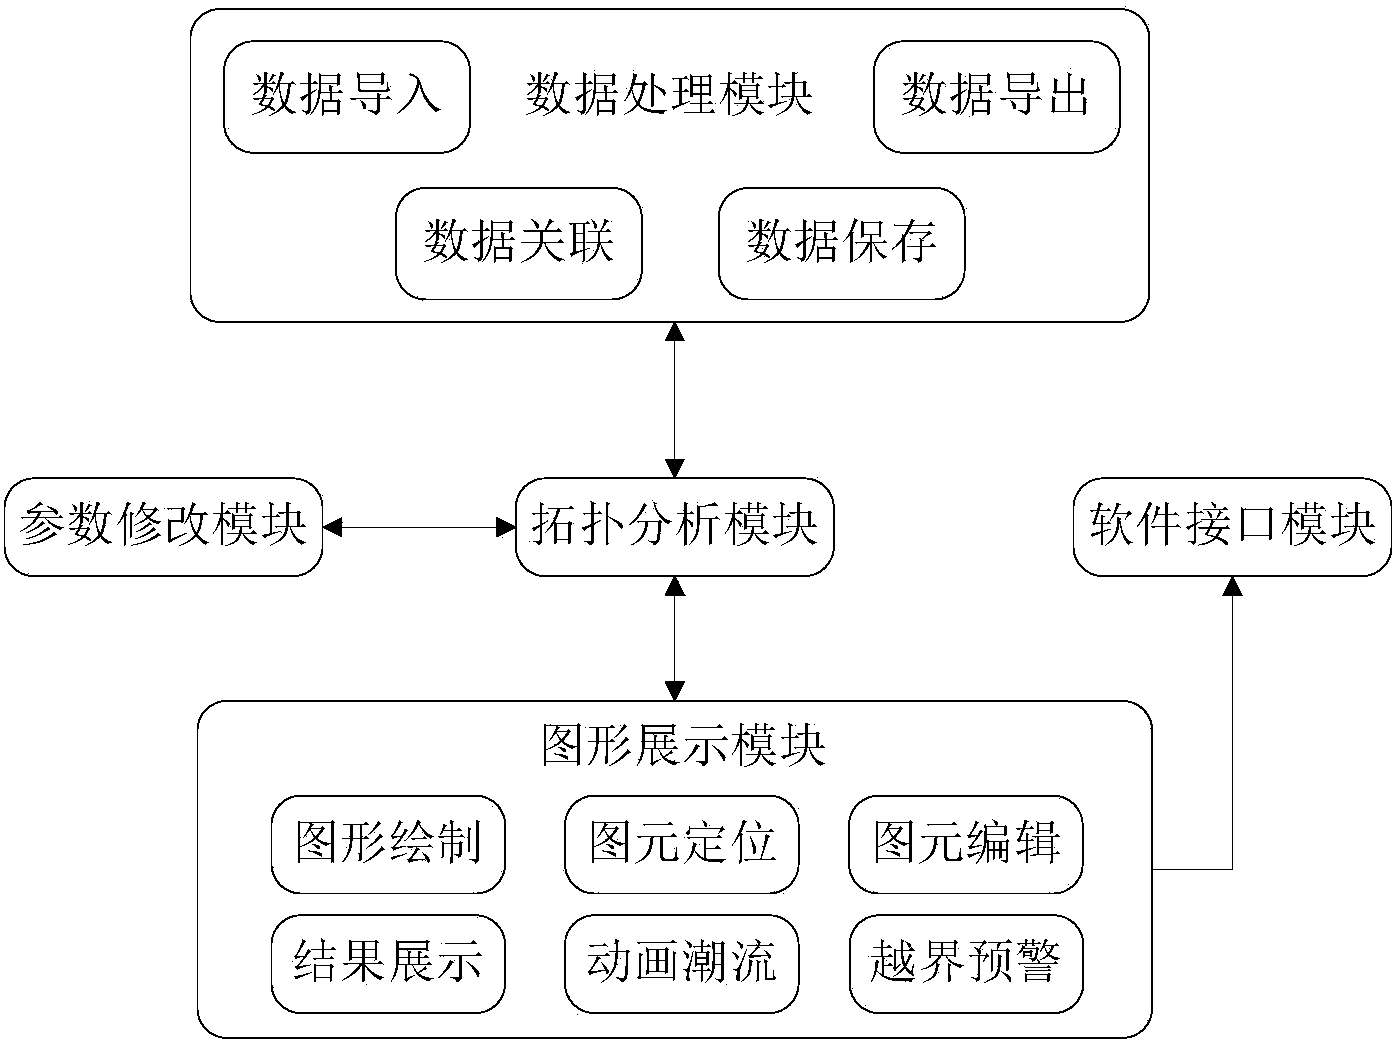
[0025] figure 1 Shown is a frame diagram of a graphic visualization system for power system power flow and stability analysis. The comprehensive display visualization system consists of a data processing module, a topology analysis module, a parameter modification module, a graphic display module and a software interface module. The data processing module is connected to the parameter modification module and the graphic display module through the topology analysis module, the parameter modification module is connected to the graphic display module through the topology analysis module, and the software interface module is connected to the graphic display module. The data processing module and the graphic display module are connected;

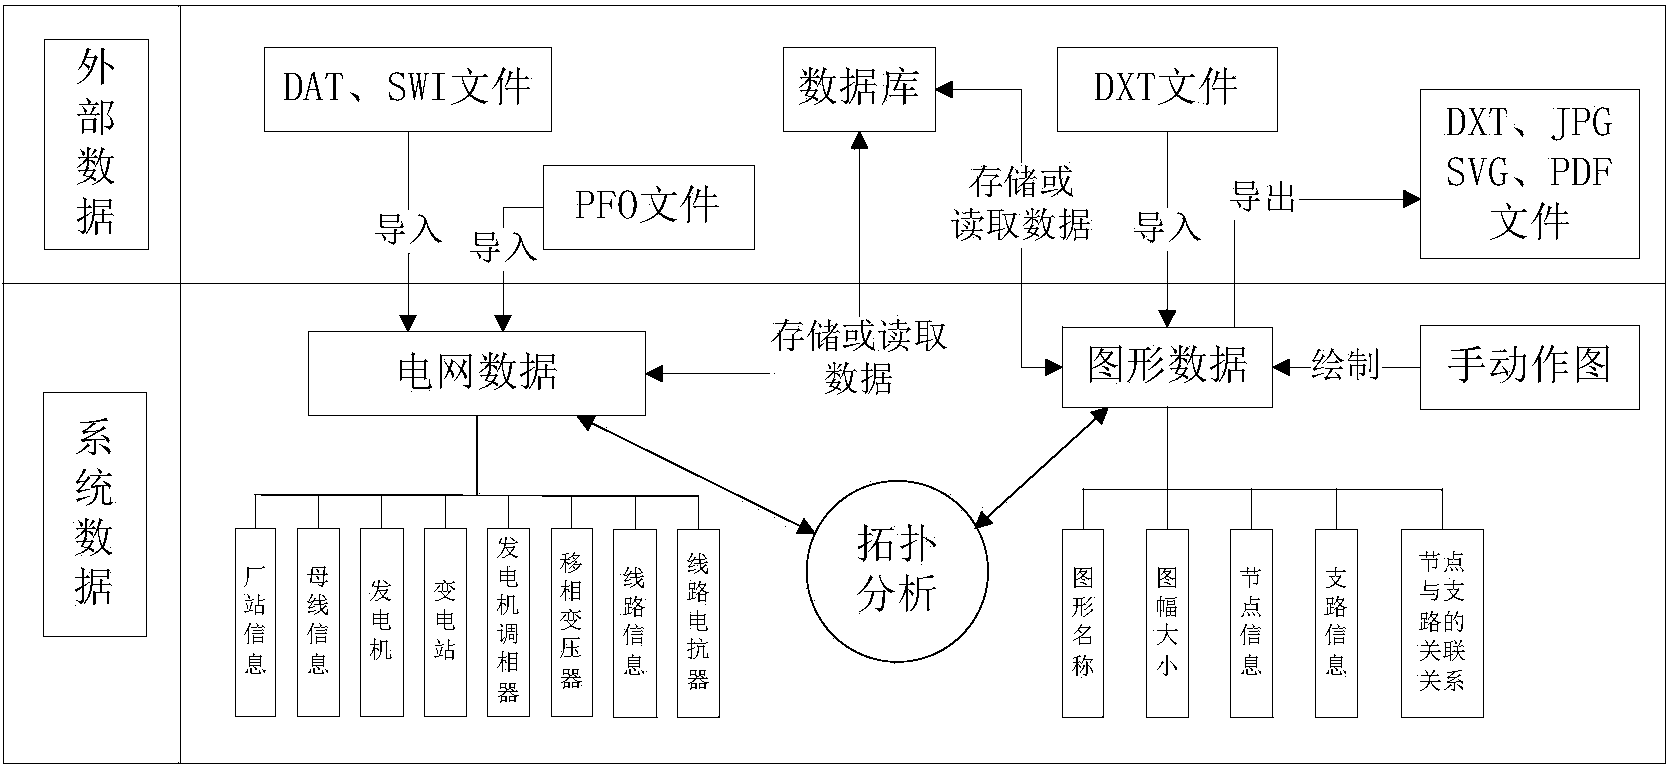
[0026] figure 2 Shown is a sc...


PUM


Abstract

The invention discloses a graph visualization system used for electric system load flow and stability analysis. The graph visualization system comprises a data processing module, a topological analysis module, a parameter modifying module, a graph displaying module and a software interface module. The data processing module is used for obtaining, storing and exporting network topological data, and a calculation file and the topological data are connected in a linkage mode. On the basis of data processing, the system sets the starting and halting states of equipment, and modifies parameters of the equipment through the topological analysis module and the parameter modifying module. Programs, provided by PSD-BPA software, for load flow calculation, stability calculation, N-1 analysis, small interference, short-circuit currents and fracture surface limit analysis are called through the software interface module. The graph displaying module is used for displaying a power grid topological structure, editing graph objects and displaying calculation result information. According to the system, power grid equipment parameters and mode data are adjusted on a graph sheet, the load flow and stability analysis is performed on the graph sheet, the management mode of text data is changed, and manufacturing efficiency of a power grid calculation mode is improved.

Description

technical field [0001] The invention belongs to the technical field of power grid visualization, and relates to the adjustment of power grid parameters and the arrangement of methods, especially to realize the power flow and stability parameters of PSD-BPA (power system analysis software tool developed by China Electric Power Research Institute, hereinafter referred to as PSD-BPA) Graphical management and adjustment. Background technique [0002] The power system analysis program PSD-BPA integrates multiple core calculation programs and various integrated operating environments such as power flow, stability, short-circuit current, small disturbance calculation and analysis, and voltage stability. It has large calculation scale, fast calculation speed, good numerical stability, With strong functions and other characteristics, it has been widely used in my country's power system planning, dispatching, production operation and scientific research departments. PSD-BPA software i...

Claims


Application Information

Patent Timeline
IPC IPC(8): H02J3/00G06Q50/06
CPCY04S10/545Y02E40/76Y02E40/70Y04S10/50
Inventor 程春田吴琛李刚王健张杰刘本希罗彬张丹杨浚文
Owner DALIAN UNIV OF TECH
Why Eureka
Try Eureka