Complexity spectrum electroencephalographic prediction and diagnosis method based on power spectrum division

A diagnostic method and complex technology, applied in the direction of diagnosis, diagnostic recording/measurement, electrical digital data processing, etc., can solve problems such as errors and misdiagnosis

Active Publication Date: 2014-06-25
BEIJING UNIV OF TECH
View PDF7 Cites 9 Cited by
  • Summary
  • Abstract
  • Description
  • Claims
  • Application Information

AI Technical Summary

Problems solved by technology

[0008] In order to solve the problem that a single complexity index can satisfy the analysis, diagnosis and prediction of EEG signals related to various brain and mental diseases in the actual technology, the problem of high probability of errors and misdiagnosis, the present invention provides a method based on power spectrum division Complexity spectrum EEG prediction and diagnosis method, this method can not only analyze, model and calculate EEG signals, but also conduct reference modeling nonlinear processing of EEG signals and fine-tune the complexity of EEG signals structural analysis

Method used


Image

  • Complexity spectrum electroencephalographic prediction and diagnosis method based on power spectrum division
  • Complexity spectrum electroencephalographic prediction and diagnosis method based on power spectrum division
  • Complexity spectrum electroencephalographic prediction and diagnosis method based on power spectrum division

Examples


Embodiment Construction

[0089] The present invention will be further described below in conjunction with the accompanying drawings and implementation examples. This implementation example is aimed at classifying and diagnosing the EEG signals of depression patients collected in a hospital.

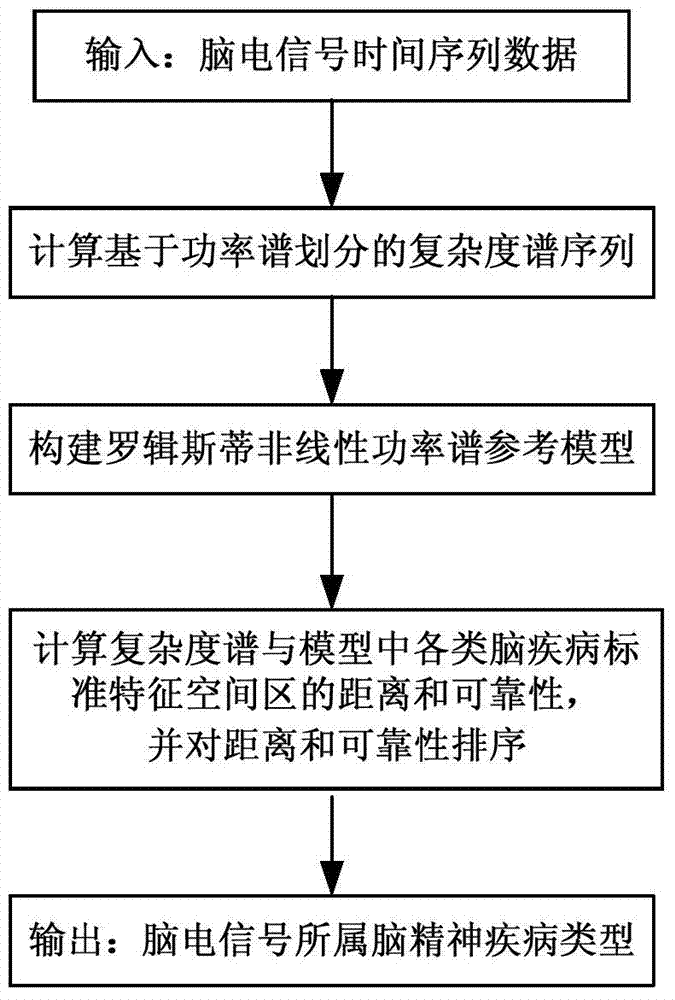
[0090] figure 1 It is a flow chart of the method described in the present invention, specifically comprising the following steps:

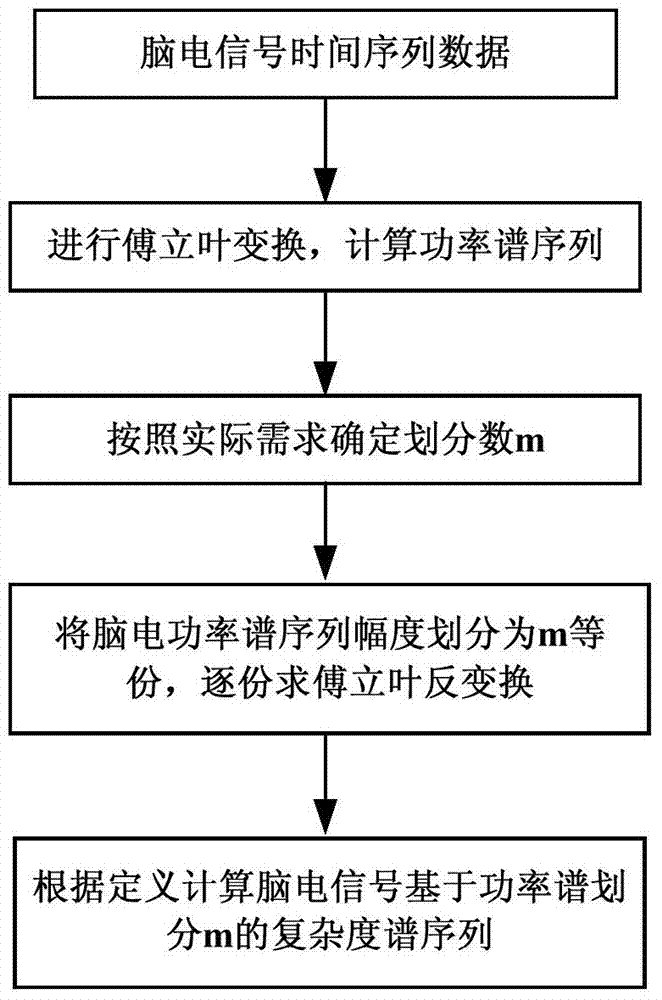
[0091] Step 1: Calculate the EEG signal complexity spectrum based on power spectrum division, the method is as follows figure 2 shown, including the following:

[0092] (1) According to formulas (1)-(3), calculate the complexity spectrum sequence based on power spectrum division for EEG signals. Figure 4 is the EEG complexity spectrum when the power spectrum of depression patients is divided into 36, wherein the value of m is determined according to step (2) with an accuracy of 0.02.

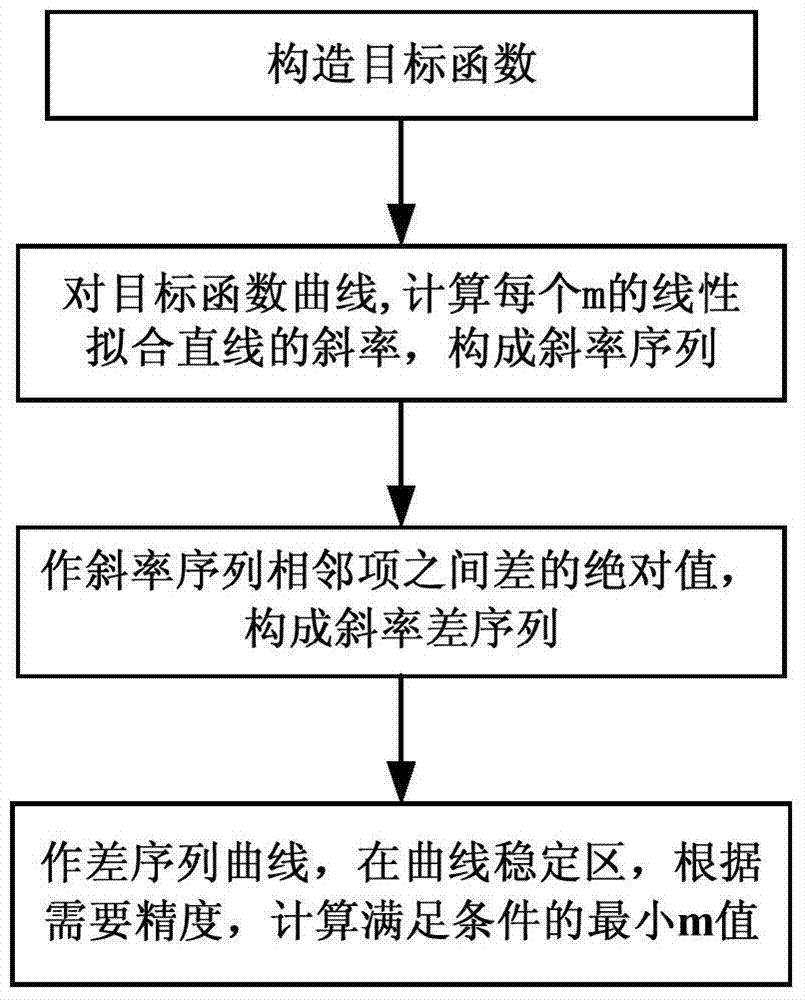
[0093] (2) According to image 3 As shown, according to the formulas (4)-(7), the length of ...


PUM


Abstract

The invention provides a complexity spectrum electroencephalographic prediction and diagnosis method based on power spectrum division and belongs to the field of EEG signal analysis and brain metal disease prediction and diagnosis. The complexity spectrum electroencephalographic prediction and diagnosis method based on power spectrum division mainly includes an EEG signal complexity spectrum definition, analysis and extraction method based on power spectrum division and a nonlinear logistic complexity spectrum reference model construction method. First, a complexity spectrum based on power spectrum division is defined for EEG signals, the calculation method of the complexity spectrum is given, then, a data sequence generated through mapping is calculated through the complexity spectrum electroencephalographic prediction and diagnosis method, an analysis complexity spectrum reference model for the EEG signals is established on the basis, physical and biological meanings of the size, the number and the distribution of all structural spectral line sequences are analyzed, and a complexity spectrum reference space distribution model of the mapping based on power spectrum division is drawn. The complexity spectrum electroencephalographic prediction and diagnosis method based on power spectrum division can be used for predicting and analyzing brain metal diseases.

Description

technical field [0001] The invention belongs to the fields of electroencephalogram (EEG) analysis and prediction and diagnosis of brain and mental diseases, and relates to an analysis, modeling and calculation scheme in the processing of electroencephalogram signals, especially an Linear processing and methods for analyzing the complex fine structure of EEG signals. Background technique [0002] At present, the study of brain science is a hot spot in the field of scientific research, and EEG signal processing is one of the main means of studying the brain. There are currently two types of methods for processing EEG signals, one is linear analysis methods, and the other is nonlinear methods. Linear methods belong to traditional information analysis methods; nonlinear methods belong to modern information processing methods. Linear methods mainly include time-domain analysis, frequency-domain analysis, time-frequency analysis, etc. Non-linear methods mainly include nonlinear ...

Claims


Application Information

Patent Timeline
Patent Type & Authority Applications(China)
IPC IPC(8): A61B5/0476G06F19/00
Inventor 王凯明钟宁周海燕杨剑黄佳进
Owner BEIJING UNIV OF TECH
Why Eureka
Try Eureka