Information stream display system and method based on GIS distribution network graphs

A graphical display and distribution network technology, applied in electrical digital data processing, instruments, calculations, etc., can solve problems such as difficulty in establishing an information network system, poor cross-platform performance of C/S mode, and large redundancy of system resources. Achieve the effect of eliminating difficulties in information exchange, achieving quality and efficiency, and reducing workload

Active Publication Date: 2014-08-06
广州固源电力工程设计有限公司
View PDF2 Cites 24 Cited by
  • Summary
  • Abstract
  • Description
  • Claims
  • Application Information

AI Technical Summary

Problems solved by technology

[0007] However, GIS with C / S structure can perform information management and information sharing very well. Many systems run well, but with the widening of system applications, C / S mode has poor cross-platform performance, difficult maintenance and upgrade, and redundant system resources. Its closed nature makes it difficult for people to establish a complete information network system
Therefore, this mode of GIS can no longer meet the requirements of users

Method used


Image

  • Information stream display system and method based on GIS distribution network graphs
  • Information stream display system and method based on GIS distribution network graphs
  • Information stream display system and method based on GIS distribution network graphs

Examples


Embodiment

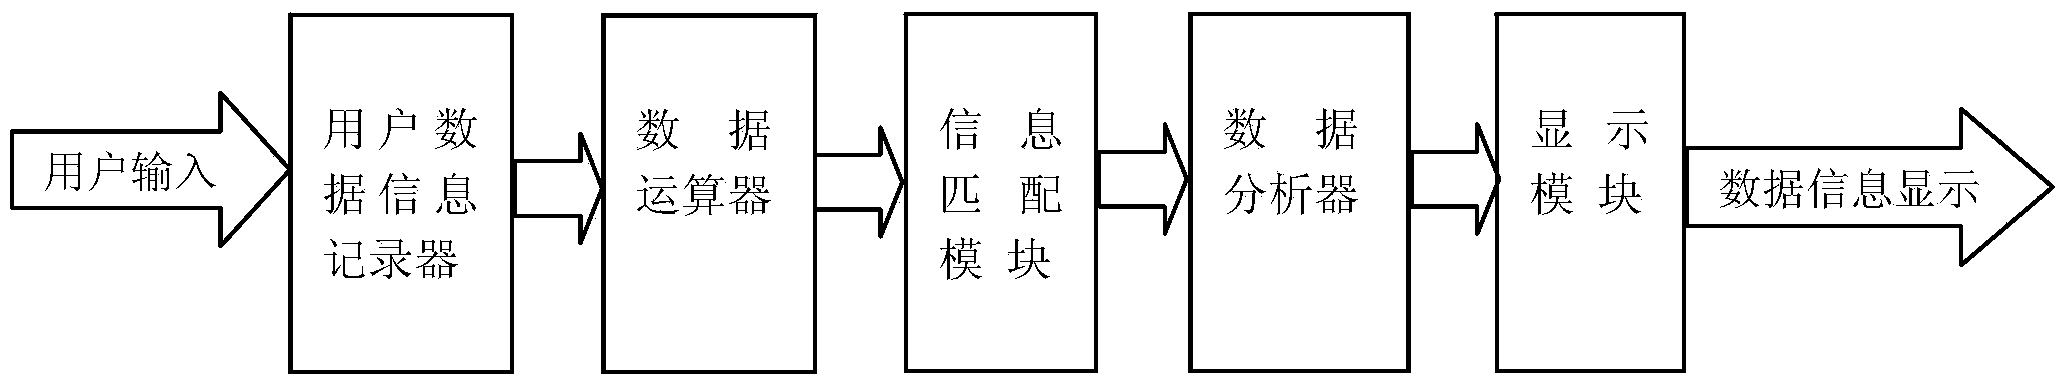
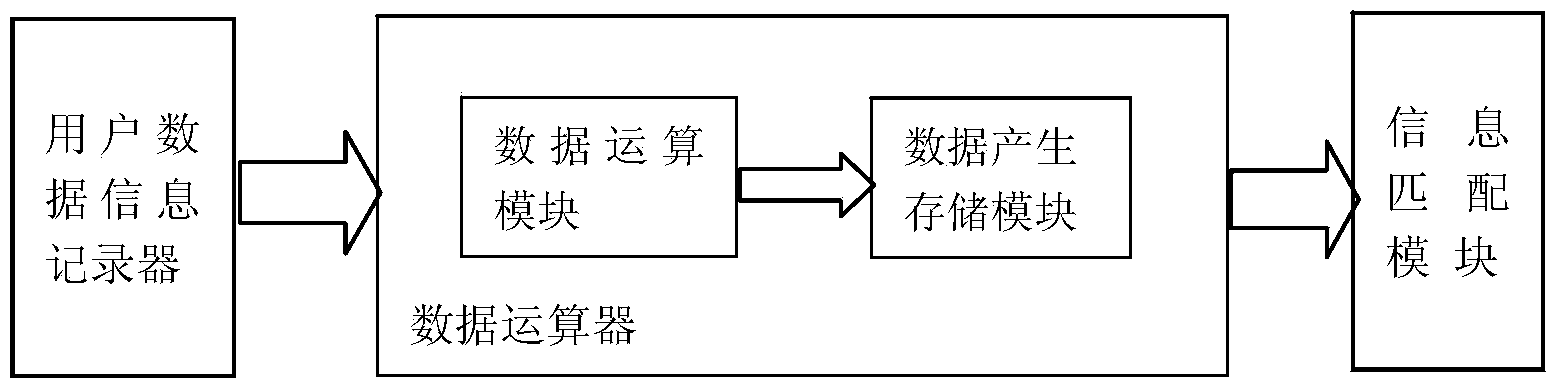
[0070] Such as Figure 1-Figure 3 As shown, a method based on GIS distribution network graphic data information flow display, the system includes a user data information recorder, a data operator, an information matching module, a data analyzer and a display module, and the data operator includes a data An operation module and a data generation and storage module, the data operation module is connected with the user data information recorder and the data generation and storage module, and the data generation and storage module is connected with the data operation module and the information matching module.

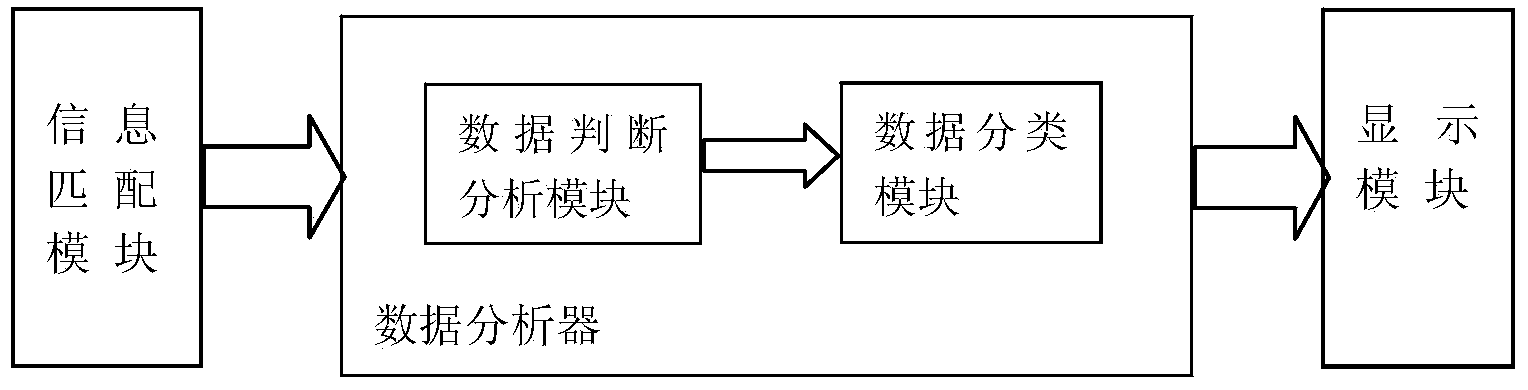
[0071] The data analyzer includes a data judgment and analysis module and a data classification module, the data judgment and analysis module is connected with the information matching module and the data classification module, and the data classification module is connected with the data judgment and analysis module and the display module.

[0072] in:

[0073] The user ...


PUM


Abstract

The invention discloses a system and method based on GIS distribution network graphic display. The system comprises a user data information recorder, a data operational unit, an information matching module, a data analyzer and a display module. The user data information recorder, the data operational unit, the information matching module, the data analyzer and the display module are sequentially connected. The method includes the steps of data information input, data operation, building of a new data storage, matching of corresponding data information, data analysis, generation of data information streams and display of the data information streams on the corresponding GIS graphs. By the adoption of the system and method, data size analysis efficiency is remarkably improved, complex chart data are converted into graphic display information easy to understand, and a distribution network is planned through a GIS through virtual image display.

Description

technical field [0001] The invention belongs to the technical field of network Web GIS data display, in particular to a system and method for displaying data information flow based on GIS distribution network graphics. Background technique [0002] The management of the power supply system and its facilities involves not only the attribute data of power supply facilities and equipment, grid operation data, and user information, but also spatial data such as the geographical location of power supply facilities, and further involves the network structure and network topology of the power supply system. Conventional information management systems based on relational data description, such as device space, electrophysical space, geographic space, and topological space, are difficult to reflect the mutual superposition, coupling, and mapping of multi-space information, so they have both conventional information management functions and special The theory, method and technology of...

Claims


Application Information

Patent Timeline
Patent Type & Authority Applications(China)
IPC IPC(8): G06F17/30
CPCG06F16/248
Inventor 张忠陈淳张康兰王子扬刘冠骞孙赐恩李玲
Owner 广州固源电力工程设计有限公司
Why Eureka
Try Eureka