Road network traffic flow analytical method based on RFID technology

An analysis method and traffic flow technology, applied in the field of dynamic OD matrix acquisition, can solve problems such as inability to obtain OD matrix, large manpower and material resources, and complex algorithms, and achieve the effects of strong operability, convenient modification, and strong scalability

Inactive Publication Date: 2015-01-21
SOUTHEAST UNIV
4 Cites 10 Cited by

AI-Extracted Technical Summary

Problems solved by technology

These two types of methods may require huge manpower and material resources, and can...

Abstract

The invention discloses a road network traffic flow analytical method based on an RFID technology. The method comprises the steps that firstly, RFID base stations are regarded as the travel end points of an OD matrix, an RFID base station network is built, and the basis of a dynamic OD matrix acquiring method based on the RFID technology is constructed; secondly, the time collection degree is selected according to application requirements, vehicle data collected by the RFID base stations are converted into vehicle data of vehicles which pass through any two RFID base stations and have the same license plate number, the license plate numbers of the vehicles and the moments of the vehicles passing through the two RFID base stations are obtained, the time sequences of the vehicles passing through the two RFID base stations are compared, the original destinations of the vehicles are determined, and the traffic volume of the traffic flow with the two RFID base stations as the travel end points is obtained through statistics; finally, the acquired traffic volume between any two RFID base stations is organized to be in the mode of the OD matrix.

Application Domain

Technology Topic

Image

  • Road network traffic flow analytical method based on RFID technology
  • Road network traffic flow analytical method based on RFID technology
  • Road network traffic flow analytical method based on RFID technology

Examples

  • Experimental program(1)

Example Embodiment

[0022] The present invention will be further described in conjunction with embodiment and accompanying drawing now.
[0023] The embodiment is only the preferred implementation of the present invention, it should be pointed out that for those of ordinary skill in the art, without departing from the principle of the present invention, some improvements and equivalent replacements can also be made, these are the claims of the present invention The technical solutions after improvement and equivalent replacement all fall into the protection scope of the present invention.
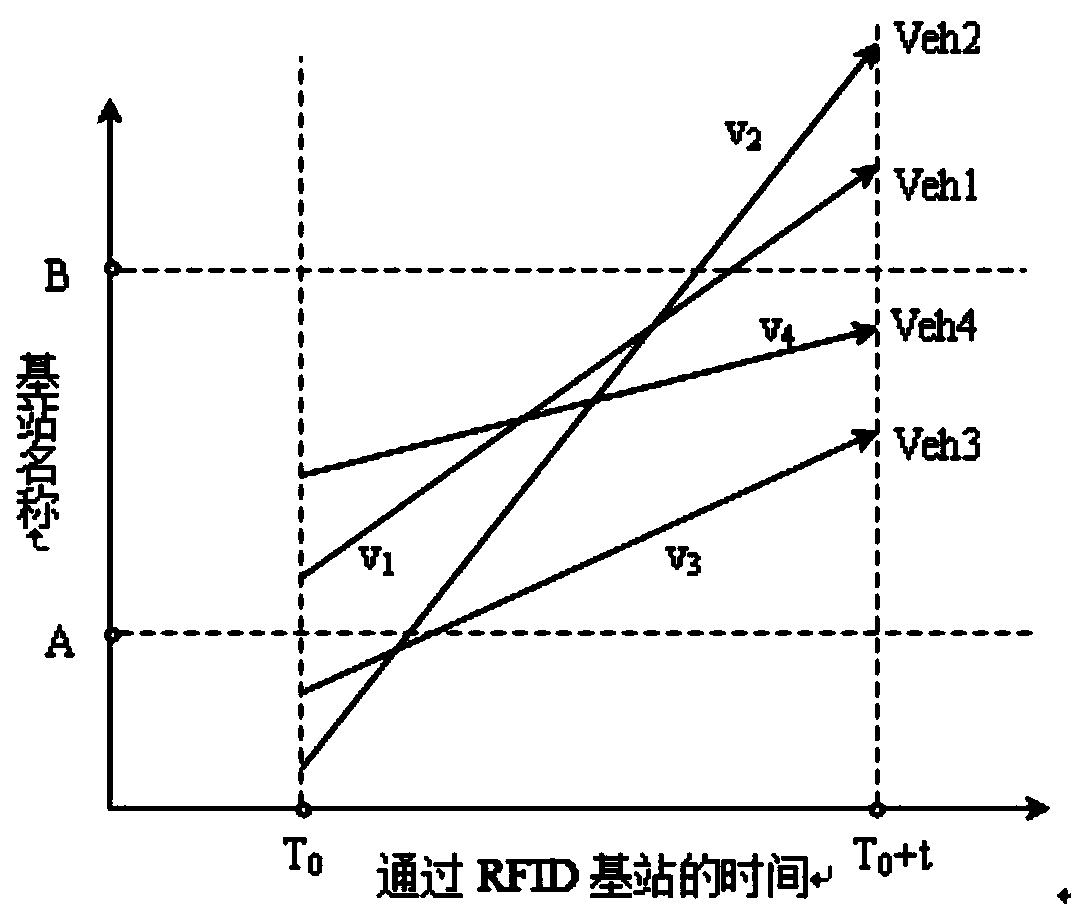
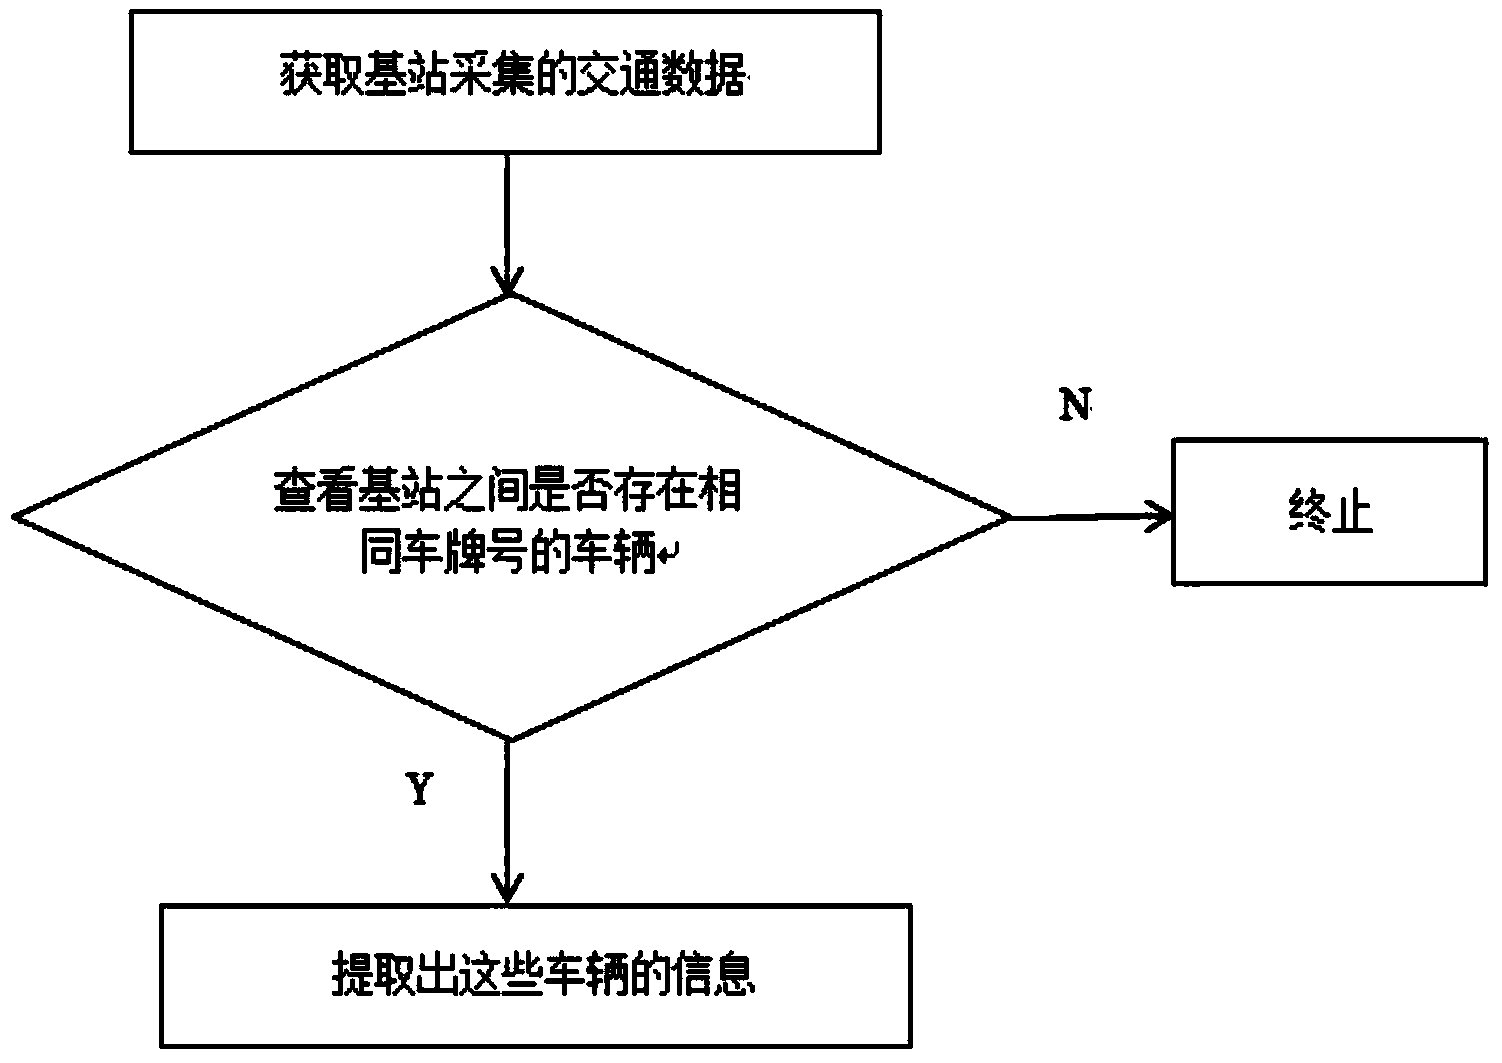
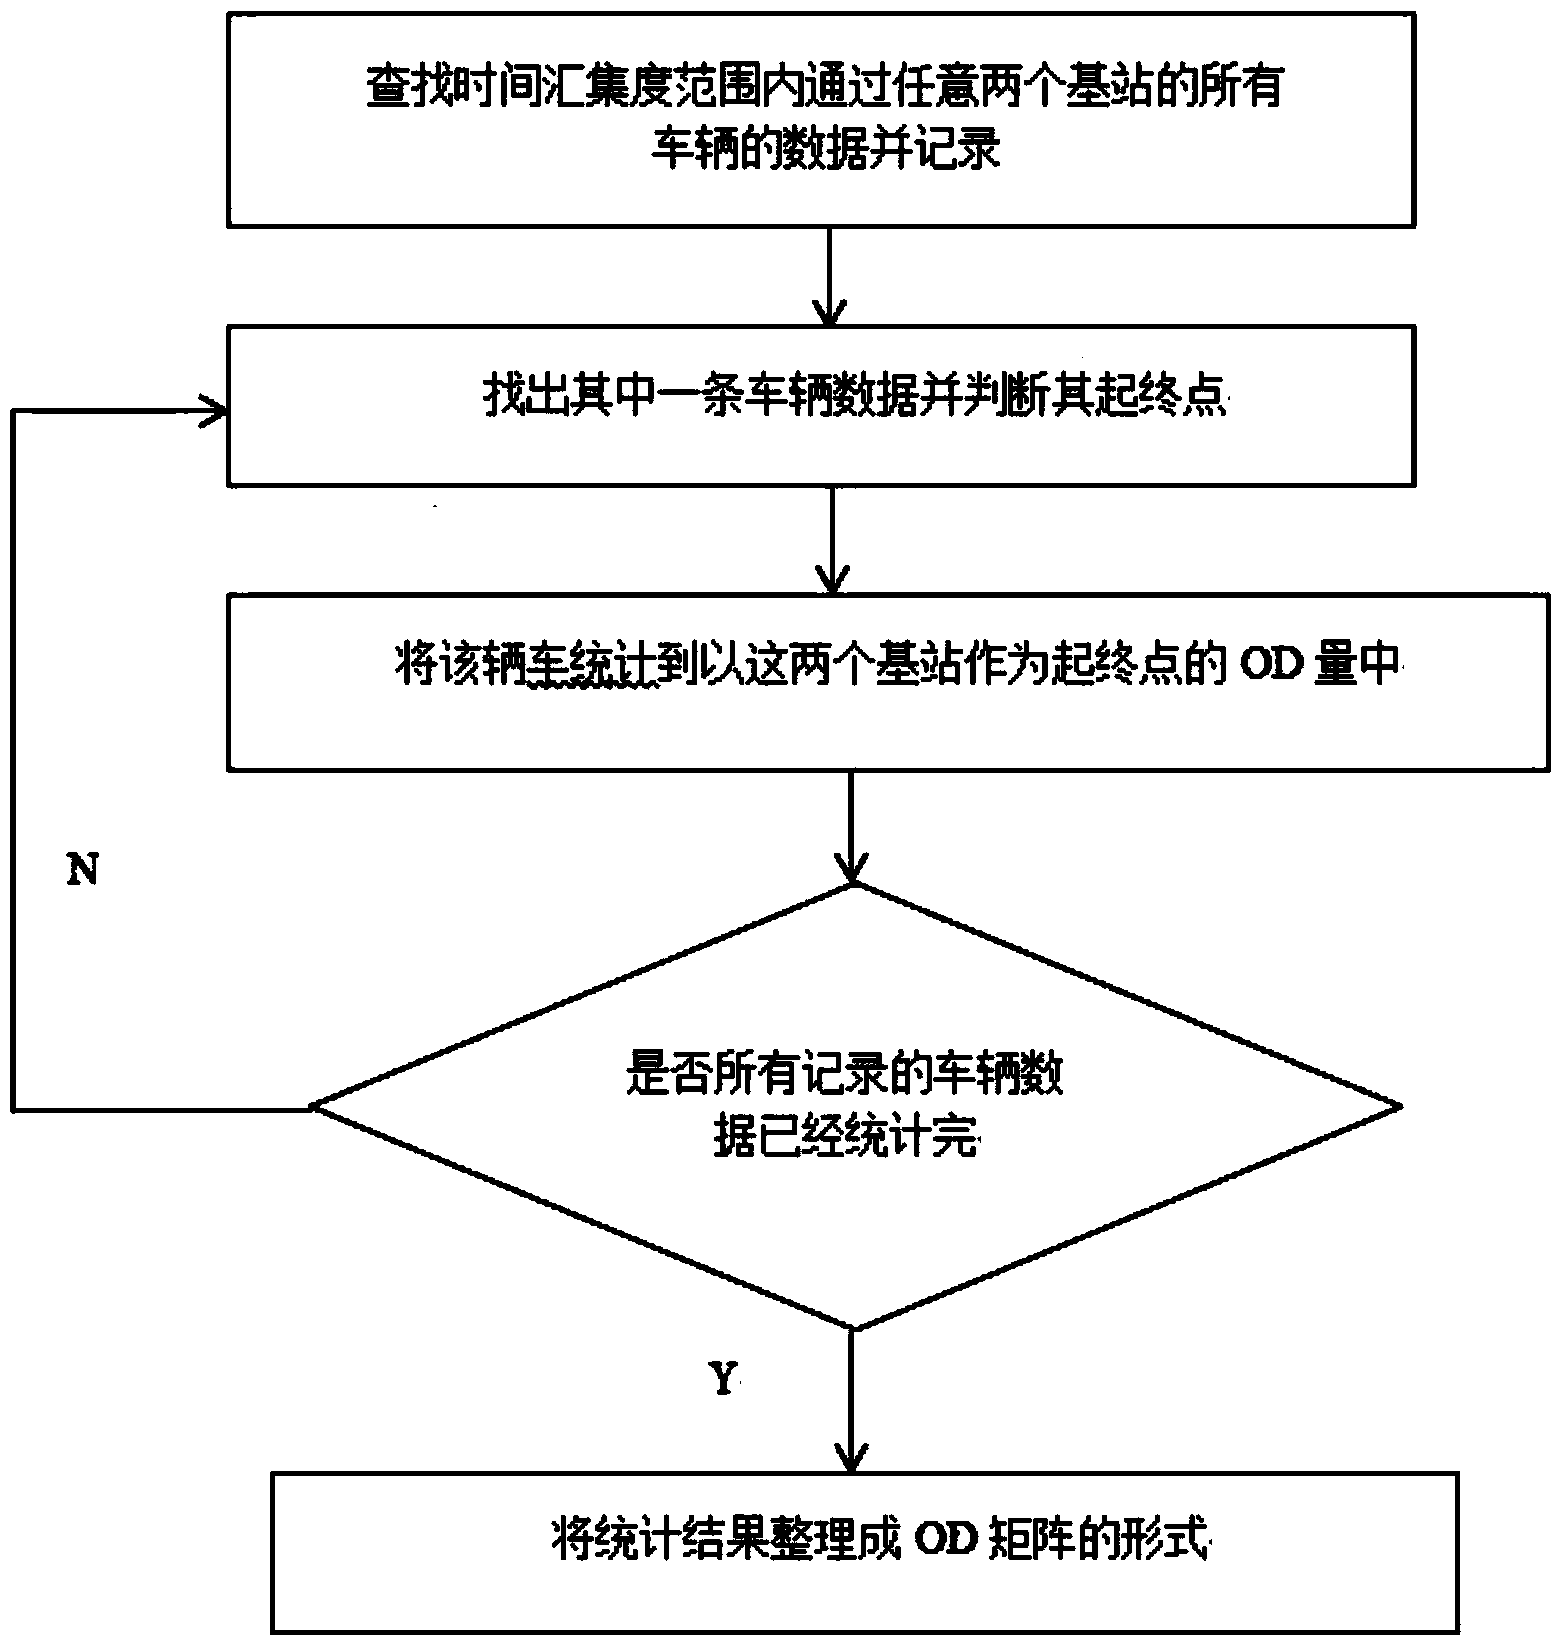
[0024] The purpose of the RFID technology-based road network traffic information flow analysis method of the present invention is to obtain a dynamic OD matrix by processing the vehicle information collected by the RFID base station, and then analyze the road network traffic flow. The method is mainly divided into three steps: firstly, obtain the information of vehicles with the same license plate number in different RFID base stations; secondly, obtain the traffic volume of the traffic flow with any two RFID base stations as travel endpoints; finally, obtain the dynamic OD matrix.
[0025] Specific steps are as follows:
[0026] Step 1: Build a network of RFID base stations.
[0027] (1) Determine the latitude and longitude of the base station, mark the location of the RFID base station on the map, and regard the base station as the travel endpoint of the OD matrix.
[0028] (2) Obtain the vehicle information collected by the RFID base station.
[0029] Step 2: Obtain the information of vehicles with the same license plate number in any two RFID base stations, and count the traffic volume between the RFID base stations.
[0030] The attributes of the data collected by the RFID base station mainly include record serial number, base station number, lane number, start card reading time, end card reading time, tag number, tag type, license plate color, license plate number, model, body color, and environmental protection level. The main attributes of the obtained information of vehicles with the same license plate number in different RFID base stations include the license plate number, the time passing through the starting base station, and the time passing through the destination base station. By counting the number of vehicles with the same license plate number, the start-to-end traffic between points. It should be noted that all the vehicle information collected by the RFID base station for statistics is collected within the selected time aggregation range, and the time points of the selected vehicles passing the base station must fall within the selected time point. time period. The specific situation of the vehicle passing through two base stations A and B continuously is as follows: figure 1 shown. The steps to count the vehicle information of any two base stations with the same license plate number are as follows, and the specific flow chart is attached figure 2 shown.
[0031] (1) Screen out the license plate number and the time information of passing through the base station from the vehicle data collected by the RFID base station.
[0032] (2) During the selected time period, extract the license plate numbers and time information collected by all base stations.
[0033] (3) For each piece of vehicle information collected by the first base station, search for the vehicle information with the same license plate number in the vehicle information collected by the next base station. If there is no such data, the query fails; The time sequence of vehicles passing through these two base stations determines the origin and destination points, and counts the traffic volume of the traffic flow with these two base stations as travel endpoints. Then search for vehicle information with the same license plate number from the vehicle information collected by the next base station until the last base station.
[0034] The specific steps to obtain the traffic volume between RFID base stations are as follows:
[0035] a) Select the time concentration T, and determine the initial time T 0;
[0036] For base stations i and j, filter out T 0 to (T 0 +T) All vehicle data within the time period, including license plate number and passing time;
[0037] b) Record the license plate number collected by base station i as: i 1 i 2 i 3...i m , and the corresponding times are: T 1 , T 2 , T 3...T m; Record the license plate number collected by base station j as: j 1 , j 2 , j3... j n , and the corresponding times are: t 1 , t 2 , t 3...t n. For the data collected by base station i, from i 1 start at j 1 , j 2 , j 3... j n lookup with i 1 The same license plate number, if it exists, record this license plate number as l 1 , and then search for the next license plate number; if it does not exist, then directly search for the next license plate number until i m Find it.
[0038] c) record the same license plate number between different base stations obtained by all inquiries as: l 1 , l 2 , l 3... l k , the time to pass through base station i is: The time of passing through base station j is respectively: Define the logical variable u x and v x as follows:
[0039] u x = 0 ( T i x t j x ) 1 ( T i x t j x )
[0040] v x = 0 ( T i x t j x ) 1 ( T i x t j x )
[0041] The formula for obtaining the traffic volume between base stations is as follows:
[0042] q ij = Σ x = 1 k u x
[0043] a ji = Σ x = 1 k v x
[0044] In the formula: a ij -- Traffic volume from base station i to base station j; a ji -- Traffic from base station j to base station i.
[0045] Step 3: Arrange the obtained OD between any two base stations into the form of OD matrix:
[0046] a 11 a 12 a 13 a 14 . . . . . . . . . a 1 n a 21 a 22 a 23 a 24 . . . . . . . . . a 2 n a 31 a 32 a 33 a 34 . . . . . . . . . a 3 n · · · · · · · · · · · · · · · · a n 1 a n 2 a n 3 a n 4 . . . . . . . . . a nn
[0047] Element a in the above OD matrix ij Indicates the traffic volume from base station i to base station j during the selected time period.
[0048] The specific method of using SAS (statistical analysis system) software to obtain dynamic OD matrix:
[0049] (1) First import all the raw data collected by the RFID base station, and filter out the license plate number and passing time data;
[0050] (2) Use the query statement in SAS to find out all the vehicle data with the same license plate number between different RFID base stations, and use the counting function to count the number of vehicles. This number of vehicles is the OD amount between different RFID base stations;
[0051] (3) Merge all obtained OD quantities into an OD matrix.
[0052] Step 4: Use the obtained dynamic OD matrix to draw the image of the function of traffic flow over time, obtain the trend of traffic flow in the road network over time, and allocate traffic flow to specific road networks according to the principle of balance or non-balance. The principle of balance includes the first principle of Wardrop and the second principle. The first principle of Wardrop is: when the users of the road know exactly the traffic state of the network and try to choose the shortest path, the network will reach an equilibrium state; the second principle of Wardrop is : Under the condition of system balance, the traffic flow on the congested road network should be allocated according to the minimum average or total travel cost. The non-balanced principles mainly include: (1) The shortest path principle, that is, for any OD pair, load all travel volumes on the current shortest path connecting the OD pair, while the loads on other paths are zero. (2) Incremental allocation method, the basic idea is to divide the OD volume into N parts, and then distribute the OD volume N times by the shortest path method; each allocation, use the current flow to modify the impedance function of the road section until the N OD volumes are divided into N parts. The tables are all allocated to the network. (3) The successive average distribution method is an iterative algorithm between the incremental loading method and the balanced distribution method. Its basic idea is to continuously adjust the traffic volume allocated to each road section to gradually reach or approach balance untie. According to the spatio-temporal distribution characteristics of traffic flow, the traffic flow status of the road network in the current state can be transmitted to the driver through electronic communication equipment, reminding the driver which road sections are congested, providing guidance information for travelers, and allowing drivers to choose the best driving At the same time, the real-time traffic status information will also be transmitted to the traffic management department, which can take traffic control measures according to the time and road sections of traffic congestion to relieve traffic pressure.

PUM

no PUM

Description & Claims & Application Information

We can also present the details of the Description, Claims and Application information to help users get a comprehensive understanding of the technical details of the patent, such as background art, summary of invention, brief description of drawings, description of embodiments, and other original content. On the other hand, users can also determine the specific scope of protection of the technology through the list of claims; as well as understand the changes in the life cycle of the technology with the presentation of the patent timeline. Login to view more.

Similar technology patents

Mcthod for rccovering and rebuilding vegetation of Chinese wildrye in soda saline land

InactiveCN1625936AStrong maneuverabilityReduce the cost of artificial breedingHorticulture methodsPloughRevegetation
Owner:NORTHEAST INST OF GEOGRAPHY & AGRIECOLOGY C A S

Classification and recommendation of technical efficacy words

  • Strong maneuverability
  • Easy to modify

Closed-loop testing system for simulating static synchronous compensator and testing method of same

InactiveCN102401863AEasy to modifyMeet precise modelingElectrical testingDevice parametersControl mode
Owner:ELECTRIC POWER RESEARCH INSTITUTE, CHINA SOUTHERN POWER GRID CO LTD
Why Eureka
Try Eureka