Light intensity fluctuation monitoring equipment and method

A technology of light intensity and equipment, used in electromagnetic wave transmission systems, electrical components, transmission systems, etc., can solve the problem of inability to intuitively see the power change trend and change amount, and achieve cost-effective, high sensitivity, and wide power range. Effect

Inactive Publication Date: 2015-07-01
ANHUI QASKY QUANTUM SCI & TECH CO LTD
View PDF9 Cites 3 Cited by
  • Summary
  • Abstract
  • Description
  • Claims
  • Application Information

AI Technical Summary

Problems solved by technology

Existing optical power meters can only read out the current power value, and cannot intuitively see the change trend and amount of power change

Method used


Image

  • Light intensity fluctuation monitoring equipment and method
  • Light intensity fluctuation monitoring equipment and method

Examples


Embodiment 1

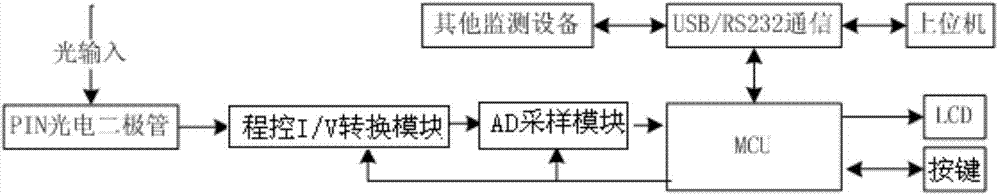
[0027] see figure 1 and figure 2 , The equipment for monitoring light intensity fluctuations includes: PIN photodiode, program-controlled I / V conversion module, AD sampling module, MCU, LCD, communication interface and buttons; the PIN photodiode is electrically connected to the program-controlled I / V conversion module, The program-controlled I / V conversion module is electrically connected to the AD sampling module, the AD sampling module is electrically connected to the MCU, and the MCU is electrically connected to the LCD and the communication interface respectively; the MCU is also electrically connected to the program-controlled I / V conversion module and the AD sampling module. connected; the photodiode is used to convert the input optical signal into a photocurrent proportional to the input optical power; the program-controlled I / V conversion module is used to convert the photocurrent into a certain voltage signal; the A / D conversion The module is used to A / D sample the...

Embodiment 2

[0030] see figure 1 and figure 2 , the method for detecting fluctuations in light intensity comprises the following steps:

[0031] First, after the PIN photodiode receives the light input, it generates a current signal proportional to the input light power;

[0032] Secondly, the current signal is amplified to the set voltage through the program-controlled I / V conversion module;

[0033] Third, the voltage is converted into a digital signal by the AD sampling module and then sent to the MCU for data processing and numerical calculation to obtain the measured optical power value;

[0034] Fourth, the MCU displays the measured optical power value through the LCD.

[0035]As a preferred solution, the optical power value includes a linear value and a logarithmic value. The MCU caches the points corresponding to the collected sampling data, and draws the point values ​​on the coordinate map through the LCD, and then connects all the points into a line, so as to achieve intuit...


PUM


Abstract

The invention discloses light intensity fluctuation monitoring equipment. A photodiode is used for converting input optical signals into the optical current proportional to the input optical power; a program control I/V conversion module is used for converting the optical current into certain voltage signals; an A/D conversion module is used for performing A/D sampling on the voltage signals and transmitting the sampled data into an MCU; after quantification, the MCU is used for quantifying the sample data, converting into an optical power value, transmitting the optical power value to an LCD for displaying and caching points corresponding to the acquired sampled data, the LCD is used for drawing the point values on a coordinate graph, all the points are connected to form a straight line, and the change of the light intensity can be acquired directly according to change and fluctuation of the line. The invention further discloses a light intensity fluctuation monitoring method. The equipment has the advantages of high intelligence level, high accuracy and high flexibility, and optical power measurement of wide dynamic range and high accuracy and consumption measurement of high resolution can be performed; the equipment can be applied to detection of optical communication equipment, optical fibers and optical passive devices and further has the advantages of wide power range, high cost efficiency, high reliability, simple operation and high testing accuracy.

Description

technical field [0001] The present invention relates to a device and method for measuring the stability of optical power through a detection device, in particular to a device and method for monitoring fluctuations in light intensity Background technique [0002] In the optical fiber system, the stability of the light source is particularly important. The stability of the optical power can be measured by the detection equipment, and the detection result is fed back to the processing circuit through the feedback loop. In addition, the performance of optical end equipment and the transmission quality of optical fiber links can be evaluated through testing equipment. Existing optical power meters can only read out the current power value, but cannot intuitively see the change trend and amount of power. Contents of the invention [0003] The technical problem to be solved by the present invention is to provide a device and method for monitoring light intensity fluctuations, wh...

Claims


Application Information

Patent Timeline
Patent Type & Authority Applications(China)
IPC IPC(8): H04B10/079
Inventor 苗春华吕利影刘云赵义博
Owner ANHUI QASKY QUANTUM SCI & TECH CO LTD
Why Eureka
Try Eureka