Method and apparatus for supporting visual representation of intelligent power consumption information

A technology of electricity consumption information and intelligent electricity consumption, applied in program control devices, electrical components, energy-saving computing, etc., can solve problems such as lack of interactive functions, interaction, and lack of performance, so as to enhance user experience, ensure timeliness, and occupancy. small space effect

Active Publication Date: 2015-10-28
STATE GRID CORP OF CHINA +1
View PDF8 Cites 23 Cited by
  • Summary
  • Abstract
  • Description
  • Claims
  • Application Information

AI Technical Summary

Problems solved by technology

[0004] The application of visual display technology in the field of smart electricity has made some progress, but the application development level of the existing visual display software of smart grid is not commensurate with the current business needs, and has not played its due level
Most of them are relatively simple applications, the human-computer interaction interface is not ideal, the application scenarios of geographic technology are simple, there is a delay in the visual display of graphics, and it cannot interact with users in real time, and the user experience ability is not strong; graphics management only plays a role in document management. When the graphics are needed, the user just calls them out for simple viewing, and cannot perform operations such as zooming in on the graphics, and lacks interactive functions on the interface; when a failure or risk occurs on the power site, it cannot be displayed to the user in a timely and intuitive manner. Insufficient early warning and display capabilities have brought difficulties to relevant departments for correct intelligent power consumption management and decision-making

Method used


Image

  • Method and apparatus for supporting visual representation of intelligent power consumption information
  • Method and apparatus for supporting visual representation of intelligent power consumption information
  • Method and apparatus for supporting visual representation of intelligent power consumption information

Examples


Embodiment Construction

[0039] Embodiments of the present invention will be described in detail below:

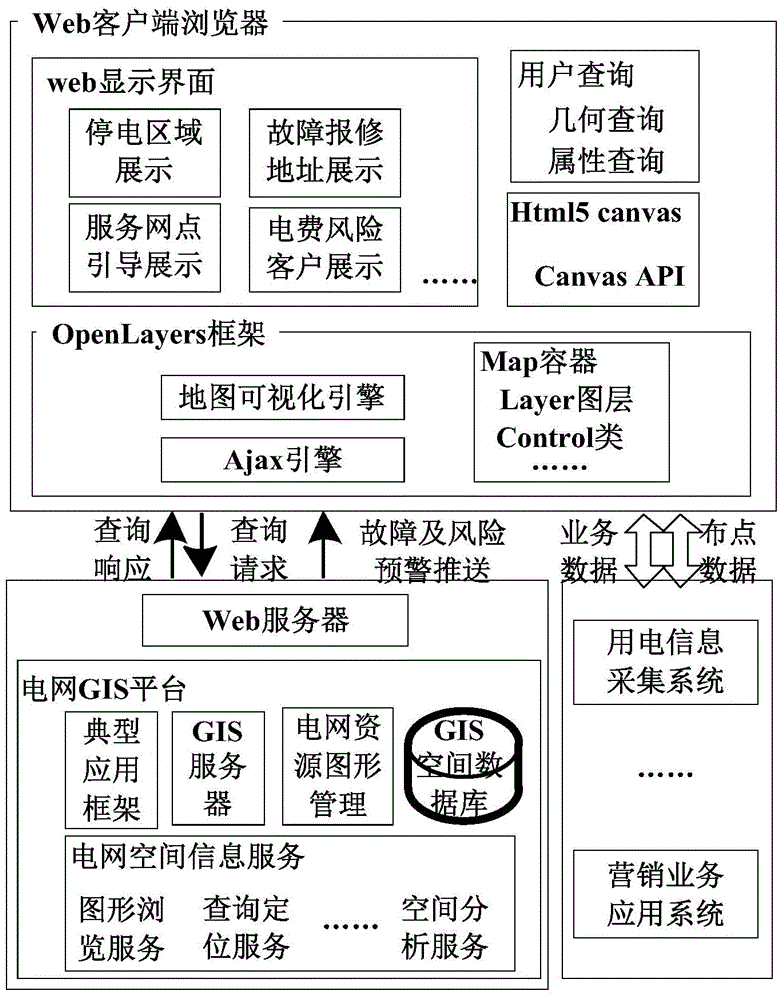
[0040] The method and device supporting the visual display of intelligent power consumption information mainly include four parts: map loading, submission of power consumption information query requests, query request processing, and visual display of power consumption information, as follows:

[0041] Step 1: Load the grid GIS platform smart power space map in the client browser;

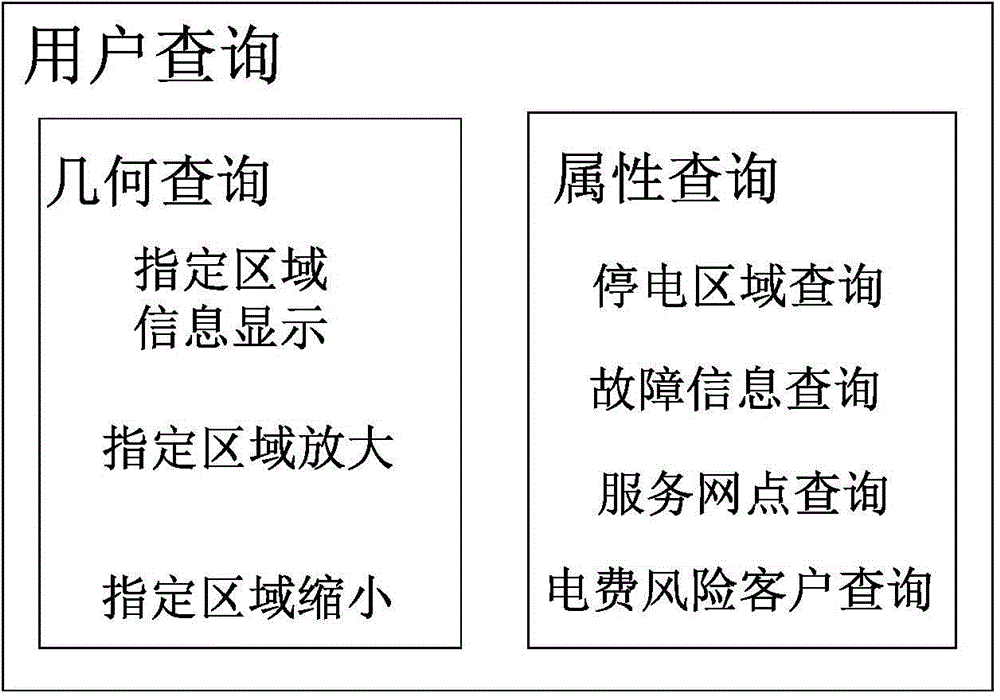
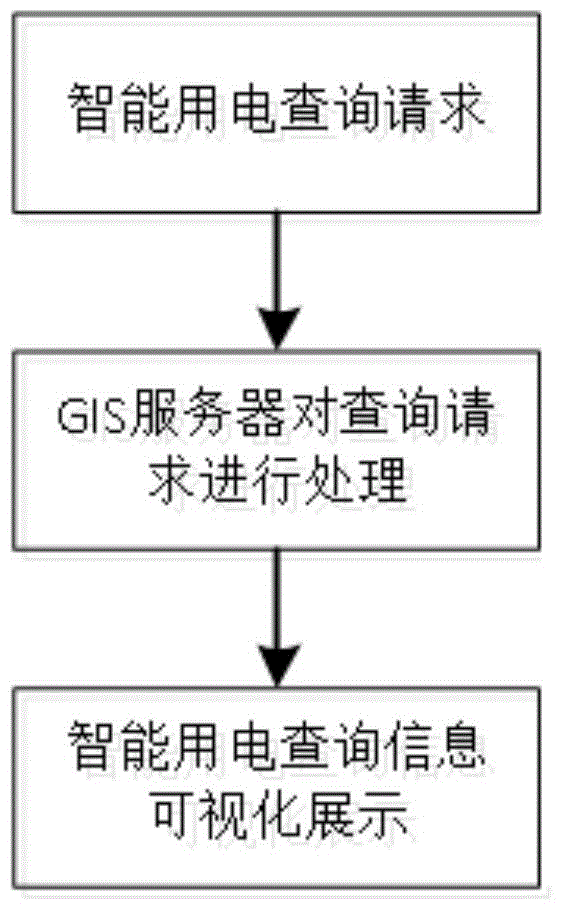
[0042] Step 2: The client browser submits relevant query requests of intelligent power consumption information to the web server through the user query module, including geometric query and attribute query;

[0043] Step 3 After the Web server receives the query request, it is handed over to the GIS server for processing, and the query result of the smart electricity request information is returned to the client browser through the Web server;

[0044] Step 4: When the client browser receives the query result related ...


PUM


Abstract

The present invention discloses a method and apparatus for supporting visual representation of intelligent power consumption information. The implementation steps are as follows: step 1, loading a map on a client browser; step 2, the client browser submitting, to a Web server, a related query request of intelligent power consumption information by using a user query module, wherein the related query request comprises a geometry query and an attribute query; step 3, after receiving the query request, the Web server handing the query request over to a GIS server for processing, and returning a query result of intelligent power consumption request information to the client browser by using the Web server; and step 4, when receiving a related query result of the intelligent power consumption information fed back by the Web server, the client browser displaying the query result. The beneficial effects of the method and apparatus for supporting visual representation of intelligent power consumption information are: according to the present invention, the client browser is developed based on an Openlayers framework, real-time dynamic positioning in the intelligent power consumption target area is achieved by using the Ajax technology, and meanwhile network traffic and load on a server are reduced.

Description

technical field [0001] The invention relates to the field of intelligent power consumption informatization, in particular to a method and device for supporting visual display of intelligent power consumption information. Background technique [0002] In response to the government's call to promote energy conservation and emission reduction, develop a low-carbon economy, and improve service levels, the State Grid Corporation of China has actively changed the development mode of the power grid. . At present, the smart grid has been included in the government's "Twelfth Five-Year Plan" as an important research content. Among the six links of the smart grid, "smart power consumption" promotes energy conservation and emission reduction by optimizing the way users use electricity on the power consumption side, which is directly related to the energy efficiency and economic operation of the power grid. The main way of power grid construction results has a very important position ...

Claims


Application Information

Patent Timeline
Patent Type & Authority Applications(China)
IPC IPC(8): G06F17/30G06F9/445H04L29/06G06Q50/06
CPCY02D10/00
Inventor 蒲箭慕福林郑迎春邹波骆凯波
Owner STATE GRID CORP OF CHINA
Why Eureka
Try Eureka